Release 1 (9.0.1)
Part Number A86720-01
Home |
Book List |
Contents |
Index | Master Index | Feedback |
| Oracle9i OLAP Services Developer's Guide to the OLAP DML Release 1 (9.0.1) Part Number A86720-01 |
|
Defining Data Objects, 7 of 9
A hierarchical dimension is a means of organizing and structuring parent-child (one-to-many) data within a single dimension and using self-relations to organize the values of the hierarchical dimension into groups. A hierarchy exists when values within a dimension are arranged in levels, with each level representing the aggregated total of the data from the level below. Some dimensions have multiple hierarchies based on them.
Hierarchical dimensions allow you to store data of varying levels of aggregation within a single variable. This type of storage affords a quicker response time for users who want to view the data, particularly when the variable is large.
Rather than defining two separate dimensions, one for city and the other for region, you could define a hierarchical dimension named GEOGRAPHY that contains both city and region values.
GEOGRAPHY
--------------
EAST
WEST
BOSTON
SAN FRANCISCO
SEATTLE
You use a hierarchical dimension to define a variable that contains data of varying levels of aggregation within a single variable. This type of storage affords a quicker response time for users who want to view the data, particularly when the variable is large.
Frequently, the cells in the variable that correspond to upper level values in the hierarchical dimension contain the sum or total of the values in the variable's cells that correspond to the lower level dimension values. For example, in a SALES variable that is defined with a TIME dimension, the variable's cells that correspond to each quarter represent the total sales for the months in the quarter.
After you have defined a variable with hierarchical dimensions, you can add variable data to the lowest level of the hierarchy, and then calculate or "aggregate" the values for the higher levels of the hierarchy. For more information on aggregating data, see "Aggregating Data".
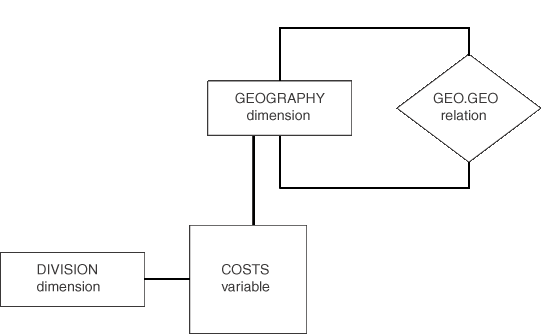
The conceptual diagram below illustrates the GEOGRAPHY dimension that contains values for both cities and regions, the GEO.GEO relation that defines the relationships between cities and regions, the DIVISION dimension that contains the list of divisions, and the COSTS variable that contains the expenses for each DIVISION by city and the totals by region.

The DIVISION and GEOGRAPHY dimensions have the following values.
DIVISION
--------------
DIVA
DIVB

GEOGRAPHY
--------------
EAST
WEST
BOSTON
SAN FRANCISCO
SEATTLE
Assume that the GEO.GEO relation was defined using the following command.
define geo.geo relation geography <geography>
The figure below illustrates the values of a self-relation called GEO.GEO that is defined to assign cities to regions.
GEOGRAPHY       GEO.GEO
-------------- ----------
EAST           NA
WEST           NA
BOSTON         EAST
SAN FRANCISCO  WEST
SEATTLE        WEST
If you enter data at the lowest level (city level) of COSTS, then it has the values shown below.
          ------------------------COSTS------------------------------
          ----------------------GEOGRAPHY----------------------------

DIVISION     EAST       WEST      BOSTON   SAN FRANCISCO      SEATTLE
--------- ---------- ---------- ---------- -------------    ----------
DIVA           NA      NA       27,600.00  10,000.00       40,000.00
DIVB           NA      NA       30,000.00  12,000.00       50,000.00
After you aggregate the data, the COSTS variable has values in all of its cells, including the cells for the totals for the East and West regions.
          ------------------------COSTS------------------------------
          ----------------------GEOGRAPHY----------------------------

DIVISION     EAST       WEST      BOSTON   SAN FRANCISCO      SEATTLE
--------- ---------- ---------- ---------- -------------    ----------
DIVA       27,600.00  50,000.00  27,600.00  10,000.00       40,000.00
DIVB       30,000.00  62,000.00  30,000.00  12,000.00       50,000.00
For more information, see the following table.
|
|
 Copyright © 1996-2001, Oracle Corporation. All Rights Reserved. |
|