Release 2 (9.0.2)
Part Number A90486-02
Home |
Solution Area |
Contents |
Index |
| Oracle9iAS Wireless Getting Started and System Guide Release 2 (9.0.2) Part Number A90486-02 |
|
The system management functions of Oracle9iAS Wireless enable you to centrally administer and configure Oracle9iAS Wireless. All the configuration data is stored in the database. In addition, you can monitor real-time performance data to assess system health and collect data to display historical trends.
You can manage Oracle9iAS Wireless from two views: the Wireless Server view and the Site view.
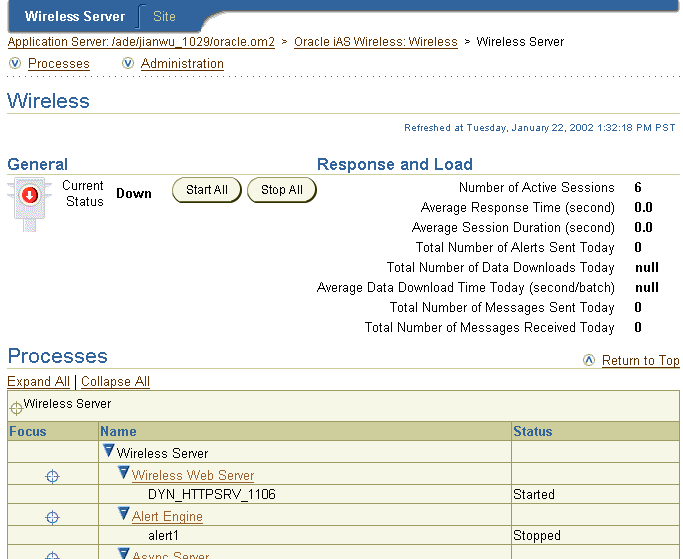
The Wireless Server view enables you to monitor and manage system performance for each server-level process and to start and stop the server processes both as a group and individually.
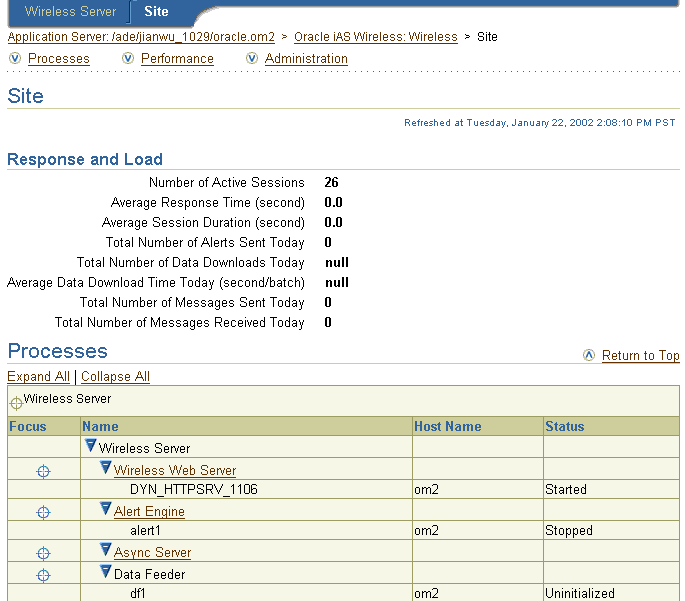
The Site view provides you with an overall view of all processes and their respective machines. The site view enables you to create a common configuration for these machines.
You access the system management and configuration functions for Wireless through the Oracle Enterprise Manager (OEM) console.
To access the OEM console, you enter the following URL into a browser:
Enter your user name and password. The Oracle9iAS Enterprise Manager Home Page appears. From the System Components table, select Wireless. The Wireless page appears and defaults to the Wireless Server tab.
You can use Oracle Enterprise Manager for administering Wireless. Oracle Enterprise Manager provides a Web-based tool that allows you to perform some of the management tasks described in this book.
For more information about Oracle Enterprise Manager, see Oracle9i Application Server Administrator's Guide.
You use the Wireless Server tab to view the performance of the server and the processes.

The Wireless Server tab is divided into sections called General, Response and Load, Processes, and Administration.
The Response and Load section displays the overall performance of the Wireless Server. The Processes section includes a table that lists the following process types:
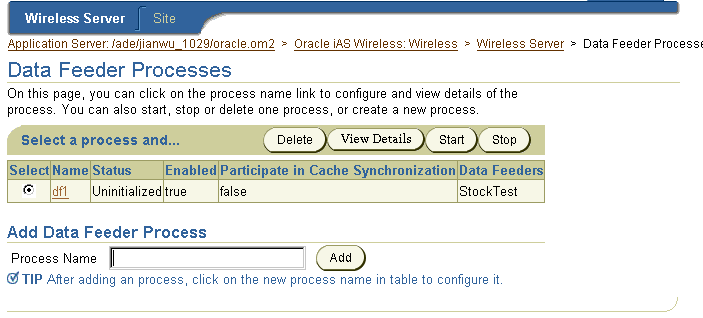
These process types, which represent the top-level of the Wireless server, display as hyperlinks in the Processes table; by clicking one, you drill down to screens that enable you to manage the processes themselves. For example, clicking the Data Feeder hyperlink in the Processes table enables you to navigate to the processes screen, which lists the current data feeder processes.
The processes screen includes a table that lists each processes by name and notes the current status for each process, such as started (running), stopped (suspended), or uninitialized (the process has never been run). The processes screen for the alert engine, data feeder, messaging server, and performance monitor process types also include columns that indicate if a process has been enabled, or if it participates in cache synchronization with other processes. In these columns, true indicates that the process has either been enabled or can particpate in cache synchronization with other processes; a value of false indicates that the process has not been enabled or cannot particpate in cache synchronization with other processes.
In addition to noting the status of a process, you can use the processes screen to perform such functions as adding, editing, deleting, or starting and stopping a selected a process.
.
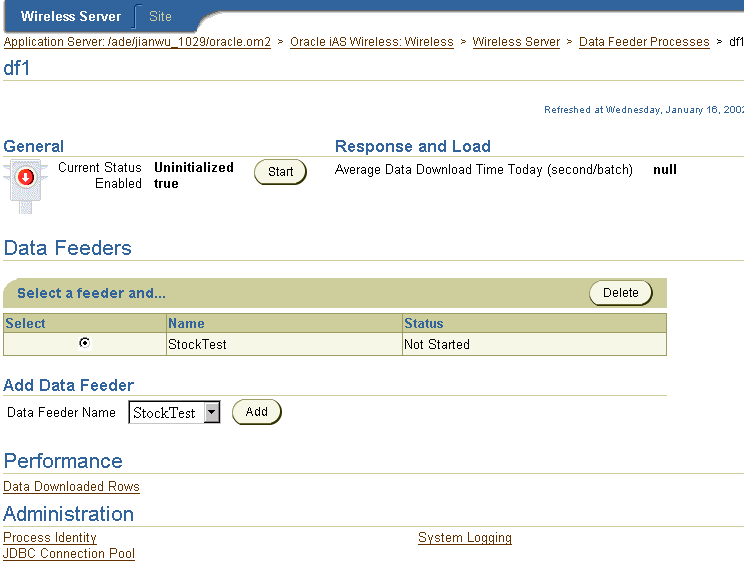
By selecting a process and clicking the View Details button (or by clicking the process itself, which is represented as hyperlink), you can drill down to a detail screen for the selected process. From the detail screen, you can start and stop the process, view its performance statistics, and configure it. A detail screen includes sections entitled General, Response and Load, Performance, and Administration.

From the General section, you can start or stop the selected performance monitor process by clicking the Start or Stop buttons. Next to the Current Status label, the General section displays the current state of the selected process, noting it as started stopped, or uninitialized. The General sections of the detail screens for the alert engine, data feeder, messaging server, and performance monitor process types include the Enabled label. If true displays next to this label, then the has been enabled; if false displays, then the process has not been enabled.
The Response and Load section of the detail screen lists the overall performance statistics for the selected process. The Performance section lists performance metrics types for the selected process. From the Administration section of the screen, you can configure and administer the selected process.
For information on starting and stopping the processes on the server, see Chapter 3, "Server Administration". For information on configuring the server-level processes, see Section 4.1 in Chapter 4, "Server Configuration". See Section 7.1 in Chapter 7, "Server Performance Monitoring" for information on viewing the performance metrics for a process on the server.

Managing Wireless involves drilling down through the top-level screens, such as the Wireless Server tab or the Site tab (described in Section 2.2), to the detail and configuration screens for a selected process. This traversal displays as a navigation path at the top of each screen. For example, Figure 2-4 displays the navigation path from the Wireless Server tab to the detail screen for a data feeder process called df1. Each screen that you visit in this path displays as a hyperlink, enabling you to move back to any screen you have visited by clicking the hyperlink for that screen.

The Site tab enables you to monitor and manage all the processes which run against a common database configuration. The site screen, invoked when you select the Site tab, displays overall site performance metrics in the Response and Load section. The Response and Load section includes overall performance statistics for the site-wide processes of the wireless web sever.
Wireless Management provides you with current snapshots of the system performance metrics of the Wireless Web server, alert, and feed components that enable you to assess system health and performance. These individual metrics may not directly point to a fault in the system; however, building an abductive reasoning model from the data collected by these metrics enables you to diagnose the system's health.
The Site screen includes a Processes table that displays the site-wide process types. The individuals processes are listed under the process types. For each site-wide process, the table lists the name of the process, the machine on which it runs, and current status of the process (started, stopped, or unitialized).
Like the Wireless Server screen, these process types are hyperlinks which give you access to detail screens that enable you to both configure a selected process and view its performance metrics. For more information on configuring the site-wide processes, see Section 4.2 in Chapter 4, "Server Configuration". See Section 7.2 in Chapter 7, "Server Performance Monitoring".
The Administration section of the screen enables you to configure such components as the proxy server, the JDBC connection pool, and runtime configuration (including session life time). In addition, you can upload and download repository objects and register providers. For more information, see Chapter 4, "Server Configuration".

|
|
 Copyright © 2002 Oracle Corporation. All Rights Reserved. |
|