| Oracle® Enterprise Manager Grid Control Quick Start Guide 10g Release 2 (10.2) Part Number B28678-03 |
|
|
PDF · Mobi · ePub |
| Oracle® Enterprise Manager Grid Control Quick Start Guide 10g Release 2 (10.2) Part Number B28678-03 |
|
|
PDF · Mobi · ePub |
Oracle Grid Control provides the richest and most comprehensive monitoring and management for Oracle components – from Oracle Database instances to Oracle Real Application Clusters to Oracle Application Server Farms and Clusters. In addition, to support the wide variety of applications built on Oracle, Grid Control continues to expand its monitoring scope by offering management plug-ins for non-Oracle components, such as third-party databases, third-party middleware, storage and network devices, thus providing Oracle customers a single integrated monitoring solution for any application built on Oracle.
Enterprise Manager can monitor the most common hardware and applications (target types) used in enterprise environments. Considering the complexity of today's data centers and the heterogeneous nature of products, Enterprise Manager provides a modular way to extend monitoring capabilities called Management Plug-ins. Management Plug-ins enable Grid Control to monitor and manage third-party components. These can be developed by Oracle, its partners or its customers.
This chapter consists of the following sections:
By using Management Plug-ins, you can centralize all your management information in the console, map the complete topology of your applications, and perform comprehensive root cause analysis. By default, Enterprise Manager management and monitoring functionality is automatically extended to target instances of the type defined by your Management Plug-in.
Ready-to-use Management Plug-ins are available from the Oracle Technology Network (OTN) at the Oracle Enterprise Manager 10g Grid Control Extensions Exchange located at:
http://www.oracle.com/technology/products/oem/extensions/index.html
This site is your central information source for all Enterprise Manager extensibility information. Partners can build plug-ins for their products, and post the plug-ins there. Customers who want to monitor their custom applications can download documentation and tutorials on how to build custom plug-ins. In addition to tutorials and the latest documentation, you can download ready-to-use Management Plug-ins developed by Oracle as well as third-party integrators. Because this list is continually being updated, you should check the Extensions Exchange site regularly.
Management Plug-ins that are currently available include:
BEA WebLogic Plug-In
Check Point Firewall Plug-in
EMC Celerra Plug-in
F5 BIG-IP Local Traffic Manager Plug-in
IBM DB2 Database Plug-in
IBM WebSphere Plug-in
Juniper Netscreen Firewall Plug-in
Microsoft SQL Server Plug-in
Microsoft Active Directory Plug-in
Microsoft BizTalk Server Plug-in
Microsoft Commerce Server Plug-in
Microsoft Internet Information Services (IIS) Plug-in
Microsoft Internet Security and Acceleration (ISA) Server Plug-in
Microsoft .NET Framework Plug-in
NetApp Filer Plug-in
Some of these, namely F5 BIG-IP v4.5, BEA WebLogic, IBM WebSphere, and NetApp Filers, are shipped with Enterprise Manager Grid Control 10gR2 and therefore not available on the download page.
In this chapter, we will examine how to work with the SQL Server and BEA WebLogic Management Plug-ins.
Linda is responsible for managing many different applications running on a heterogeneous technology stack, including Oracle Database, Oracle Application Server, Microsoft SQL Server and BEA WebLogic. She is already monitoring the Oracle Database and Application Server with Enterprise Manager, and she would also like to incorporate SQL Server and WebLogic into her Grid Control environment. These plug-ins will help Linda seamlessly monitor and manage BEA WebLogic and Microsoft SQL Server with the similar, rich management functionality available for other Oracle products. In addition, the plug-ins also enable Linda to centralize all of the monitoring information in the Grid Control Console, model and view the complete topology of her applications, and perform comprehensive root cause analysis.
The System Monitoring Plug-in for the Microsoft SQL Server extends Oracle Enterprise Manager Grid Control to add support for managing Microsoft SQL Server instances. By deploying the plug-in within your Grid Control environment, you can monitor SQL Server instances, gather configuration data and track configuration changes for SQL Server instances, raise alerts and violations based on thresholds set on monitoring and configuration data, and provide comprehensive reports for the user interface based on the gathered data.
Let us see how Linda can download the Microsoft SQL Server Management Plug-in, and deploy and start managing SQL Server instances from the Grid Control console.
To deploy and monitor the Microsoft SQL Server Management Plug-in:
Locate and download the Management Plug-in from OTN. The Microsoft SQL Server Management Plug-In can be downloaded from: http://www.oracle.com/technology/products/oem/extensions/plugin-ms_sql.html
After logging in to Enterprise Manager as the super administrator, click Setup at the upper-right corner of the Grid Control console and then click Management Plug-ins from the panel on the left.
The Management Plug-ins page appears. This page is used to define new Management Plug-ins, to import Management Plug-ins from or export Management Plug-ins to a Management Plug-in Archive, or to deploy a Management Plug-in into your system.

Click Import to import the plug-in you just downloaded.
Browse to the folder where the plug-in archive file is located and click OK to import it.
The Management Plug-in is extracted from the archive file and imported into the Management Repository, and is ready to be deployed to Management Agents within your Enterprise Manager environment.
From the Management Plug-ins page, select your plug-in and click the Deploy icon on that row.
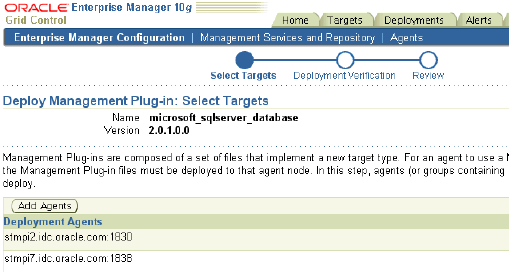
The Deploy Management Plug-in wizard appears.
Specify one or more agents that will monitor your target and click Finish.
Ensure that your preferred credentials are set on these agents.
You now need to specify which SQL Server instances the agent should monitor. Specify a new instance to be monitored by selecting Microsoft SQL Server in the Add list on the home page of the agent and clicking Go.
Specify properties for the SQL Server database and click OK.
For more details, refer to the Microsoft SQL Server Installation Guide. If you want to test the connection to the database, you can click Test Connection before clicking OK. The newly added target appears in the list of monitored targets on the home page of the agent.
Navigate to the SQL Server Plug-in home page.
The Status field tells you whether the target is currently up or down. The Availability field brings up a graph of the target's availability over the past 24 hours. The Alerts section appears if the warning threshold or critical threshold has been exceeded for any of metrics that are being collected.
Click the All Metrics link under Related Links to view a single, comprehensive list of all the metrics available for the particular target.
You can click on any metric to drill-down to see its history.
From the target home page, select the Reports tab and click the View Report arrow to see a list of the kinds of reports you can generate about the SQL Server instance.
For example, the Microsoft SQLServer Space Usage report displays information about storage space used by various databases managed by Microsoft SQLServer.
From the target home page, click the View Configuration link under Related Links.
On this page, you can see detailed SQL Server configuration information, including server, database and registry settings. You can also view configuration history, take configuration snapshots, or compare configurations between different SQL Server instances. All configuration changes that occurred since EM started monitoring this SQL Server instance are automatically tracked.
Linda can similarly include non-Oracle products into the monitoring framework of Grid Control.
The BEA WebLogic plug-in is shipped with Enterprise Manager Grid Control 10gR2 and therefore not available on the OTN download page.
The BEA WebLogic plug-in enables customers to leverage their investment in Oracle Enterprise Manager to manage BEA WebLogic Servers. This plug-in helps customers seamlessly monitor and manage BEA WebLogic with the similar, rich management functionality available for other Oracle products. Customers can get the full benefit of the service dashboard, system dashboard, and topology views for environments that include BEA WebLogic. This Plug-in offers a complete, cost-effective, and easy-to-use solution for application performance management and BEA WebLogic infrastructure management, by providing unique functionality such as early and automatic identification of performance bottlenecks and aggregated metrics for BEA WebLogic Cluster monitoring.
Application performance management enables application owners to actively monitor end-user performance. BEA WebLogic Management allows administrators to scalably, comprehensively, and cost-effectively manage the BEA WebLogic environments. JMX standard-based monitoring architecture for BEA WebLogic allows comprehensive monitoring of WebLogic components, J2EE applications and user defined metrics in J2EE applications. IT organizations can now integrate the management of the JMX-enabled applications into their environment managed by Oracle Enterprise Manager, significantly reducing the time spent on monitoring and increasing the speed of resolution.
A BEA WebLogic server domain is the basic unit of administration for your WebLogic platform applications. The basic domain infrastructure consists of one Administration Server and optional managed servers and clusters. Let us look at how Linda can add a BEA WebLogic server domain and its clusters and managed servers, and then monitor them.
To add and monitor a BEA WebLogic managed server:
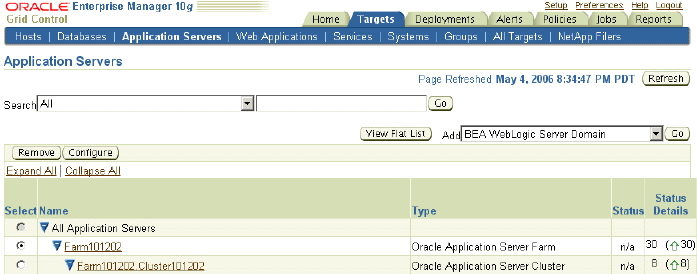
Click Targets and then Application Servers.

Select BEA WebLogic Server Domain from the Add list and click Go.
A wizard appears where you can specify details about the BEA WebLogic Administration Server and choose the clusters and managed server to add to Grid Control for central monitoring.
From the Application Servers page, click the newly added BEA WebLogic server domain to go to its home page.
You can get a cumulative view about status, alerts, policy violations, jobs, and blackouts across all members of the domain. You can start or stop members of the domain and navigate to members of the domain. In addition to the home page, it also has an Administration tab and a Members tab.
Click Members and then click a cluster within the BEA WebLogic server domain to go to the cluster home page.
This page is also accessible from the Application Servers home page. The page is similar to the domain home page and provides cumulative information about members in the cluster. It also has a Metrics tab and a J2EE tab. A BEA WebLogic server cluster has a state: it can be up or down. If at least one server within the cluster is up, then the cluster is considered up.
Click J2EE Applications.
The page displays a list of all J2EE applications deployed to the cluster. If you sort by Application Name, you can easily determine if one server in the cluster is incurring more load or performing less optimally than another. You can drill down to investigate the problem or launch BEA's administration console directly from the Grid Control console to tune the application for better performance.
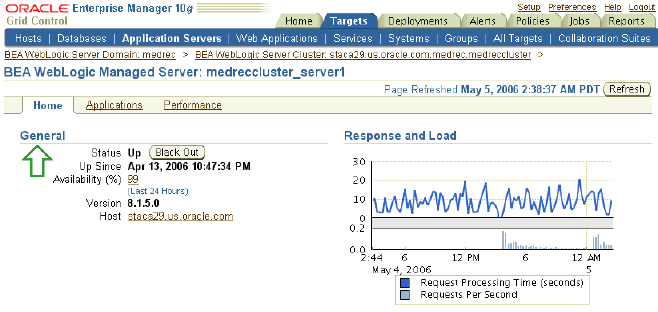
Click a server to see the home page of a BEA WebLogic managed server.
On this page, you can see the status of the server, its version, host, and outstanding alerts. Grid Control monitors over 150 performance metrics for BEA WebLogic, some of which include resource usage, the number of active sessions, top servlets, top JSPs, and JVM performance metrics.

In addition to the monitoring capabilities that Linda attains by adding BEA WebLogic to Grid Control, she can also leverage additional features by creating a service based on those applications deployed to BEA. For each service created, she can set an expected service level and monitor it, analyze end-user performance statistics as real users log in and navigate the application, monitor performance of previously recorded transactions to discover performance problems before end users do, model and view the complete topology of her application, and perform comprehensive root cause analysis.
Oracle By Example (OBE) has a series on the Oracle Enterprise Manager Grid Control Quick Start Guide.
The Management Plug-ins OBE covers the tasks in this chapter with annotated screen shots. It is located at
http://www.oracle.com/technology/obe/obe10gEMR2/Quick_Start/extensibility/extensibility.htm