| Oracle® Database Express Edition 2 Day DBA 10g Release 2 (10.2) Part Number B25107-01 |
|
|
View PDF |
| Oracle® Database Express Edition 2 Day DBA 10g Release 2 (10.2) Part Number B25107-01 |
|
|
View PDF |
As an administrator, you can monitor the activities of the database and its users. You can use this information for tuning, troubleshooting, and more.
This section contains the following topics:
You can use the Oracle Database XE graphical user interface to monitor the current database sessions. This enables you to determine the users who are currently logged in to the database and what applications they are running.
You can also use the Oracle Database XE graphical user interface to kill a session—to cause it to be disconnected and its resources to be relinquished.
This section contains the following topics:
When you view sessions, you can view:
All sessions
Active sessions only
Sessions that match a search string
The default session view shows active sessions only.
To view sessions:
Access the Database Home Page and log in as user SYSTEM.
See "Accessing the Database Home Page" for instructions.
On the Database Home Page, click Administration, and then click Monitor.
On the Database Monitor page, click Sessions.
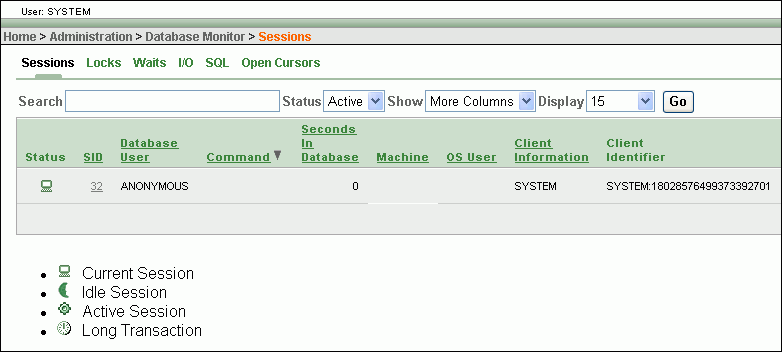
The Sessions page appears and displays the current active sessions.

Note that the session marked with the Current Session icon under the Status column is your session.
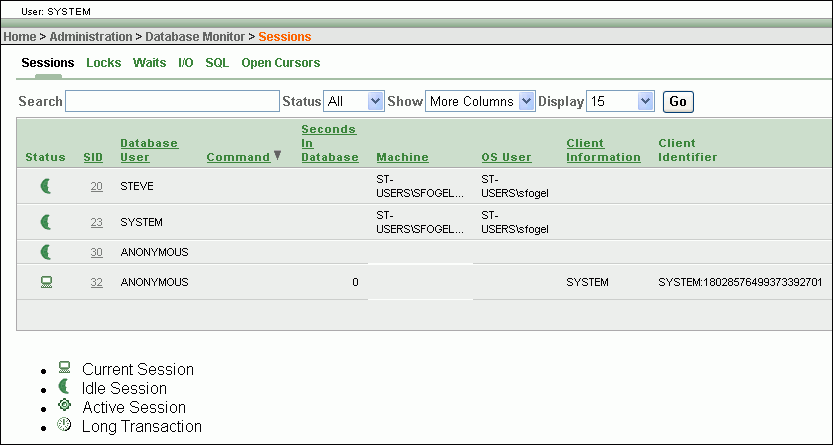
(Optional) In the Status list, select All, and then click Go.
The page displays all sessions, including idle sessions. (An example of an idle session is a SQL Command Line session that is not currently running a command.)

(Optional) Narrow down the sessions list by entering search text into the Search field and clicking Go.
A session is shown if any of the following fields contain the search text: SID, Database User, Machine, OS User, Client Information, Client Identifier, and Module. The search is case-insensitive.
(Optional) Click any of the hyperlinks above the Search field to view the following information for all sessions: Locks, Waits, Input/Output (I/O), running SQL statements, and open cursors.
See the section entitled "Monitoring the Operation of your Database" in Oracle Database Administrator's Guide for discussions of this information.
(Optional) Under the SID column, click a session ID to view the Session Details page for that session. The Session Details page enables you to kill (terminate) the session.
You can use the Oracle Database XE graphical user interface to kill (terminate) a database session. This logs off and disconnects the user running the session. If the user is processing a transaction when you kill the session, the transaction is rolled back.
Reasons to kill a session include the following:
The session is not responding.
You want to perform an administrative function that requires all users to log off first, but the user is not available to end his session.
To kill a session:
View all sessions.
See "Viewing Sessions" for instructions.
Under the SID column, click the session that you want to kill.
The Session Details page appears.
Click Kill Session.
A page appears, prompting you to verify the action.
Click Kill Session again.
With the System Statistics page of the Oracle Database XE graphical user interface, you can monitor the following types of database statistics:
Physical Input/Output (I/O)
Logical I/O
Memory usage
CPU time and wait events
SQL cursors
Transactions committed
This section contains the following topics:
See Also:
Oracle Database Performance Tuning Guide for definitions and discussions of the various system statistics.To view system statistics:
Access the Database Home Page and log in as user SYSTEM.
See "Accessing the Database Home Page" for instructions.
On the Database Home Page, click Administration, and then click Monitor.
On the Database Monitor page, click System Statistics.
The System Statistics page appears.
You can view the delta (relative change) in values between a saved set of statistics and the current set of statistics.
To view the delta in system statistics:
View the System Statistics page.
See "Viewing System Statistics" for instructions.
(Optional) Click Refresh Report until you see the set of statistics that you want to use a your "base" set for comparison.
Click Save Statistics.
The Show delta between current and saved values check box is automatically selected.
Do one of the following:
Wait for some period of time, and then click Refresh Report.
Navigate elsewhere in the Oracle Database XE graphical user interface, and then return to the System Statistics page.
For each individual statistic, the delta between the saved statistic and the current statistic is displayed.
The "top" SQL statements represent the SQL statements that are executed most often, that use more system resources than other SQL statements, or that use system resources more frequently than other SQL statements. Viewing the top SQL statements report that is available in the Oracle Database XE graphical user interface enables you to focus your SQL tuning efforts on the statements that can have the most impact on database performance.
See Oracle Database Performance Tuning Guide for a discussion of tuning SQL statements.
Note:
Some of the statements that appear in the top SQL statements report may be from automatically scheduled internal database jobs (such as statistics gathering jobs) or from the Oracle Database XE graphical user interface itself.To monitor the top SQL statements:
Access the Database Home Page and log in as user SYSTEM.
See "Accessing the Database Home Page" for instructions.
On the Database Home Page, click Administration, and then click Monitor.
On the Database Monitor page, click Top SQL.
The Top SQL page appears.
(Optional) Select from the Top By list and click Go to change the statistic used to determine the statements that are the top SQL statements.
(Optional) Select from the Display Top list and click Go to change the number of SQL statements displayed in the report.
(Optional) Do one or more of the following to narrow down the contents of the report:
Enter search text into the SQL Text field, and then click Go.
Only statements that contain the search text anywhere within them are displayed. The search is case-insensitive.
Enter a number into the Minimum Executions field, and then click Go.
Only statements with executions greater than or equal to the Minimum Executions value are displayed.
Enter a module name into the Module field by clicking the up-arrow icon to the right of the field, clicking a module name in the pop-up Search window, and then clicking Go.
Only statements run by the designated module are displayed.
(Optional) Click the magnifying glass icon to the left of the SQL statement to view the following information:
The complete statement text
The statement query plan
Descriptions of the tables involved in the statement
The Long Operations page of the Oracle Database XE graphical user interface displays statistics on various operations that run for longer than 6 seconds (in absolute time). These operations currently include many backup and recovery functions, statistics gathering operations, and query execution.
To monitor long operations:
Access the Database Home Page and log in as user SYSTEM.
See "Accessing the Database Home Page" for instructions.
On the Database Home Page, click Administration, and then click Monitor.
On the Database Monitor page, click Long Operations.
The Long Operations page appears.
(Optional) Under the SID column, click a session ID to view the Session Details page for that session. The Session Details page enables you to kill the session.
See Also:
"Killing (Terminating) a Session"