| Bookshelf Home | Contents | Index | Search | PDF | |
Siebel Analytics Performance Tuning Guide > The Database Servers > Index Selection >
Determinants of Index Efficiency
The distribution of data within a table's column largely determines the performance of indexes. Earlier sections have already pointed out that if the column contains mostly distinct values, then B-Tree indexes can be quite effective; otherwise, a bitmap index may perform better.
This general notion of selectivity needs to be moderated with a little perspective on how selectivity can be skewed. When this occurs, the index seems magical; sometimes it is very effective and other times it seems to get in the way.
Consider a million row table of contacts used by a medical insurance provider for a state dominated by one large city. Suppose that one borough dominates the large city and the distribution of zip codes throughout the state is not evenly distributed as illustrated in the table below.
If you create a B-Tree index in this situation, then the performance of queries generated by rule-based optimizers will vary by borough. The efficiency of a search for all contacts within a certain zip code would depend largely on the zip code, and the data itself is the determinant. This explains why a query that performs well in some situations is absolutely sluggish in others.
Specifically, a query that searches for 200 contacts in a suburb of a city outside of the Large City, will have an almost instantaneous response time. Oracle would invoke the index on an index range scan, and for each value, the server would go and fetch the corresponding row from the table. Once the dataset is built, Oracle would process the rest of the query.
What about a query against Borough 1 of the Large City? The Rules Based Optimizer in this case performs an index range scan, and iteratively fetches 400,000 records, one at a time. This is going to take a long time.
A solution in this case is to turn to cost-based optimizers which generate query execution plans based on statistics stored in the system catalog and match the granularity of the histograms they generate to your particular workload. These statistics describe the distribution of index key values, and the server can generate plans accordingly.
You can control the granularity of the histograms using options on the analyze statements. For example, this statement creates histograms with 75 buckets:
Analyze table w_person_d
compute statistics for all indexed columns ;To create a histogram on the LAST_NAME column with 200 buckets, you can use the following statement:
Analyze table w_person_d
compute statistics for column LAST_NAME size 200 ;To create a histogram on each of the LAST_NAME and FST_NAME columns with 250 buckets each, use the following statement:
Analyze table w_person_d
compute statistics for columns
LAST_NAME, FST_NAME size 250 ;Remember to drop and recreate the histograms after each ETL load, because the histogram is just a representation of values that can become stale if not recomputed when the table is updated. Stale statistics can lead to suboptimal query plans.
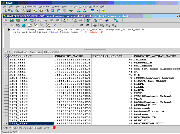
After you create statistics, you can retrieve histograms generated for specific columns using an SQL statement.
You can see the various buckets in the figure above that cost-based optimizers use for a BETWEEN comparison to get the right histogram bucket and the distribution of values. This gives you some insight into the shape of your data.
| Bookshelf Home | Contents | Index | Search | PDF | |
Siebel Analytics Performance Tuning Guide Published: 18 April 2003 |