| Oracle® Business Intelligence New Features Guide Release 10.1.3.3.3 Part No. E10416-04 |
|
 Previous |
 Next |
| Oracle® Business Intelligence New Features Guide Release 10.1.3.3.3 Part No. E10416-04 |
|
 Previous |
 Next |
There are many new and exciting enhancements to the Oracle BI Publisher Template Builder. These new features enable users to use Discoverer worksheets as data sources, generate reports in MS PowerPoint format, and to use more powerful formatting facilities and charts.
The Oracle Business Intelligence Publisher version 10.1.3.3 introduces the following new features for the Oracle BI Publisher Template Builder:
Integration with Discoverer
Support for Microsoft PowerPoint Output
Advanced Form Field Support
Enhanced Chart Builder Features
In support of these new features, you will notice the Oracle BI Publisher menu contains the following new items:
Added to the Insert menu:
Repeating Group
Conditional Format
Conditional Region
For information on these menu items, see Section 11.4, "Advanced Form Field Support".
Added to the Preview menu: PowerPoint
For information on this menu item, see Section 11.3, "Microsoft PowerPoint Output Support".
In addition, two menu items have been changed:
Update Layout Template is now Upload Template
Publish Template As is now Upload Template As
The functionality of these two menu items has not changed.
In this release BI Publisher accepts Discoverer worksheets as report data sources. To facilitate building reports from the Discoverer worksheets, the Template Builder enables you to connect to Discoverer, browse worksheets, and load data to the Template Builder directly from Discoverer.
To open a Discoverer Report in the Template Builder:
Prerequisite: You must have set up integration with Oracle BI Discoverer in the BI Publisher Admin page. For more information see Chapter 14, "Oracle BI Publisher Integration with Oracle BI Discoverer".
From the Oracle BI Publisher menu, select Log On.
Enter your credentials for Oracle BI Publisher. After successfully logging on, the Open Template dialog will launch.
From the Workspace list, select Discoverer. The Select Data Connection dialog will launch.
From the Select Data Connection dialog, select your connection to Discoverer.
Browse the Discoverer folders to locate the worksheet you want to open in the Template Builder. Double click the worksheet. A dialog prompts you to save As Oracle BI Publisher Report.
From the dialog, select the folder on the BI Publisher server where you want to save your BI Publisher report that will use this Discoverer worksheet as the data source.
Click OK to create a report in the folder. This also loads the report structure and data to the Template Builder.
You can now design the template using the full range of Template Builder features on your Discoverer data source.
When finished designing your layout template, save your template to the BI Publisher server by selecting Upload Template from the Oracle BI Publisher menu.
In this release, BI Publisher now supports Microsoft PowerPoint as an output option. The Template Builder also supports PowerPoint as a preview option.
To preview your report in PowerPoint, select PowerPoint from the Oracle BI Publisher Preview menu.
This action will launch Microsoft PowerPoint and display your report as a PowerPoint presentation. Each report page will be displayed on a new slide.
Note that to view BI Publisher PowerPoint output, you must have Microsoft PowerPoint 2003 or later installed on your computer.
For additional information regarding usage and limitations of the PowerPoint output feature, seeChapter 13, "Oracle BI Publisher PowerPoint Output".
In previous releases, BI Publisher inserted abbreviated XSL code into the Form Field Help Text Dialog. Long code strings required inserting code into both the Status Bar and Help Key tabs of the Form Field Help Text Dialog. This made it challenging if you wanted to edit this code. With this release, you can now edit code in the form fields in a single window in the BI Publisher Properties dialog. Further, several additional dialogs have been added to enable you to insert common format constructs in your template and the Template Builder generates the code for you.
The new dialogs simplify the insertion and editing of the following report elements:
Data field Properties
Repeating Groups
Conditional Formatting
Conditional Regions
To open the Properties dialog for a field, perform one of the following:
Double-click the form field in your template.
Right-click the form field, from the menu select BI Publisher and then select Properties.
For recognized code patterns (for example: data value, for-each, for-each-group, conditional formatting) the dialog displays a Properties tab and an Advanced tab (the Repeating Group dialog also displays a Sorting tab). The Properties tab displays modifiable properties for the field. The Advanced tab displays the underlying code. If the code pattern is not recognized, the Properties dialog displays only the Advanced tab with the code from the form field.
Note that each dialog includes a Properties button that enables you to access the Microsoft Word Form Field Help Text dialog.
The following screenshot displays the Properties dialog invoked for a data field:
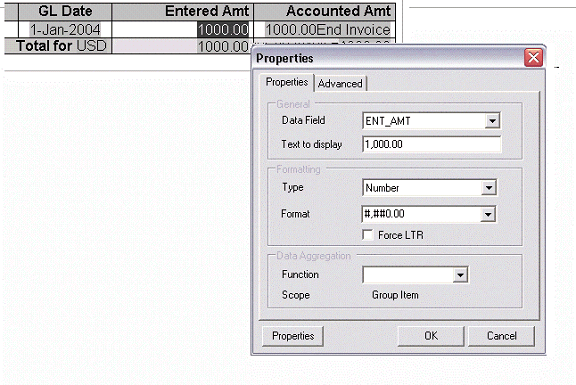
You can set the following properties for a data field:
Data Field — Select the data field from the list of available fields from the loaded data source.
Text to Display — Enter the display text for the form field in the template. This text will be replaced at runtime by the value in the data.
Type — Select the type of data. Options are Regular Text, Number, Date, Current Date, Current Time. The selection in this field will determine the format options.
Format — For any data type except Regular Text, you can select from several number or date display formatting masks or enter your own.
Force LTR — (Force Left-to-Right) This checkbox is only needed if you are using the template in a language that prints the characters from right to left, such as Arabic or Hebrew. In these languages you may want to force left-to-right printing for fields such as phone numbers, addresses, postal/zip codes, or bank account number.
Function — This feature enables you to perform aggregation functions (Sum, Average, Count, Minimum, Maximum) on data fields. For example, if you select sum for a data field, the field will show the sum of all occurring values for this data field depending on the scope (see below).
Scope (informational only) — This field has two possible values:
Group Item — Indicates that the data field is inside a group. If you choose to perform a function on the field, only the occurrences of the field within the current group will be included in the aggregation.
Normal — Indicates that the field is not inside a group. Aggregation functions will be performed on all occurrences of the field in the data.
The following screenshot shows the Advanced tab of the Properties dialog:
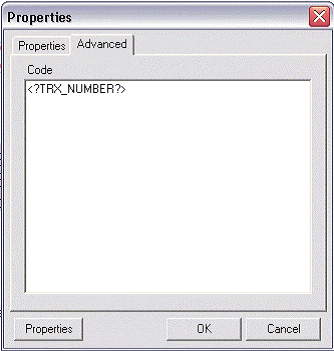
The Advanced tab displays the underlying code.
If the code pattern within the form field is not recognized, the Properties dialog will display this tab only. Use this tab to edit or add code to the form field. Select OK to update the template.
The Properties button opens the Microsoft Word Text Form Field Options dialog.
The Template Builder now enables you to insert and edit for-each and for-each group fields using a Field Properties dialog. Use the dialog to choose the data elements to group and the data element to group them by.
To create a repeating group:
Select the section of the template that contains the elements you want repeated.
From the Oracle BI Publisher menu, select Insert, then Repeating Group.
Enter the appropriate fields in the Field Properties dialog:
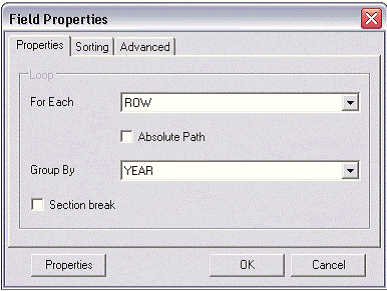
For Each — Select the repeating element to create the loop. When you select the For Each data field you are telling BI Publisher that for each occurrence of the field in the data you want the elements and processing instructions contained within the loop to be repeated.
Please note the following about creating repeating groups:
For loops and groupings not inside another group (that is, outer groups or loops) you must select the repeating XML element to be used. For example if the data set is flat, the only repeatable element is /DATA/ROWSET/ROW. In cases with multiple data sources or hierarchical XML you can choose the data set.
If you are creating nested groups (inserting a loop or group inside of another loop in the template), the For Each field is not updateable because it is already defined by the preexisting outer loop. The For Each field will display "Group Item" to inform you that an outer group is already defined.
Absolute Path — Select this check box to use the Absolute Path to the element in the XML structure. This is important if your data contains the same element name grouped under different parent elements.
Group By — Select a field from the list by which you want to group the data. If you just want to create a simple loop, do not select a group by element.
Section break — Select this box if you wish to create a section break between each loop. It is important to note the following characteristics of this feature:
The section break can be created only on outer loops that surround the whole document.
As a section break, the page numbering is reset, headers and footers are reset, and any running calculations will be reset.
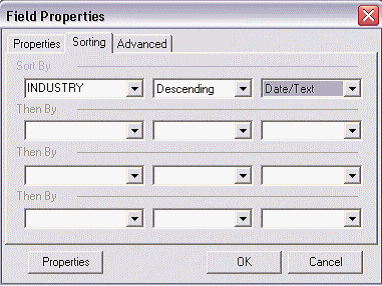
To sort the grouped data, select the Sorting tab. You can select up to four sort-by fields. For each sort by field, select the following:
Sort order — Select Ascending or Descending.
Data type — Select Number or Date/Text. It is important that you select the correct data type to achieve the expected sort order.
Note that if you are sorting by four criteria and your XML data element names are long, you may exceed the character length limitation (393 characters) of the Microsoft Word form field.
The following figure shows the Sort tab of the Repeating Group Field Properties dialog:
To change the text display or edit the code directly, select the Advanced tab.
The following figure shows the Advanced tab of the Repeating Group Field Properties dialog:
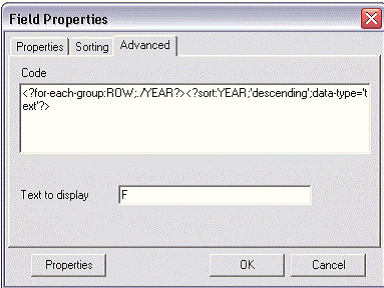
When you have completed the dialog options, click OK. This will insert the form fields in your template. By default, the beginning for-each form field will display the text "F" and will be inserted at the beginning of the selected template section. At the end of the selection, an "E" form field will be inserted to denote the end of the repeating group.
To create a group around an existing block of text in a template:
Select the block of text. For example, a table row.
Note that if any already inserted BI Publisher tags are included in the block, you must be sure to include the beginning and ending tags. For example, if your block contains any opening for-each, if, or for-each-group tags, you must include the end for-each, end-if, and end for-each-group tags in your selection.
From the Oracle BI Publisher menu bar select Insert, then Repeating Group.
In the Field Properties dialog, enter the fields to define the group as described in Section 11.4.3.1, "Creating Repeating Groups".
Click OK to insert the grouping fields around the block. For example, if the block is a table row, the begin field will be inserted at the beginning of the first cell and the end field will put at the end of the last field.
Using the Advanced Form Field features, you can insert simple conditional formats to apply to table rows or cells. The dialog provides several common options that you can select and the Template Builder inserts the code automatically. The Conditional Format dialog supports two conditions per field.
Use this feature to easily construct formats such as displaying values below a certain threshold in one format, and above the threshold in another.
To insert a conditional format:
Place the cursor in the table cell of the data element for which you want to define the condition.
From the Oracle BI Publisher toolbar, select Insert, then Conditional Format.
Enter the following in the Conditional Format dialog:
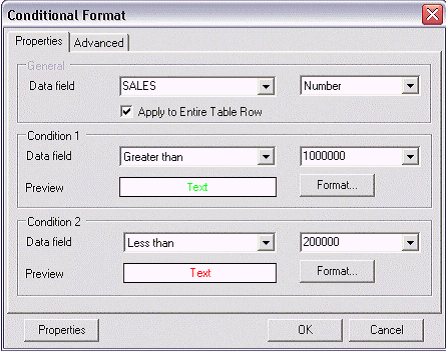
Data Field — Select the element to test for the condition and the data type of the element (Number or Date/Text).
Apply to Entire Table Row — If you want the format applied to the entire table row, not just the cell of the selected element, select this box.
(Condition 1) Data field — Select the comparison operator. The options are:
Equal to
Not equal to
Greater than
Less than
Greater than or equal to
Less than or equal to
Select the value to meet the condition. Note that you may enter an integer, enter text, or select another data element to define a comparison based on the incoming values.
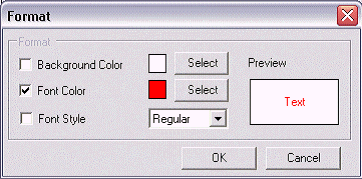
Click Format to define the format you want to apply when the condition is met. Options are background color, font color, and font style (regular, bold, italic, bold italic). Select the box and format of each option you want to apply. After you select the format, the Preview region will display the format chosen.
The following figure shows the Format dialog from the Conditional Format dialog:
Define a second condition if desired.
Select OK. The conditional format field will be inserted as a form field with the display text "C".
To edit the conditional format, double-click the inserted form field to launch the dialog for editing; or, right-click the form field and select BI Publisher, then Properties.
A conditional region is an area that is surrounded by a conditional statement. If the statement tests true, the area is displayed in the report; if the condition tests false, the area is suppressed from the report.
For example, your data contains salary and position information for all employees. Your report contains a table that displays the employee, position, and salary. You want your report to display salary information for managers only. Using the insert conditional region functionality, you can select the region that contains the employee table and insert the condition that the position element must equal manager.
To insert a conditional region:
Select the region that you want to apply the condition to. For example, if you want to display a table only for a certain condition, select the region that contains the table. Note that the region must be inside a loop.
From the BI Publisher toolbar select Insert, then Conditional Region.
The following figure shows the Conditional Region dialog:
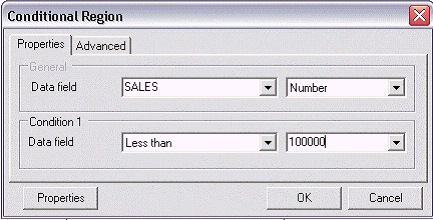
Enter the following fields:
Data field - Select the field to test for the condition.
Select the data type of the field: Number or Date/Text.
Select the comparison operator for the data field. Options are:
Equal to
Not equal to
Greater than
Less than
Greater than or equal to
Less than or equal to
Enter the value to define the condition, or select from the list of data elements to define a conditional relationship based on the value of another data element.
Click OK. The form fields containing the conditional logic are inserted around the region. The beginning form field will display the text "C" and the form field closing the region will display the text "EC".
To edit the conditional region, double-click the inserted form field to launch the dialog for editing; or, right-click the form field and select BI Publisher, then Properties.
Enhancements to the Template Builder's chart builder include:
Support for charts inside a grouping
Support for new chart types
Support for new chart subtypes
In this release you can now insert a chart inside a grouping of data and indicate through the chart builder to base the chart on the surrounding grouping.
The following figure shows the new check box inside the chart builder dialog:

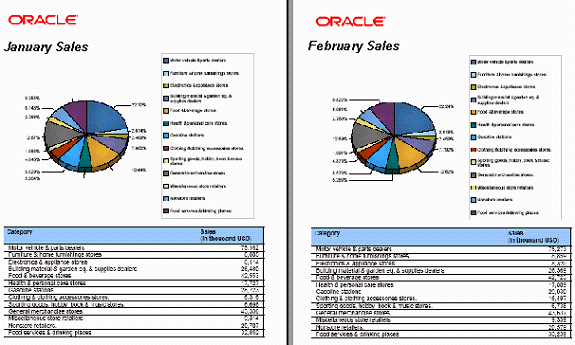
Using this feature, you can easily insert charts within groups to display the data for each grouping. For example: Your report contains sales data. Your template groups the data by year than by month to report the month's sales by industry. To insert a chart to display each month's data, simply insert the chart within the grouping tags and select the Chart is inside group box. This enables you to create reports as shown in the following figure of a sample report with chart inside grouping:
The following chart types are now available as options from the chart builder:
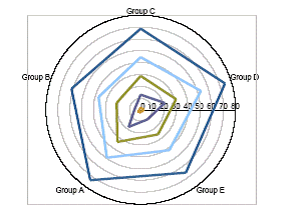
Radar— Plots the same information as a bar graph, but displays the data radiating from the center of the graph.
The following figure shows a sample radar chart:
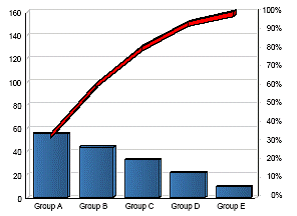
Pareto — Displays criteria in descending order to summarize the relative importance of the differences between groups of data. In this graph type, a line shows a cumulative total of the percentages. When using this type of chart, ensure that you sort the data numerically, descending by value (not label).
The following figure shows a sample pareto chart:
The chart builder now supports additional chart subtypes in this release. Stacked and percentage subtypes are now supported for bar charts, line charts, and area charts. These are displayed as follows on the chart type list:
Bar - Vertical - Percent
Bar - Vertical - Stacked
Bar - Horizontal - Percent
Bar - Horizontal - Stacked
Line - Percent
Line - Stacked
Area - Percent
Area - Stacked