| Oracle® Identity Federation Administrator's Guide 10g (10.1.4.0.1) B25355-02 |
|
 Previous |
 Next |
| Oracle® Identity Federation Administrator's Guide 10g (10.1.4.0.1) B25355-02 |
|
 Previous |
 Next |
This chapter describes how to monitor Oracle Identity Federation. Topics include:
Oracle Identity Federation administrators can derive several important benefits from the ability to monitor key aspects of their federation server deployment. Oracle Identity Federation real-time monitoring features enable you to:
measure application performance
observe application usage patterns
detect potential security issues
monitor availability and other aspects of server operation
This section contains these topics:
Oracle Identity Federation Monitoring provides the administrator with a number of metrics collected from a site's different server instances:
Current Oracle Identity Federation server availability (Up/Down)
Server availability over a user-defined time period
Authentication requests sent by the service provider over a user-defined time period, categorized by:
total number of authentication requests sent
total successful requests
total failed requests
Authentication requests received by the identity provider over a user-defined time period, categorized by:
total number of authentication requests received
total successful requests
total failed requests
Name identifier registration requests sent by the identity provider over a user-defined time period, categorized by:
total number of name identifier registration requests sent
total successful requests
total failed requests
Name identifier registration requests received by the identity provider over a user-defined time period, categorized by:
total number of name identifier registration requests received
total successful requests
total failed requests
Name identifier registration requests sent by the service provider over a user-defined time period, categorized by:
total number of name identifier registration requests sent
total successful requests
total failed requests
Name identifier registration requests received by the service provider over a user-defined time period, categorized by:
total number of name identifier registration requests received
total successful requests
total failed requests
Federation termination requests sent by the identity provider over a user-defined time period, categorized by:
total number of federation termination requests sent
total successful requests
total failed requests
Federation termination requests received by the identity provider over a user-defined time period, categorized by:
total number of federation termination requests received
total successful requests
total failed requests
Federation termination requests sent by the service provider over a user-defined time period, categorized by:
total number of federation termination requests sent
total successful requests
total failed requests
Federation termination requests received by the service provider over a user-defined time period, categorized by:
total number of federation termination requests received
total successful requests
total failed requests
The degree of aggregation depends on the type of information being presented. Some data is specific to a server instance, other data may apply to a server acting in a specific role such as Identity Provider, and still other data may be aggregated across all server instances.
Oracle Identity Federation monitoring components include:
Metrics Collection Engine
Consisting of program logic that provides a framework for metric collection, this component is responsible for tracking and caching the metrics generated by an Oracle Identity Federation instance. Events such as requests, responses, and errors provide the inputs for metrics collection.
Data Transfer Module
This tool formats the collected data into an appropriate format and makes it available for use by other monitoring components.
Monitoring Agent
The Monitoring Agent periodically requests data from various Oracle Identity Federation instances. The agent consults a configuration file to determine which instances are to be queried, and the query interval. It then issues the appropriate requests to the data transfer modules of the relevant instances.
Data collected by the Monitoring Agent is written to an in-memory cache. The data is also archived to a log file.
Monitoring Console
The Monitoring Console is the interface that Oracle Identity Federation administrators use to view the collected metrics.
Archive Log
This component allows the Monitoring Agent to save metrics to disk.
Metrics collection, handling, and transfer components reside in individual Oracle Identity Federation instances. The Monitoring Agent and Monitoring Console are bundled together as a separate J2EE application.
Figure 8-1 shows how requests, metrics, and supporting data flows between and is used by the Monitoring Agent, Monitoring Console, and other Oracle Identity Federation components.
The flow of data can be described as follows:
The Monitoring Agent periodically sends HTTP requests to Oracle Identity Federation.
Individual instances of Oracle Identity Federation utilize the data collection and formatting modules to gather and return their respective federation statistics to the Monitoring Agent.
The Monitoring Agent writes the data retrieved from Oracle Identity Federation to an in-memory cache.
The Monitoring Agent retrieves data from the in-memory cache when it needs to send the data to the Monitoring Console to satisfy a user request.
The Monitoring Agent writes the data retrieved from Oracle Identity Federation to a log file for archival purposes.
In the future, the Monitoring Agent will also be able to retrieve data from log files and send it to the Monitoring Console to satisfy user requests.
The Monitoring Console queries the Monitoring Agent for a specific set of metrics collected by Oracle Identity Federation.
The Monitoring Agent retrieves data from the cache (Step 4) and sends a set of metrics satisfying the query back to the Monitoring Console, where it is displayed to the user.
The Oracle Identity Federation Monitoring Console provides the following types of metrics for server administrators:
Server availability metrics
Protocol metrics on requests sent and received by providers, including:
Authentication requests
NameID requests
Federation termination requests
This section describes and provides examples of the Monitoring Console pages:
To log into Oracle Identity Federation Monitoring Console:
On all platforms, start the login process by pointing your browser to the login URL:
http://machine-name:open-port/fedmon
Log in to the Monitoring Console by entering the username oif_mon and the password supplied during installation.
The home page for the Oracle Identity Federation Monitoring Console contains a Monitored Installations table, which displays a list of all monitored server instances.
Monitoring Console Metrics Page
Selecting a server instance takes you to the metrics pages of the Oracle Identity Federation Monitoring Console for that instance. Each metrics page consists of two panels. The top panel allows you to compose a metric query. The bottom panel displays the results.
The different metrics pages are described in "Monitor Agent Home".
The Configuration tab allows you to monitor additional server instances and to maintain currently monitored installations.
See "Managing Monitored Installations" for details.
The home page is the starting point for monitoring Oracle Identity Federation. It contains:
The current status of the Monitor Agent - running or stopped. Click the button to change the status of the Monitor Agent.
A table showing the installations being monitored by the agent. Click on the link in the Identity Provider or Service Provider column to view statistics for that role.

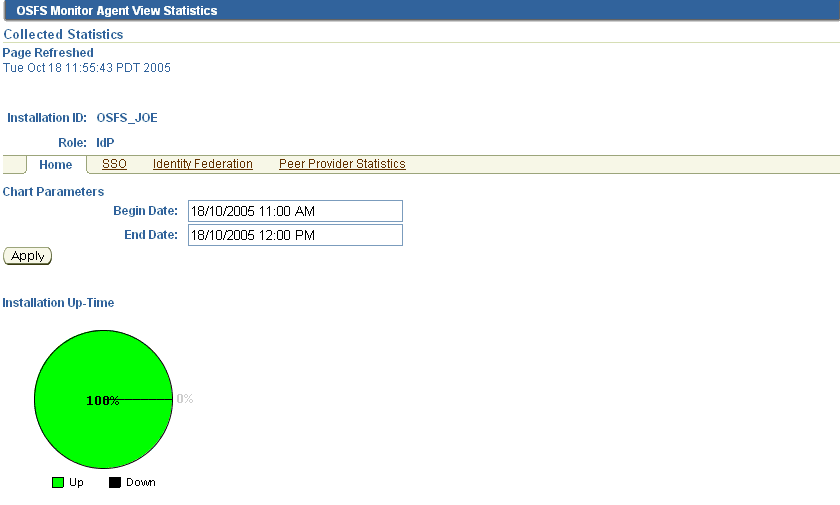
This is the home page for viewing identity provider statistics for an installation.
Fields at the top of the page let you control chart parameters:
Begin Date is the start date and time of the monitored period.
End Date is the end date and time of the monitored period.
Click the Apply button to refresh the display using the specified parameters.
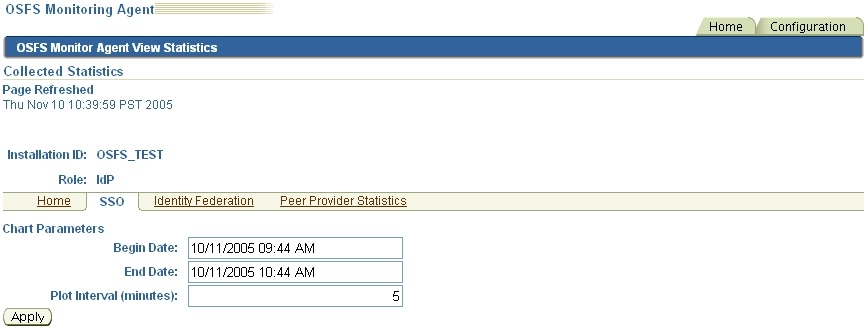
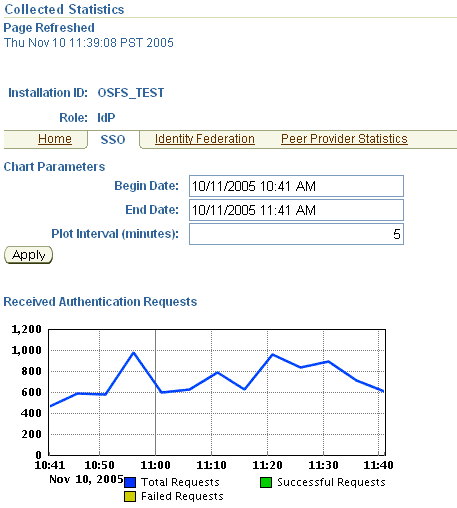
This page displays authentication requests received by an identity provider in a specified period. The server instance ID and the role (IdP) are displayed at the top of the page.
Fields at the top of the page let you control chart parameters:
Begin Date is the start date and time of the monitored period.
End Date is the end date and time of the monitored period.
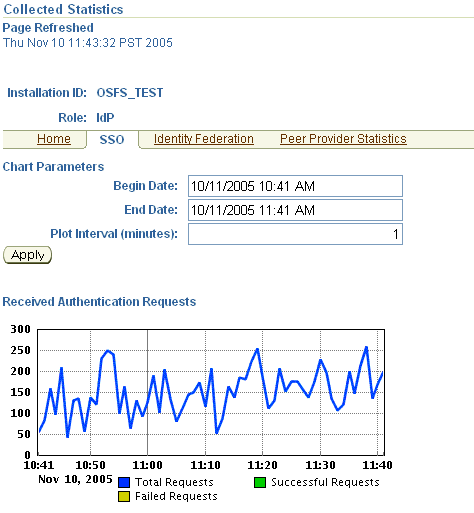
Plot Interval is the interval, in minutes, to use for the chart's horizontal axis.
Click the Apply button to refresh the display using the specified parameters.
The chart shows total, successful, and failed requests in the period.

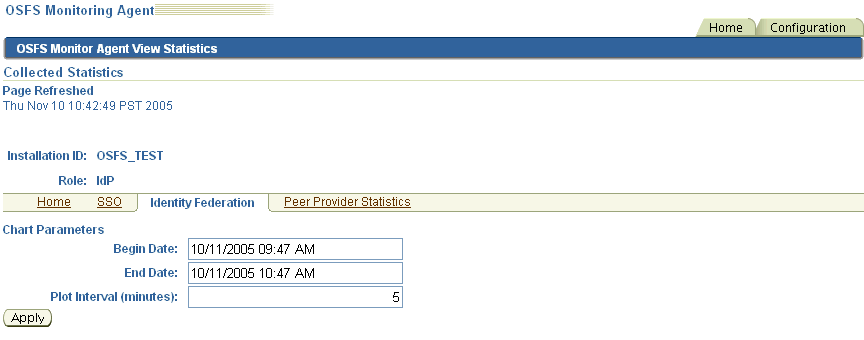
This page displays Register NameID and Federation Termination requests sent to and received by an identity provider in a specified period. The server instance ID and the role (IdP) are displayed at the top of the page.
Fields at the top of the page let you control chart parameters:
Begin Date is the start date and time of the monitored period.
End Date is the end date and time of the monitored period.
Plot Interval is the interval, in minutes, to use for the chart's horizontal axis.
Click the Apply button to refresh the display using the specified parameters.
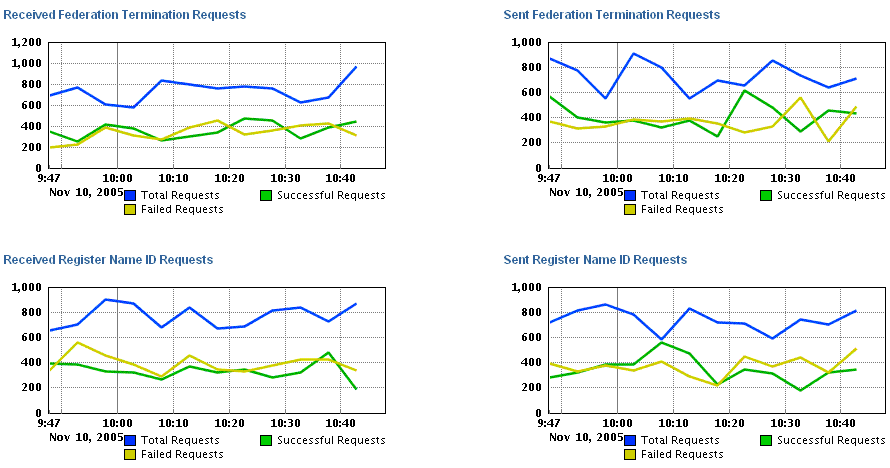
The charts show Register NameID and Federation Termination requests sent and received in the period.
This page displays summary statistics about requests exchanged between an identity provider and peer providers in the circle of trust in a specified period. The server instance ID and the role (IdP) are displayed at the top of the page.
Fields at the top of the page let you control chart parameters:
Begin Date is the start date and time of the monitored period.
End Date is the end date and time of the monitored period.
Click the Apply button to refresh the display using the specified parameters.
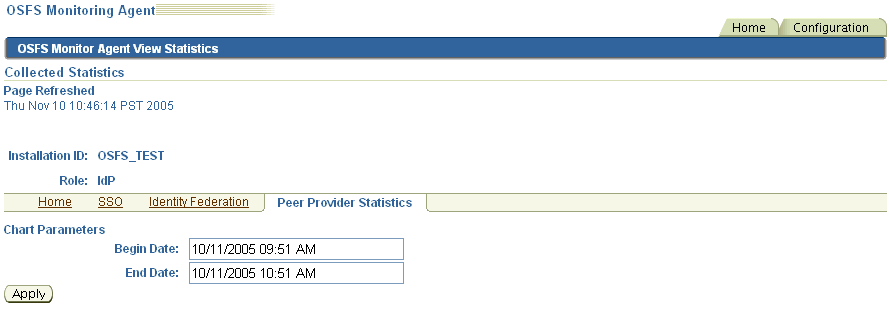
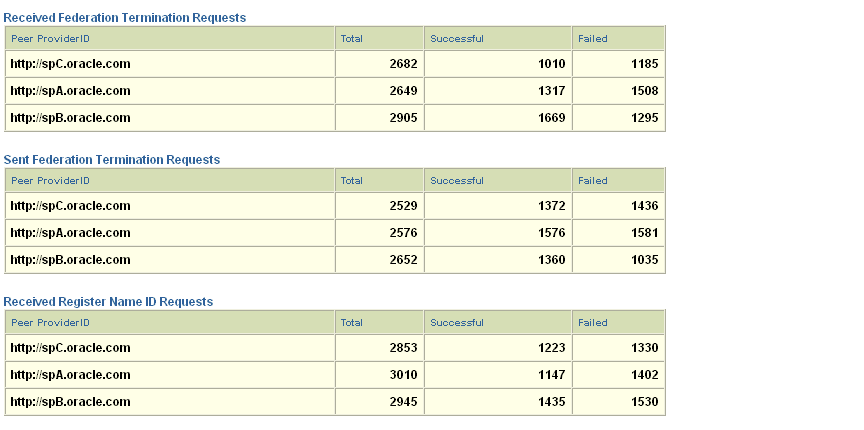
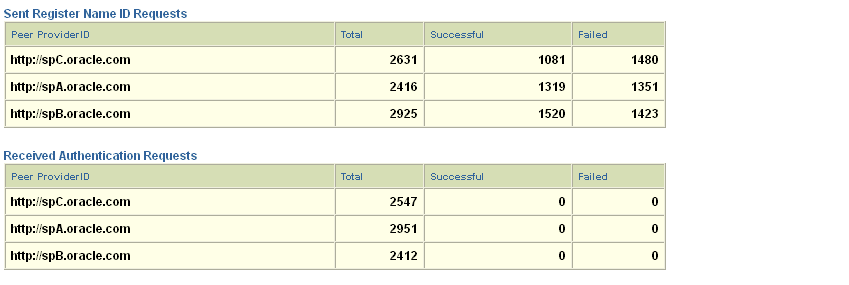
The display includes this information about requests exchanged with peer providers:
Federation termination requests sent and received.
NameID requests sent and received.
Authentication requests received.
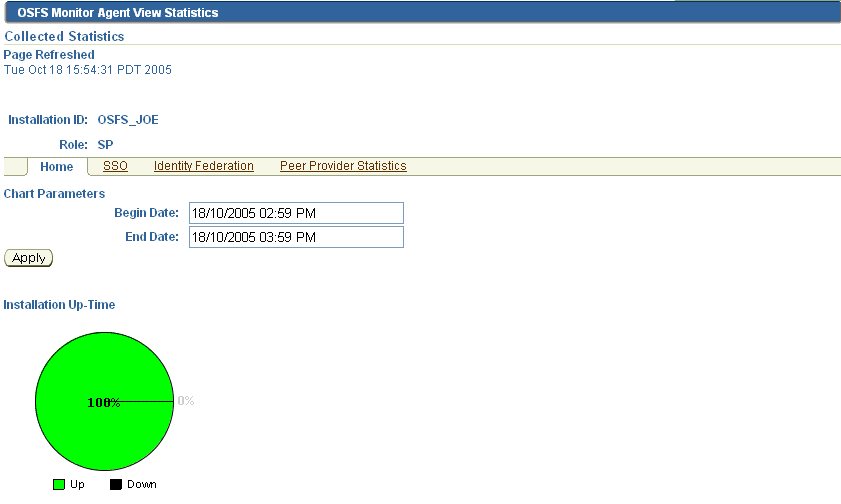
This is the home page for viewing service provider statistics for an installation.
Fields at the top of the page let you control chart parameters:
Begin Date is the start date and time of the monitored period.
End Date is the end date and time of the monitored period.
Click the Apply button to refresh the display using the specified parameters.
This page displays authentication requests sent by a service provider in a specified period. The server instance ID and the role (SP) are displayed at the top of the page.
Fields at the top of the page let you control chart parameters:
Begin Date is the start date and time of the monitored period.
End Date is the end date and time of the monitored period.
Plot Interval is the interval, in minutes, to use for the chart's horizontal axis.
Click the Apply button to refresh the display using the specified parameters.
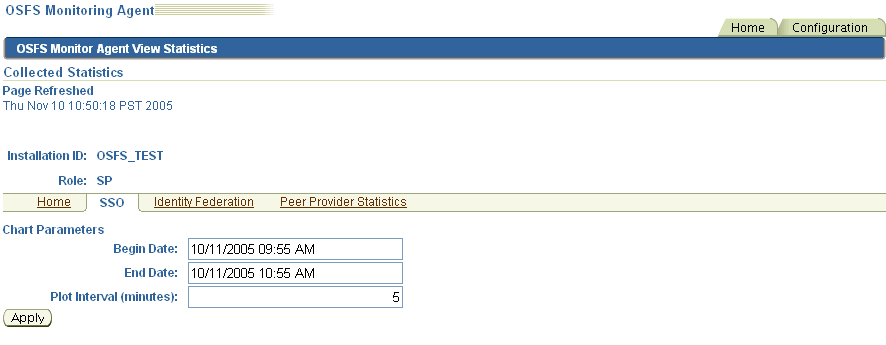
The chart shows total, successful, and failed requests in the period.

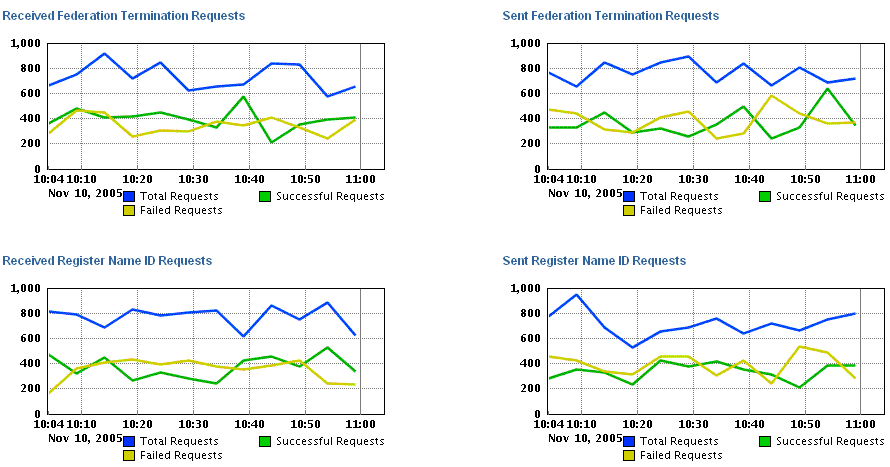
This page displays Register NameID and Federation Termination requests sent to and received by a service provider in a specified period. The server instance ID and the role (SP) are displayed at the top of the page.
Fields at the top of the page let you control chart parameters:
Begin Date is the start date and time of the monitored period.
End Date is the end date and time of the monitored period.
Plot Interval is the interval, in minutes, to use for the chart's horizontal axis.
Click the Apply button to refresh the display using the specified parameters.
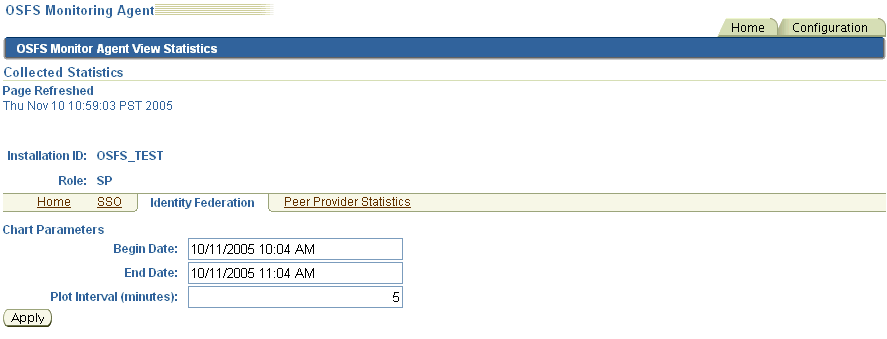
The charts show Register NameID and Federation Termination requests sent and received in the period.
This page displays summary statistics about requests exchanged between a service provider and peer providers in the circle of trust in a specified period. The server instance ID and the role (SP) are displayed at the top of the page.
Fields at the top of the page let you control chart parameters:
Begin Date is the start date and time of the monitored period.
End Date is the end date and time of the monitored period.
Click the Apply button to refresh the display using the specified parameters.
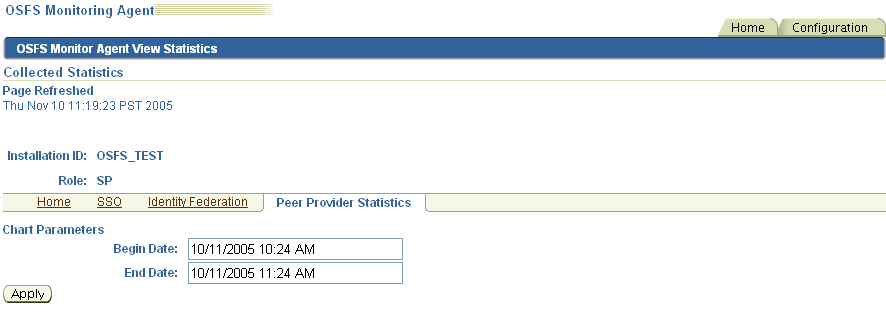
The display includes this information about requests exchanged with peer providers:
Federation termination requests sent and received
NameID requests sent and received
Authentication requests sent
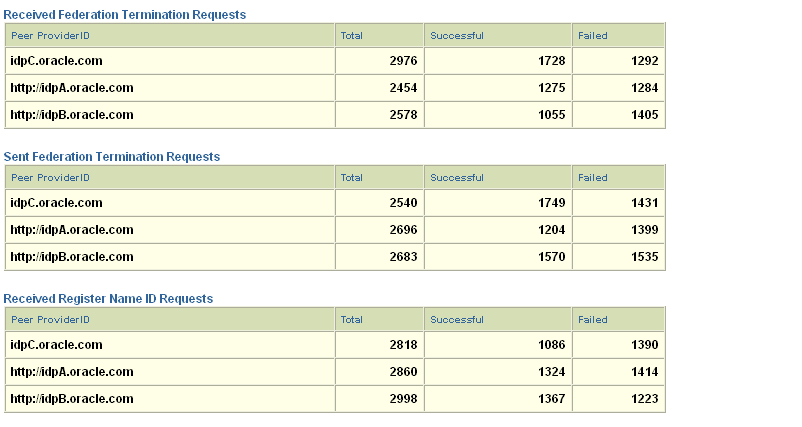
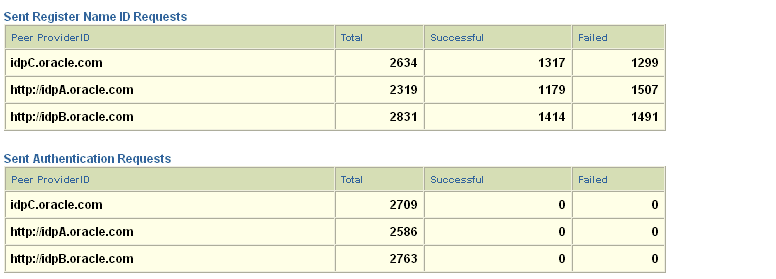
The metrics display at the Monitoring Console can be controlled in these ways:
Refreshing the browser.
Clicking the Apply button located under the Chart Parameters section of the display.
Changing the Begin and End Date chart parameters to vary the period included in the display, and clicking Apply.
Changing the Plot Interval chart parameter on time series charts to change the chart granularity.
For example, here is a display of authentication requests received at an IdP, using a 5 minute plot interval:
And the same chart using a 1 minute plot interval:
The Configuration tab of the Oracle Identity Federation Monitoring Agent allows you to monitor additional server instances and to maintain currently monitored installations.
You configure the monitoring agent with these pages:
The Monitored Installations page displays the Oracle Identity Federation instances being monitored by the Monitoring Agent.

Installation ID
This is the server's installation ID. Any user-friendly identifier can be chosen, since the entry does not need to correspond to any configured value such as a server ID.
Federation Server URL
This is the Oracle Identity Federation server URL, and is based on the following template:
http(s)://hostname:port
Identity Provider (IdP) Enabled
Indicates whether IdP monitoring of this instance is enabled at the Monitoring Agent site.
Service Provider (SP) Enabled
Indicates whether SP monitoring of this instance is enabled at the Monitoring Agent site.
Actions
Buttons on this page provide the following functions:
Remove - removes this server from the list of monitored servers.
Update - updates the server information.
Add - allows you to add another server to be monitored.
This page allows you to view and update information about the monitoring statistics repository.
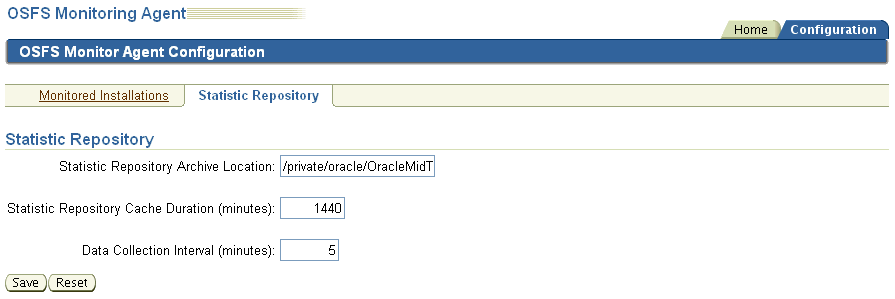
Statistics Repository Archive Location
This is the location on disk where the repository resides.
Statistic Repository Cache Duration
This is the time, in minutes, that the repository data is maintained before being flushed from cache.
Data Collection Interval
This is the frequency, in minutes, at which the monitoring agent collects data for the monitored servers.
Actions
Buttons on this page provide the following functions:
Save - updates the repository information.
Reset - resets the original values that were displayed on the screen before you made any changes.
To set up metrics archival, you use the Statistics Repository page of the Oracle Identity Federation Monitor Agent Configuration tab. The relevant fields are:
Statistics Repository Archive Location - specify the location of the archive file on disk.
Statistic Repository Cache Duration - specify the interval, in minutes, after which the data present in the cache is discarded.
|
Note: Newly collected data is written simultaneously to both the cache (memory) and the archive (disk), but data is never transferred from the cache to the archive. |
Data Collection Interval - enter the frequency, in minutes, at which the monitoring agent should collect data for the monitored servers.