5 Host and Third-Party Target Management
Today's IT infrastructure has evolved to include a variety of server platforms from different vendors such as Red Hat, SUSE, Sun, IBM, HP, and Windows. A typical enterprise also contains hardware components and applications from a number of vendors to run services, provide storage, perform load balancing, and control IP traffic.
Out-of-box, Enterprise Manager allows you to centrally manage more than just your Oracle infrastructure:
-
Monitor and maintain the operating system and hardware for the hosts running your Oracle software.
-
Monitor IBM and Oracle application servers and clusters, F5 Server Load Balancers, Network Appliance Filers.
This chapter contains the following major sections:
Host Management
With the array of available server platforms, it becomes more and more difficult for system administrators to maintain the operating systems and hardware for the server, or host, on which Oracle software runs. With Grid Control, as soon as a Management Agent is deployed to the host, Grid Control automatically starts monitoring alert and configuration information for that machine. System administrators—and anyone who requires host information, such as DBAs managing databases on those hosts—benefit from Grid Control's host management feature.
Note:
To access the host management pages in Grid Control, do the following:-
Click the Targets tab.
-
Click the Hosts subtab.
This will display all the monitored hosts in your enterprise. Click the Help link on any page to access the Grid Control online help system.
Host management allows users to:
-
Analyze performance trends for host hardware to predict future performance
-
Measure service levels by monitoring host performance in real-time
-
Validate software and hardware configuration across the enterprise
Monitoring Hosts
Like for other managed targets, Grid Control's full suite of monitoring features, including alerts, custom notifications, blackouts, corrective actions, monitoring templates, and more, are available for hosts.
Host Home Page
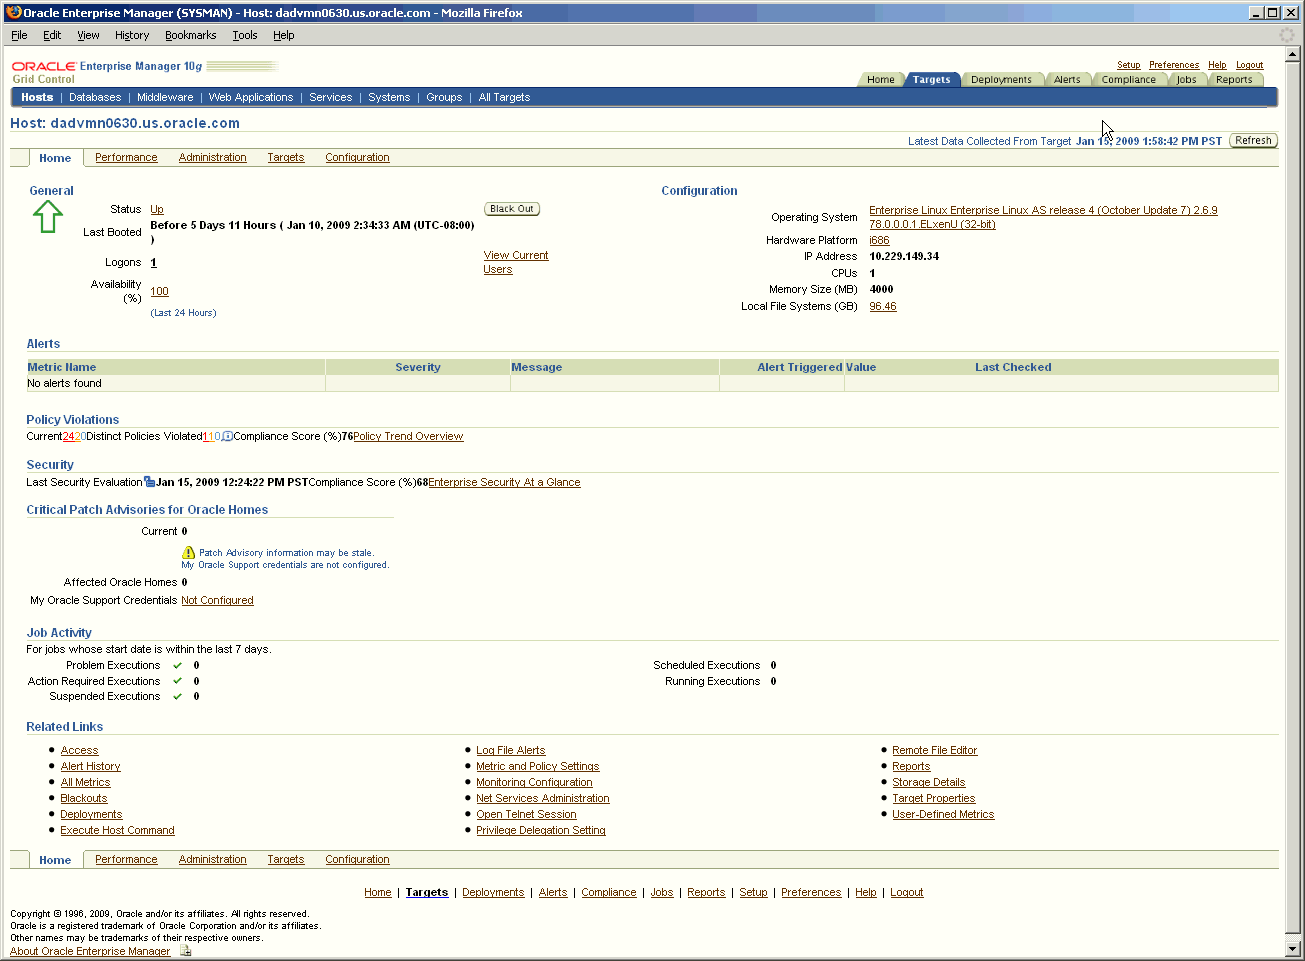
The Host Home page provides an overview of the status and vital statistics for each host that is part of the Grid Control environment.
Grid Control consolidates the relevant host information into a convenient single-screen Host Home page. You can see the availability, key configuration information, and outstanding alerts, as well as other pertinent information about the host. Convenient links allow you to view all the metrics collected for the host, change the thresholds as appropriate, or directly log in to the host to perform administrative actions.
Using the Host Home page, you can do the following:
-
Drill down to view detailed metrics
-
View operating system, hardware, and other configuration information for the host
-
View policy violations and alerts for the host
-
Analyze the job activity
-
Determine whether there are outstanding patch advisories
-
Determine the last security evaluation of the host
-
Navigate to other pages to help you investigate the health of the host
Host Performance Page
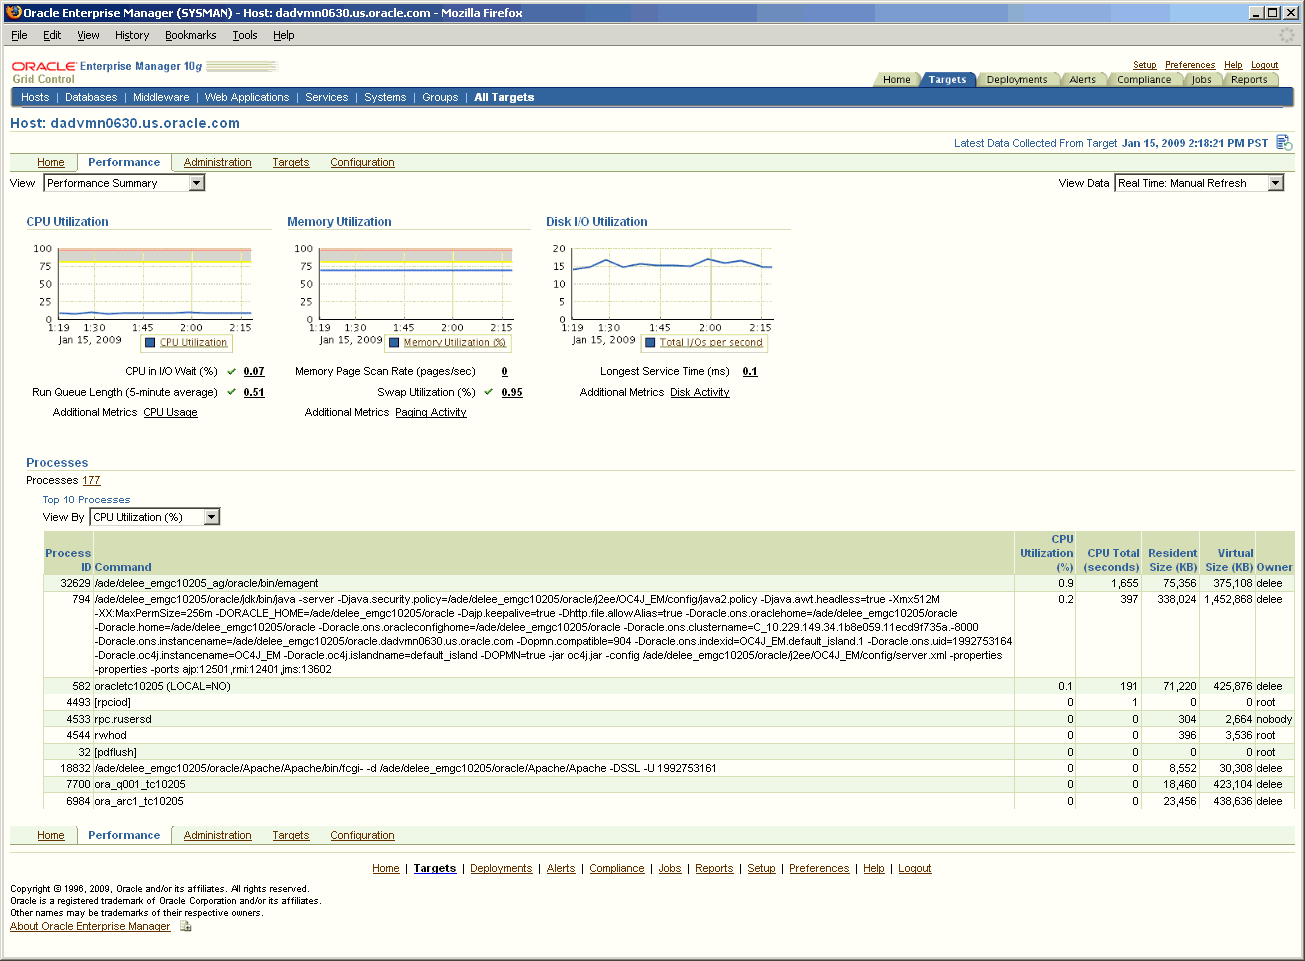
The Host Performance page provides an overview of the utilization statistics (CPU, Memory, Disk I/O, and Program Resource Utilization) for an individual host. Choose one of these options from the View menu. With this information, system administrators can determine whether resources need to be added or redistributed. You can also view the top processes consuming the most CPU or Memory and take appropriate action.
The performance metrics that are collected out-of-box for the host span several different categories: CPU Usage (including idle, wait, and user times), Disk Activity (including Average Disk I/O rate), and Network Interface Activity, among others. You can also view real-time metrics such as buffer activity.
Using the Performance page, you can:
-
View various utilization charts by selecting an option in the View menu. Related metrics are also displayed under the charts. Click a metric link to view the metric in more detail.
-
View the processes that are using the most CPU or memory resources.
-
View performance data in real-time, or historical data over defined periods.
Host Configuration Page
The Host Configuration page lists not only operating system and hardware configuration information, but all Oracle software and operating-system registered software on the host as well. You can also compare configurations for single or multiple hosts.
See Also:
"Hardware and Software Configurations" in Chapter 4, "Enterprise Configuration Management"Operating System Details
Enterprise Manager surfaces key operating system-level information for hosts. You can obtain general information about the operating system, such as the distributor and the version. You can also drill-down for specific information such as system properties, file systems, and operating system-level packages. This information helps when troubleshooting performance problems that arise because of configuration issues.
Note:
To access the Operating System Details page:-
From the Hosts subtab, select a host target.
-
From the Host Home page, click the Operating System Details link under Configuration.
Figure 5-3 Host Operating System Details Page
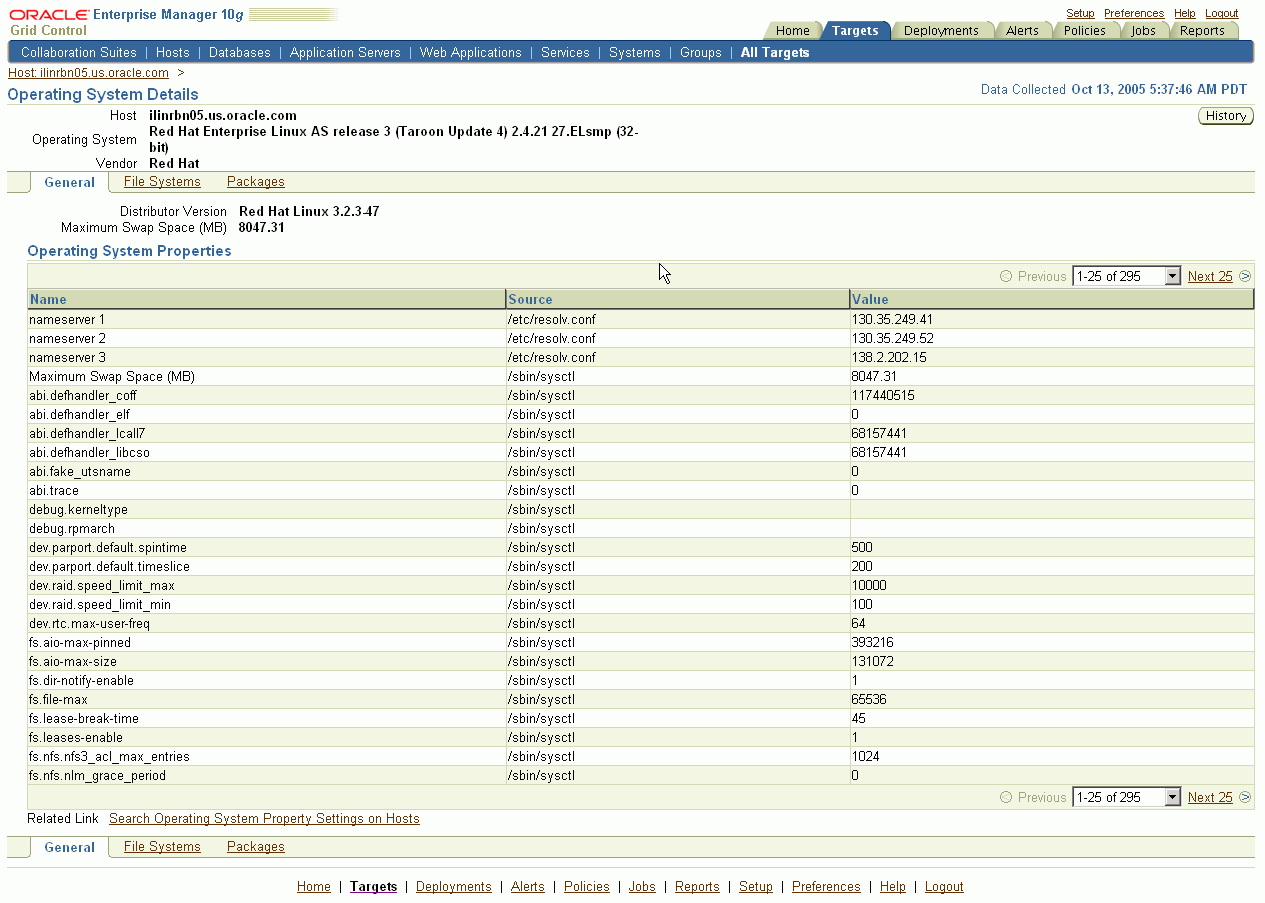
Description of "Figure 5-3 Host Operating System Details Page"
The File Systems page includes information about the various mount points for the host, type of mount point, time of the mount, and the directory where the file system is mounted.
The Packages page lists all of the operating system packages installed on the host.
Hardware Details
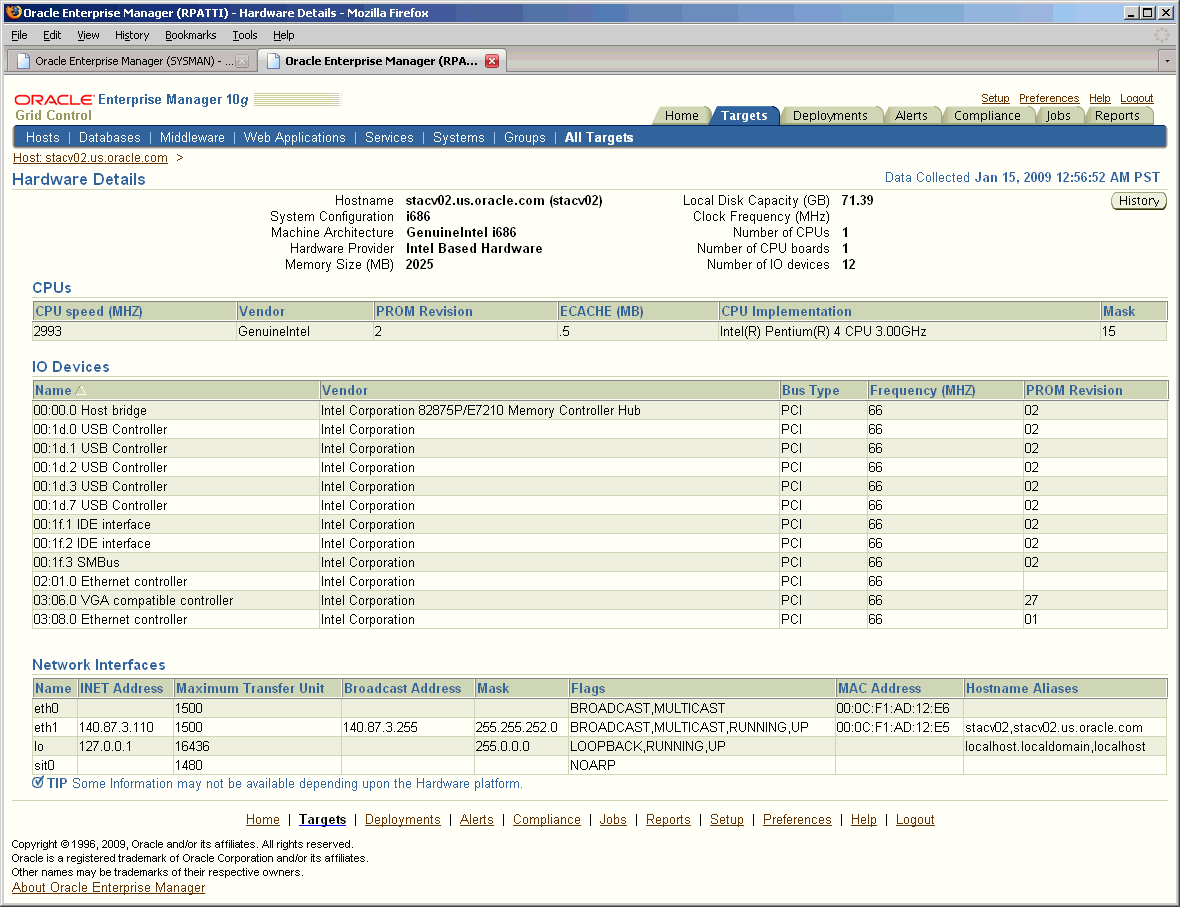
The Hardware Details page allows you to view the CPU, I/O, and Network Interfaces associated with the host. It also helps the user keep track of the hardware changes that occur over time. The type of operation (INSERT, UPDATE, or DELETE) and the category of the hardware that is updated are reflected on this page.
Note:
To access the Hardware Details page:-
From the Hosts subtab, select a host target.
-
From the Host Home page, click the Hardware Details link under Configuration.
Log File Monitoring
Grid Control monitors the log files for the occurrence of operator-specified patterns. Use this facility to monitor abnormal conditions recorded in the log files present on the host.
Log files are periodically scanned for the occurrence of desired patterns and an alert is raised when the pattern occurs during a given scan. During a scan, new content created since the last scan is searched for the occurrence of the desired patterns. Use this page to view, clear, and purge open alerts generated during log file monitoring.
Note:
To access the Log File Alerts page:-
From the Hosts subtab, select a host target.
-
From the Host Home page, click the Log File Alerts link under Related Links.
See Also:
"Configuring Generic Log File Monitoring Criteria" in Grid Control online helpProgram Resource Utilization Monitoring
Enterprise Manager allows you to track resource use for programs and users. For example, you can track CPU usage by user, by program, or a combination of the two.
The Program Resource Utilization page provides a quick glimpse of the programs being monitored on this host. With this information, you can see trends in resource usage for:
-
A specific program or set of programs
-
A specific user or set of users
-
A combination of programs and users
Note:
To access the Program Resource Utilization page:-
From the Hosts subtab, select a host target.
-
From the Host Home page, go to the Performance page.
-
From the Host Performance page, select Program Resource Utilization from the View menu.
You can also access the page from the All Metrics page for that host.
See Also:
"Configuring Program Resource Utilization Monitoring Criteria" in Grid Control online helpFile and Directory Monitoring
Enterprise Manager monitors the files and directories for the operator-specified criteria on hosts running various versions of the UNIX operating system. The operator should configure the criteria for monitoring the desired files and directories.
Note:
To access the File Directory Monitoring page:-
From the Hosts subtab, select a host target.
-
From the Host Home page, click the All Metrics link under Related Links.
-
From the All Metrics page, select File and Directory Monitoring from the list of metrics.
See Also:
"Configuring File and Directory Monitoring Criteria" in Grid Control online helpHardware Monitoring for Dell PowerEdge Systems
Hardware-specific monitoring is available out-of-box for Dell PowerEdge Linux hosts with Enterprise Manager. The following hardware health statistics can be monitored as part of the Dell PowerEdge Linux host target:
-
Processor Status
-
Memory Status
-
PCI Device Status
-
Power Supply Status
-
System BIOS Status
-
Fan Status
-
Remote Access Card Status
-
Temperature Probe Status
Note:
To access the Hardware Monitoring page for Dell PowerEdge Systems:-
From the Hosts subtab, select a host target.
-
From the Host Home page, click the All Metrics link under Related Links.
-
From the All Metrics page, select the metric you want to monitor from the list of metrics.
See Also:
"Enabling Hardware Monitoring for Dell PowerEdge Linux Hosts" in Grid Control online helpStorage Resource Tracking
Tracking the storage resource allocation and usage is essential to large IT departments. Unallocated and underutilized storage can be put to better use. Historical trends at a business entity-level enable you to plan for future growth.
Storage Details are relevant to Enterprise Manager targets that are associated with one or more hosts. In particular:
-
Summary attributes presented are rolled up for one or multiple associated hosts.
-
Storage Details helps in tracking storage resource allocation and usage for one host or a group of hosts, and tracks historical usage trends.
-
A host is associated with a group either through explicit membership, or implicit membership inherited through a group member target.
Note:
To access the Storage Details page:-
From the Hosts subtab, select a host target.
-
From the Host Home page, click the Storage Details link under Related Links.
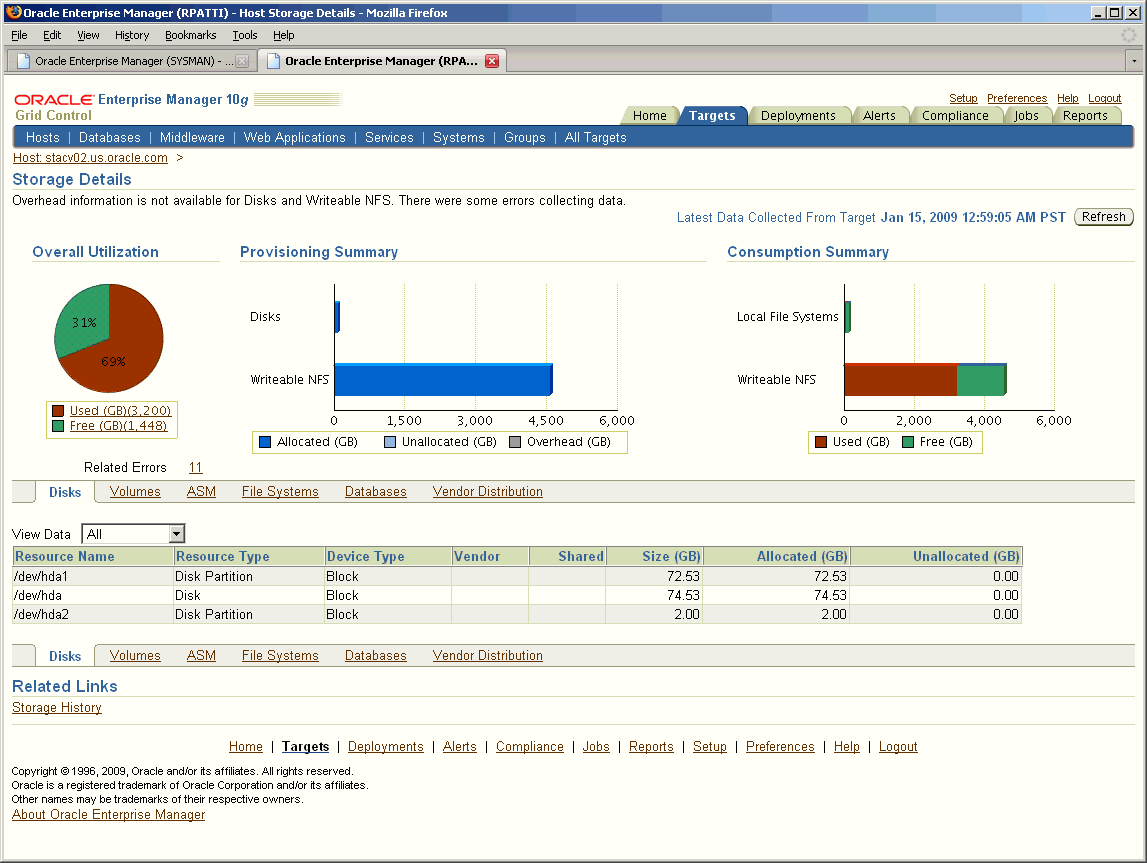
The Storage Details page displays the following charts:
-
Overall Utilization: Shows summary attributes that provide a system-level view of storage resource utilization.
-
Provisioning Summary: Shows allocation-related summary attributes for File Systems, ASM, Volumes, and Disks for the associated hosts.
-
Consumption Summary: Shows usage-related summary attributes for Databases and File Systems.
The Disks option on the Storage Details page shows the allocated and unallocated storage for all the disks and disk partitions on a host. All disks are listed, including virtual disks from external storage systems such as EMC Storage Array.
Host Administration
In addition to the general Grid Control features and tools described in the "Overview of Enterprise Manager Grid Control" chapter, you can administer your hosts using the Host Administration tab and Grid Control's tools designed for host management.
Linux Host Administration
Linux host administration features for RedHat (RHEL4) and SuSE Linux (sles9) provide you the ability to administer the most important host functions easily and quickly. Operators with the appropriate privileges can set up and administer the following OS features:
-
System Services
-
Start and stop individual services — Facilitates upgrading and troubleshooting applications and databases
-
Configure services to run at boot time — Ensures that all your applications and dependent services are available after every reboot
-
Assign system services to run levels — Assures appropriate behaviors to assist in maintenance and trouble-shooting
-
-
Network Setup
-
NFS Client Configuration — Allows you to configure access to storage resources
-
Network Card Configuration — Enables you to rapidly establish connectivity to the network to get your application service running quickly
-
View and edit host name lookup tables (/etc/hosts) — Allows you to set-up and edit host names to identify new services to the network
-
Note:
To access the Host Administration page:-
From the Hosts subtab, select a Linux host target.
-
From the Host Home page, click Administration.
Execute Host Command
With the appropriate privileges, you can execute non-interactive host commands remotely over the network, as well as view and edit text files. The Execute Host Command page enables you to type operating system commands against one or more hosts, or all the hosts in a group, enabling you to perform multiple administrative operations at the same time.
Note:
To access the Execute Host Command page:-
From the Hosts subtab, select a host target.
-
From the Host Home page, click the Execute Host Command link under Related Links.
Job System
You can leverage the Job System to run operating system commands for your host. From the Execute Host Command page, use the "Load from Job Library" option to search the Job Library for existing jobs that you can reuse.
From the Load from Job Library page, click the icon in the Load column of any row to return to the Execute Host Command page, loading the complete context of the library job in that row. The complete context includes the host command, OS script, targets, and credentials.
Note:
To access the Load from Job Library page:-
From the Execute Host Command page, click the Switch to Multiple Target Mode link.
-
Click the Load from Job Library button.
Remote File Editor
The Remote File Editor page enables you to view, edit, copy, and save text files present on the remote host target. For example, using this utility, you can update the contents of configuration files on the remote host.
Note:
To access the Remote File Editor page:-
From the Hosts subtab, select a host target.
-
From the Host Home page, click the Remote File Editor link under Related Links.
Third-Party Target Management
Grid Control enables you to manage hardware and software from certain third-party vendors out-of-box. Most tools, functions, and features available for monitoring and administering Oracle targets can be used to manage other targets in your data center.
Note:
Use Grid Control to manage your complete data center by developing Management Plug-ins for your managed targets. Refer to Enterprise Manager Extensibility for more information.Support for Third-Party Application Servers
With tools and features similar to managing Oracle Application Server targets, Grid Control allows you to monitor the following third-party application server targets, as well as the applications deployed on the servers:
-
Microsoft Exchange Organizations, Routing Groups, and Servers
Oracle WebLogic Domains, IBM WebSphere Cells, and Microsoft Exchange Organizations represent logically-related groups of application server resources. Grid Control monitors them as composite targets, containing rolled-up information on the member targets that make up the group.
All the resources in a Oracle WebLogic Domain are centrally managed by the WebLogic Administration Server, and the resources in an IBM WebSphere Cell are managed by the Deployment Manager. The JMX fetchlets specific to each product environment communicate with the Oracle WebLogic Administration Server or IBM WebSphere Deployment Manager to collect the metric information for the individual application servers that make up the Domain or Cell, respectively. There is no need to deploy Oracle Management Agents to each application server node; as long as a Management Agent is locally or remotely deployed to the host on which the Administration Server or Deployment Manager resides, Grid Control can manage those targets.
The member targets that make up a Oracle WebLogic Domain are clusters and managed servers, and the member targets that make up an IBM WebSphere Cell are clusters and application servers. As for Microsoft Exchange Organization, the member targets are individual Microsoft Exchange Servers.
Oracle WebLogic Cluster, IBM WebSphere Cluster, JBoss Partition, and Microsoft Exchange Routing Group provide a high-availability application server environment. Grid Control monitors them as composite targets, containing rolled-up information on the member targets that make up the group. The member targets for each of these targets are the application servers grouped under them.
Oracle WebLogic Managed Servers, IBM WebSphere Application Servers, JBoss Application Servers, and Microsoft Exchange Servers are used to deploy applications and other resources. They are all monitored as individual targets, much like Oracle Application Servers.
Grid Control also provides configuration management features for these third-party application servers. Using these features, you can view the configurations that were last collected, save configurations so that they can be referenced in the future for possible analysis or comparison, and compare configurations to examine specific configuration variations between two instances. You can also perform some out-of-box searches, for example, you can search one or more J2EE applications deployed in your third-party application server instances.
However, note that all these third-party application servers have to be manually added to Grid Control for monitoring purpose. Unlike Oracle Application Servers, these third-party application servers are not automatically discovered by Grid Control. You can use the Application Servers tab of the Grid Control console to add these targets.
Some of the features available for these third-party application server targets are:
-
Robust monitoring: Automatic performance and availability monitoring with Oracle recommended settings, out-of-box notifications for critical alerts, J2EE application monitoring for clusters, J2EE services monitoring for JBoss application servers, historical collections, blackouts, monitoring of application-defined MBeans, and more.
-
Service management: Transaction performance monitoring, end-user performance monitoring, system monitoring, dashboards, Root Cause Analysis, and more.
-
Group management: Group-level roll-ups for monitoring and task automation, monitoring templates.
-
Reporting: Out-of-box and user-defined reports for JBoss Application Server.
-
Policy violations: Out-of-box and user-defined policies for Oracle WebLogic Managed Server.
-
Administration: Process control for starting, stopping, and restarting Oracle WebLogic Managed Server and IBM WebSphere Application Server. Also, control for starting and stopping Channels of IBM WebSphere MQ targets.
-
Configuration Management: Viewing, comparing, and searching configuration information related to these application servers.
See Also:
"Managing Oracle WebLogic Servers", "Managing IBM WebSphere Application Server", "Managing JBoss Application Server", and "Managing Microsoft Exchange Server" in Grid Control online help.Support for Third-Party Plug-Ins
Much like the support offered for third-party application servers, Grid Control also supports third-party plug-ins like IBM WebSphere MQ Queue Manager and IBM WebSphere MQ Cluster.
IBM WebSphere MQ Cluster is a composite target that groups the IBM WebSphere MQ Queue Managers, and provides a high-availability environment. Grid Control monitors them as logical targets and provides rolled-up information about the queue managers that make up the cluster.
IBM WebSphere MQ Queue Manager is monitored like any other application server target. You can monitor their status, be notified for critical alerts, access out-of-box reports and policies, and view a list of metrics and gauge their performance.
The other logical objects of IBM WebSphere MQ Queue Manager for which Grid Control collects metrics are Queues and Channels. For each of these logical targets, Grid Control provides a home page to help you monitor their status and performance.
See Also:
"Managing IBM WebSphere MQ Queue Manager" and "Managing IBM WebSphere MQ Cluster" helpsets in Grid Control online helpNetwork Appliance Filer
When you use Oracle Enterprise Manager to manage your Oracle environment, you can monitor not only your databases and application servers, but also supporting hardware, such as IP traffic controllers and storage devices.
Network Appliance Filers configured to use the ONTAP operating software (release 6.0 or later) are one type of storage device that can be managed out of the box. Network storage devices can be an important part of your Oracle environment. Use them to store and access large amounts of database and application data.
Similar to other managed targets, Grid Control's full suite of monitoring features are available for Network Appliance Filers. Key aspects of Network Appliance Filer monitoring are displayed as part of the Network Appliance-specific target pages, and include the following:
-
Availability
-
Filer Target
-
Cluster Filer's Partner Status
-
-
Storage Space Allocation and Usage Monitoring
-
Traditional and Flexible Volumes
-
Aggregates, Qtrees, and Snapshots
-
System Level Storage Capacity Summaries
-
-
Performance Monitoring
-
CPU Utilization and NFS Statistics
-
NFS/CIFS Calls
-
Disk, Network, and Network Interface I/O
-
-
Health Monitoring
-
Power Supplies, Fans, and NVRAM Batteries
-
Temperature and NFS/CIFS Bad Calls
-
Cluster Partner/Interconnect Status
-
Network Interface Status/Errors/Discards
-
Disk Failures and Spare Disks
-
See Also:
"Overview of Adding a Network Appliance Filer" in Grid Control online helpF5 Load Balancer Switches
In addition to monitoring the performance of your database, the effectiveness of your mid-tier applications, and the response time of your Web pages, Grid Control helps you monitor load balancer switches. Load balancer switches are an important part of any complex Web application environment, because they distribute user requests to the Web servers.
F5 BIG-IP Load Balancers from F5 Networks running OS version 4.2 PTF-06, or later, can be managed out of the box from Grid Control. The user interface allows you to navigate through the relationships that exist among the entities present in the switch.
As with other managed targets, Grid Control's full suite of monitoring features are available for F5 Load Balancer Switches. Key aspects of F5 Load Balancer Switch monitoring are displayed on the Load Balancer Switch-specific target pages, and include the following:
-
Availability
-
Load Balancer Switch Target
-
Virtual and Real Server Status
-
-
Performance Monitoring
-
Switch Level — CPU and Memory Utilization
-
Switch, Virtual Server, Server Group and Real Server Level — Bits In and Bits Out Rates, Connections Per Second
-
Physical Interface Level — Bits In and Bits Out Rates
-
See Also:
"Overview of Adding a Load Balancer Switch" in Grid Control online help