5 Group Management
This chapter introduces the concept of group management and contains the following sections:
Introduction to Groups
Today's IT operations can be responsible for managing a great number of components, such as databases, application servers, hosts, or other components, which can be time consuming and impossible to manage individually. The Enterprise Manager Grid Control group management system lets you combine components (called targets in Enterprise Manager) into logical sets, called groups. This enables you to organize, manage, and effectively monitor the potentially large number of targets in your enterprise.
Enterprise Manager Groups can include:
-
Targets of the same type, such as:
-
All hosts in your data center
-
All of your production databases
-
-
Targets of different types, such as:
-
The database, application server, listener, and host that are used in your application environment
-
Targets operating within a particular data center region
-
Note:
An Enterprise Manager "System," used specifically to group the components on which a service runs, is a special kind of Enterprise Manager group. Many of the functions and capabilities for groups and systems are similar.Typically you can gather together targets that you want to manage as a group. If you use the target properties (for example, Line of Business or Deployment Type) to put operational information about your targets in Enterprise Manager, you can use these properties when creating groups to locate targets. For example, you could search for all databases of Deployment Type = Production and belonging to Line of Business 'HCM'. You can also create a group hierarchy and use nested groups.
Managing Groups
By combining targets in a group, Enterprise Manager offers a wealth of management features that enable you to efficiently manage these targets as one group. Using the Group pages, you can:
-
View a summary status of the targets within the group.
-
Monitor outstanding alerts and policy violations for the group collectively, rather than individually.
-
Monitor the overall performance of the group through performance charts.
-
Perform administrative tasks, such as scheduling jobs for the entire group, or blacking out the group for maintenance periods.
You can also customize the console to provide direct access to group management pages.
Group Home Page
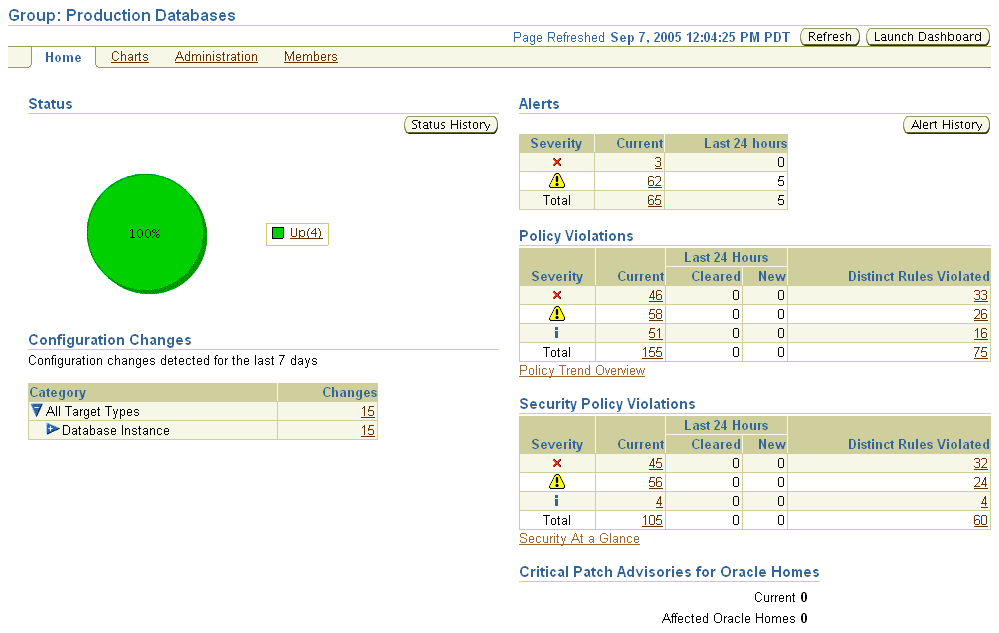
The Group Home page, shown in Figure 5–1, is the central location for monitoring information. The Group Home page provides the following features:
-
Availability pie chart that provides at-a-glance information on the current status across all members so you can easily assess the percentage of members that are up, and the percentage of members that are unavailable. You can quickly drill down for information if any member target is down.
-
Roll-up of open alerts and policy violations, categorized by severity, so you can quickly focus on the most critical problems first. Alerts and violations that have occurred within the last 24 hours highlight problems that recently occurred.
-
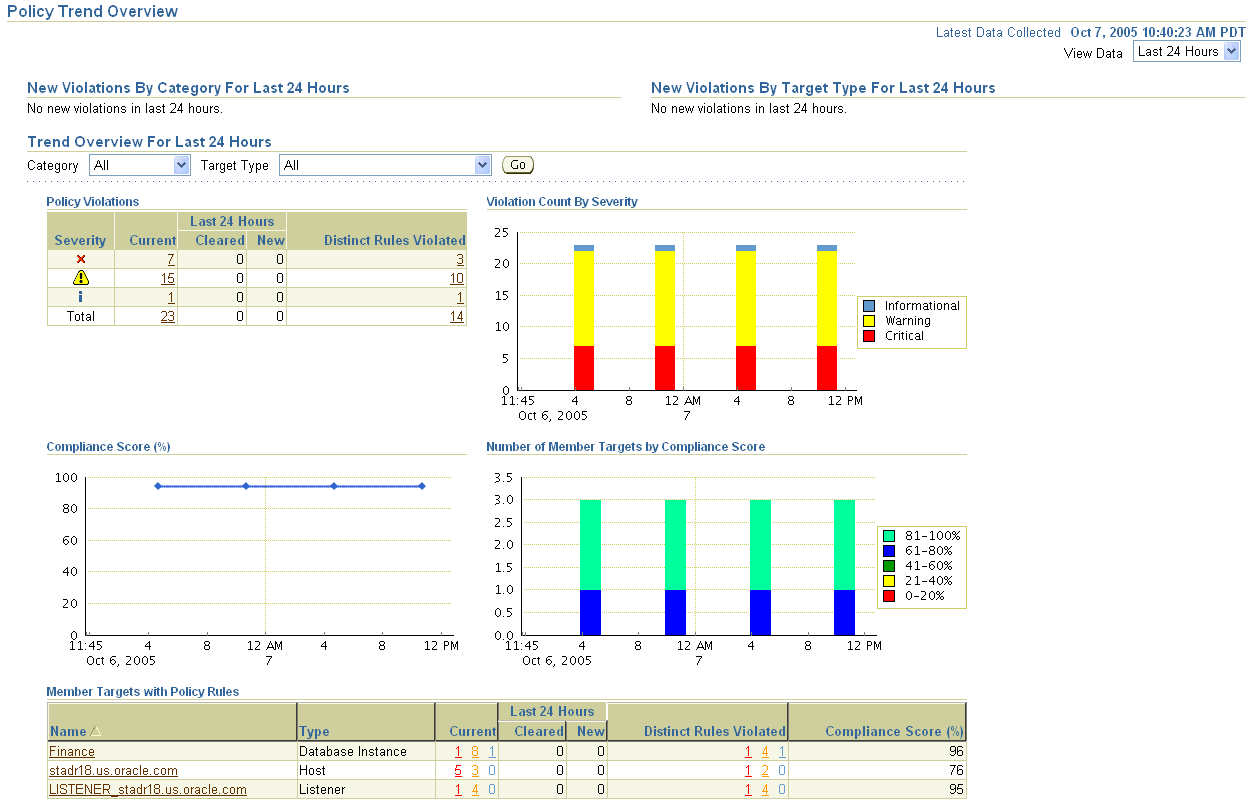
Access to the Policy Trend Overview page, which provides a comprehensive view of the group for compliance with policy rules over a period of time. Using policy charts, you can assess trends such as increased or decreased number of policy violations, changes in the overall group compliance score, and the percentage of members in compliance with your enterprise's policy rules.
-
Access to the Security at a Glance page, which provides an overview of the security health of the group. This shows statistics about security policy violations and critical security patches that have not been applied.
-
Summary of recent configuration changes across all members in the group, so you can easily determine if a new problem is related to any recent changes.
-
Summary of Critical Patch Advisories for Oracle homes within the group.
Figure 5–2 shows the Policy Trend Overview page that you can access from the Group Home page.
See Also:
"Group Home Page" in the Enterprise Manager online helpGroup Charts Page
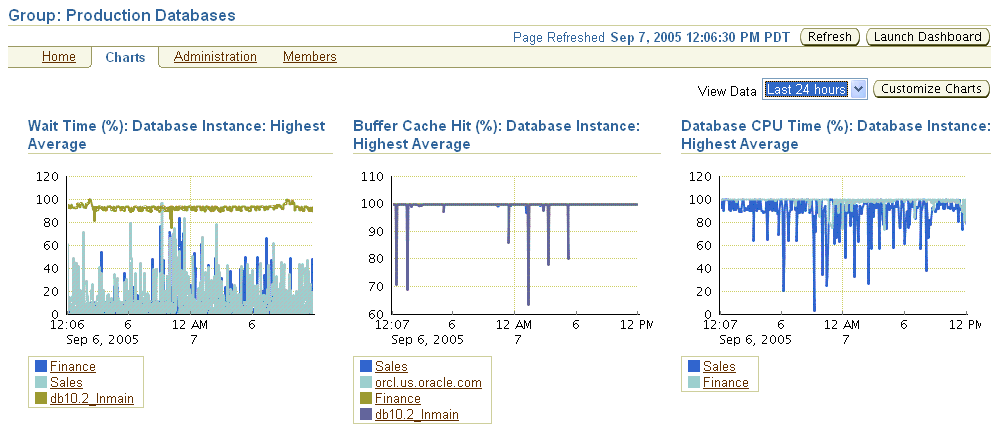
The Group Charts page, shown in Figure 5–3, enables you to monitor the collective performance of the group. Out-of-box performance charts are provided based on the type of members in the group. For example, when databases are part of the group, a Wait Time (%) chart is provided that shows the top databases with the highest wait time percentage values. You can view this performance information over the last 24 hours, last 7 days, or last 31 days. You can also add your own custom charts to the page.
See Also:
"Group Charts Page" in the Enterprise Manager online helpGroup Administration Page
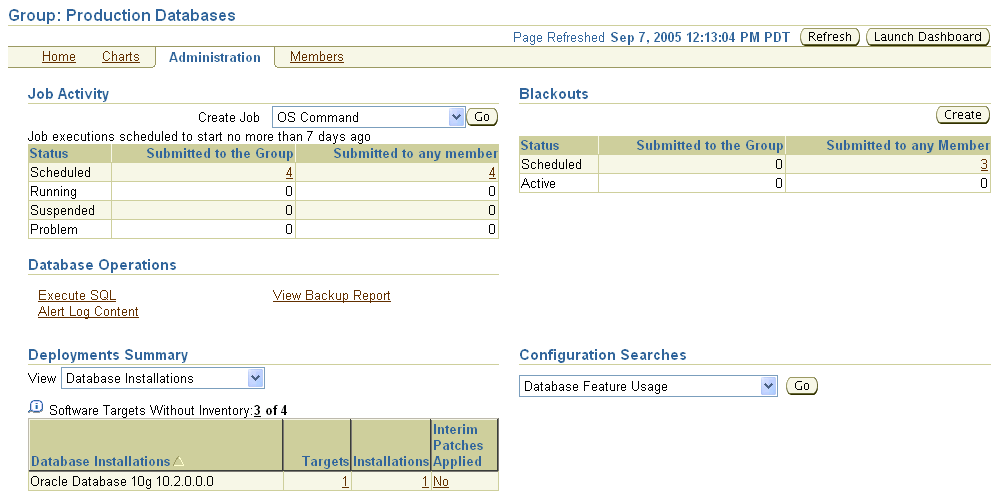
The Group Administration page, shown in Figure 5–4, provides a central point for performing common administrative tasks for the group. For example, you can:
-
Run jobs or find out the status of currently running jobs against the group.
-
Define planned outage windows, called blackouts, on the members of the group to perform maintenance tasks.
-
Run SQL commands collectively against the database member targets of the group.
-
View the most recent backup for each database in the group.
-
View the last 100,000 bytes of the alert log for all databases in the group.
-
Use a deployment summary to easily obtain hardware and software inventory information across all member targets.
See Also:
"Group Administration Page" in the Enterprise Manager online helpGroup Members Page
The Group Members page, shown in Figure 5–5, summarizes information about the member targets in the group. It includes information on their current availability status, roll-up of open alerts and policy violations, and key performance metrics based on the type of targets in the group.
You can visually assess availability and relative performance across all member targets. You can sort on any of the columns to rank members by a certain criterion (for example, database targets in order of decreasing wait time percentage). Default key performance metrics are displayed based on the targets you select, but you can customize these to include additional metrics that are important for managing your group.
See Also:
"Group Members Page" in the Enterprise Manager online helpSystem Dashboard
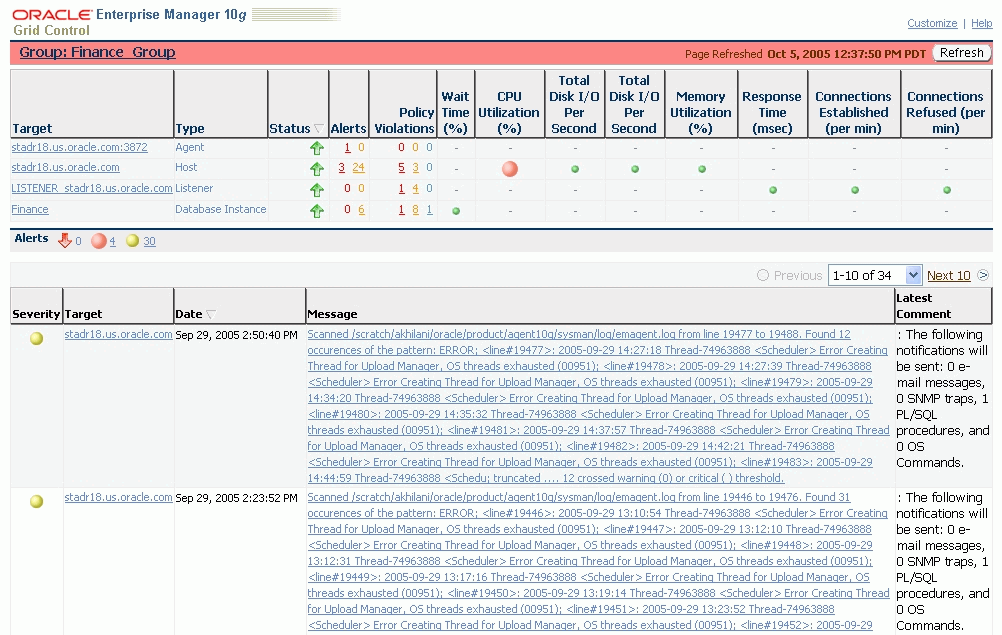
The System Dashboard, shown in Figure 5–6, enables you to proactively monitor the status and alerts in the group as they occur. The color-coded interface is designed to highlight problem areas using the universal colors of alarm—targets that are down are highlighted in red, metrics in critical severity are shown as red dots, metrics in warning severity are shown as yellow dots, and metrics operating within normal boundary conditions are shown as green dots.
Using these colors, you can easily spot the problem areas for any target and drill down for details as needed. An alert table is also included to provide a summary for all open alerts in the group. The alerts in the table are presented in reverse chronological order to show the most recent alerts first, but you can also click on any column in the table to change the sort order.You can customize the dashboard according to your needs. You can specify which key metrics should be included in the dashboard and the display names to be used for these metrics. You can also customize the refresh interval to ensure that you always receive timely information about alerts as they are detected.You can launch the System Dashboard in context from any Group Home page. However, using reporting framework features, you can also make the System Dashboard publicly available for any user that has access to a web browser and the Enterprise Manager Reports Web site.
Out-of-Box Reports
Enterprise Manager provides several out-of-box reports for groups as part of the reporting framework, called Information Publisher. These reports display important administrative information, such as hardware and operating system summaries across all hosts within a group, and monitoring information, such as outstanding alerts and policy violations for a group.
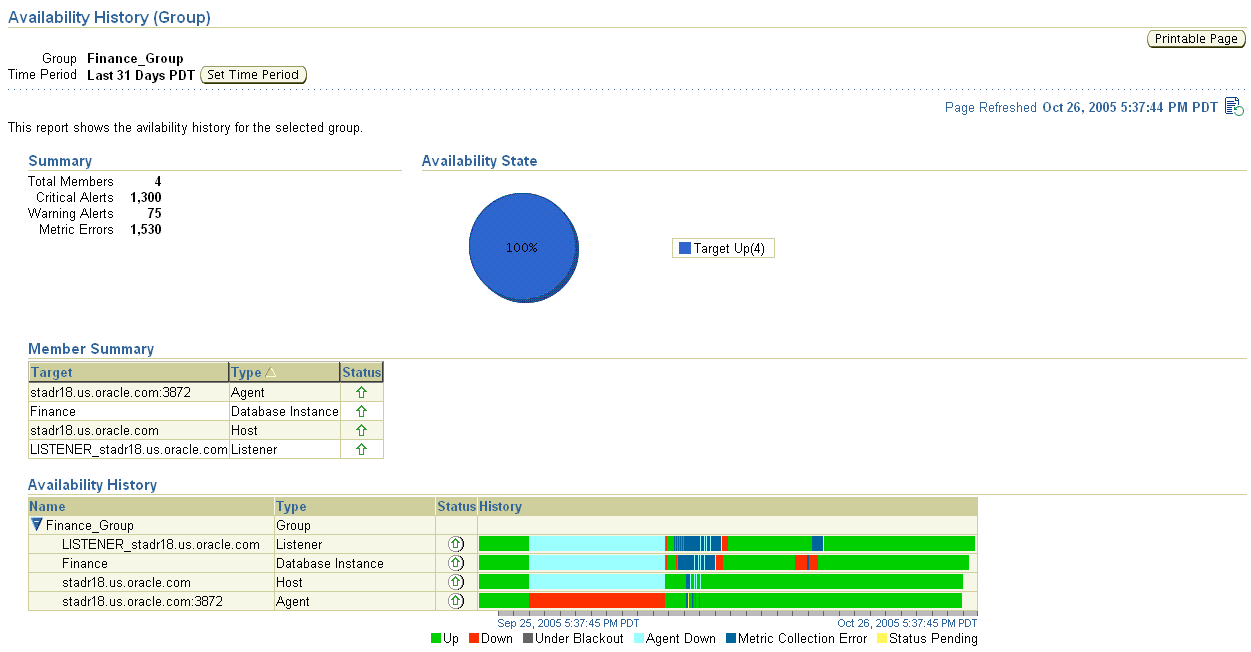
You can access these reports from the Reports link in the Related Links section of all Group pages. Figure 5–7 shows the Availability History report for a specified group over the last 31 days.
See Also:
Chapter 8, "Information Publisher"Redundancy Groups
A redundancy group is a group that contains members of the same type that function collectively as a unit. A type of redundancy group functions like a single logical target that supports a status (availability) metric. A redundancy group is considered up (available) if at least one of the member targets is up.
You can create and administer a redundancy group from the All Targets page. Redundancy groups support all group management features previously discussed.
When you define the Redundancy Group, you must choose the member type for the members in the Redundancy Group.
You can define the options for how availability of the redundancy group is calculated by selecting either Number or Percentage:
-
Number - When you choose Number, you can specify either the number of member targets that should be up in order for the group to be considered up, or the number of member targets that should be down in order for the group to be considered down.
-
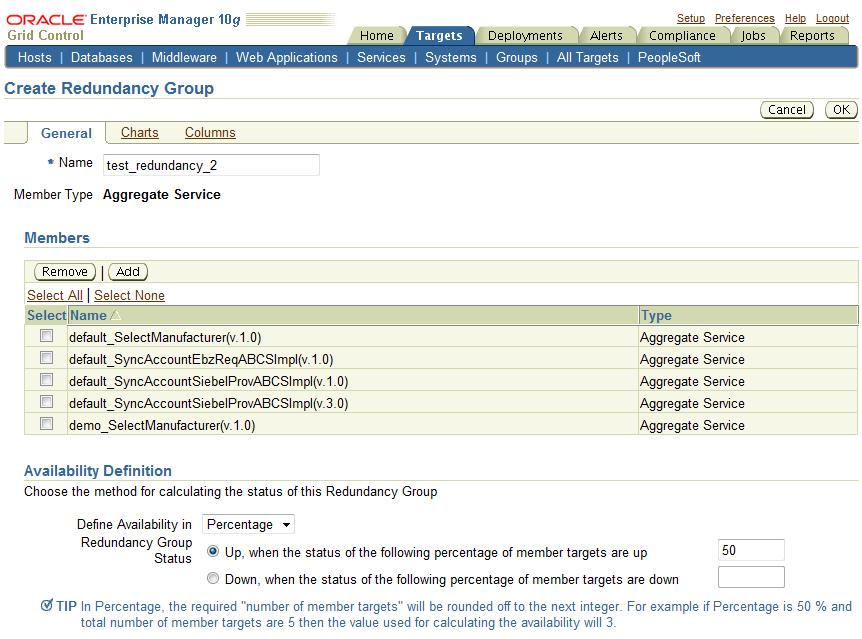
Percentage - When you choose Percentage, you can specify either the minimum percentage of member targets that must be up in order for the group to be considered up, or the minimum percentage of member targets that are down in order to consider the group to be down. If you choose Percentage, the required number of member targets will be rounded off to the next integer. For example if you define the Percentage as 50% and the total number of member targets is 5, then the value used for calculating the availability will be 3.
Figure 5-8 shows the Create Redundancy Group page while defining the group using Percentage availability.
Do not use redundancy groups if the group you want to model is an Oracle Real Application Clusters database, host cluster, HTTP server high availability group, or OC4J high availability group. Instead, you can use the following specialized target types for this purpose:
-
Cluster
-
Cluster Database
-
HTTP HA Group
-
OC4J HA Group
Privilege Propagating Groups
Privilege propagating groups enable administrators to grant privileges to other administrators in a manner in which new administrators get the same privileges as its member targets. For example, granting operator privilege on a group to an Administrator grants him the operator privilege on its member targets and also to any members that will be added in the future. Privilege propagating groups can contain individual targets or other privilege propagating groups.
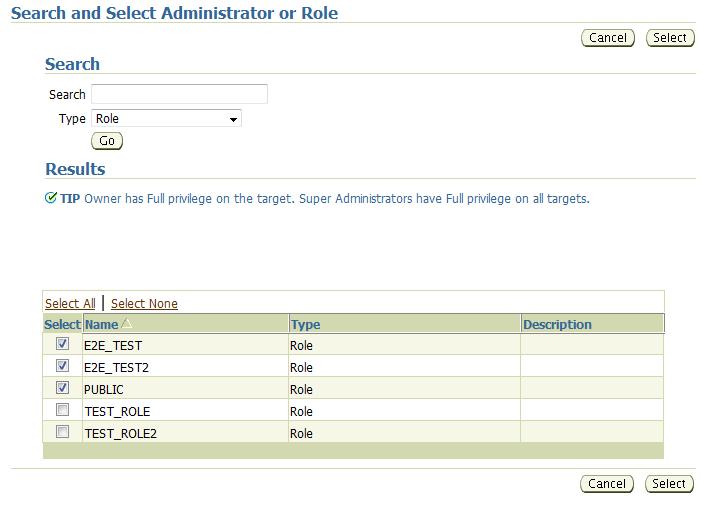
Privileges on the group can be granted to an Enterprise Manager user or a role. Use a role if the privileges you want to grant are to be granted to a group of EM users. See Figure 5-9, "Granting Privileges On a Group To a Role".
For example, suppose you create a large privilege propagating group and grant a privilege to a role which is then granted to administrators. If new targets are later added to the privilege propagating group, then the administrators receive the privileges on the target automatically. Additionally, when a new administrator is hired, you only need to grant the role to the administrator for the administrator to receive all the privileges on the targets automatically.
Creating Privilege Propagating Groups
The privilege propagating group creation function is a privileged activity. The privilege propagating group feature contains two new privileges:
-
Create Privilege Propagating Group
This privileged activity allows the administrators to create the privilege propagating groups. Administrators with this privilege can create propagating groups and delegate the group administration activity to other users.
-
Group Administration
This privilege can be granted to administrators on specific group targets and is used to delegate the group administration activities to other administrators. It is granted to both conventional and privilege propagating groups.
Using the Group Administration Privilege
The Group Administration Privilege is available for both Privilege Propagating Groups and conventional groups. If you are granted this privilege, you can grant access to the group to other Enterprise Manager users without having to be the SuperAdministrator to grant the privilege.
Adding Members to Privilege Propagating Groups
The target privileges granted on a propagating group are propagated to member targets. The administrator grants target objects scoped to another administrator, the grantee maintains the same privileges on member targets. The propagating groups maintain the following features:
-
The administrator with a Create Privilege Propagating Group privilege will be able to create a propagating group
-
To add a target as a member of a propagating group, the administrator must have Full target privileges on the target
You can add any non-aggregated target as the member of a privilege propagating group. For aggregated targets in Grid Control version 10.2.0.5, cluster and RAC databases and other propagating groups can be added as members (cluster and RAC databases must be added via the emcli verb). There is no support for this through the Enterprise Manager interface in version 10.2.0.5. Grid Control version 11.1, however, supports more aggregated target types, such as redundancy groups, systems and services. These, along with cluster and RAC databases, can be added in version 11.1 via the Grid Control Console.
If you are not the group creator, you must have at least the Full target privilege on the group to add a target to the group.
Converting Conventional Groups to Privilege Propagating Groups
In Enterprise Manager version 11.1, you can convert conventional groups to privilege propagating groups (and vice-versa) through the use of the specified EMCLI verb. Two new parameters have been added in the modify_group EMCLI verb:
-
privilege_propagation
This parameter is used to modify the privilege propagation behavior of the group. The possible value of this parameter is either true or false.
-
drop_existing_grants
This parameter indicates whether existing privilege grants on that group are to be revoked at the time of converting a group from privilege propagation to normal (or vice versa). The possible values of this parameter are yes or no. The default value of this parameter is yes.
These same enhancements have been implemented on the following EMCLI verbs: modify_system, modify_redundancy_group, and modify_aggregrate_service.
The EMCLI verb is listed below:
emcli modify_group
   -name="name"
   [-type=<group>]
   [-add_targets="name1:type1;name2:type2;..."]...
   [-delete_targets="name1:type1;name2:type2;..."]...
   [-privilege_propagation = true/false]
   [-drop_existing_grants = Yes/No]
For more information about this verb and other EMCLI verbs, see the EMCLI Reference Manual.
