11 Configuring Request Monitoring
The Request Monitoring feature provides end-to-end visibility into requests for Java applications deployed to WebLogic Server. It establishes a clear view of a request flowing through a multi-tier java environment. This chapter describes the procedure to setup and enable the Request Monitoring feature in Enterprise Manager Grid Control. This chapter covers the following:
Request Monitoring Architecture
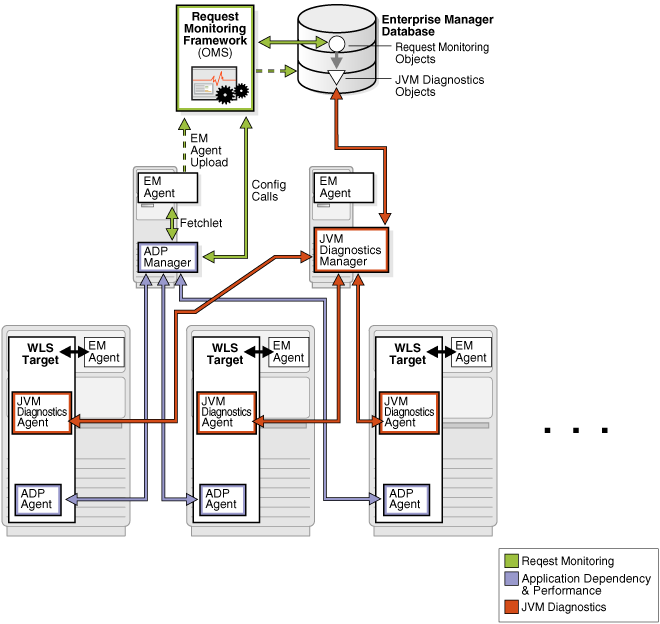
The following diagram shows the request monitoring architecture.
The JVM Diagnostics Agent and the ADP Agent are deployed on the WebLogic Server targets that are being monitored. These agents collect JVM Diagnostics and Application metrics and periodically report them to the JVM Diagnostics and ADP Managers. The Management Agent (EM Agent) on the ADP Manager machine, periodically runs a Fetchlet to retrieve the metrics from the ADP Manager and uploads them to the Management Repository. The Request Monitoring framework processes these metrics and uses them to monitor and analyze requests.
Prerequisites
Before you enable Request Monitoring, you must do the following:
-
Identify the WebLogic Server targets and J2EE applications that are to be monitored.
-
Ensure that the necessary hardware for the ADP Manager, ADP database, and JVM Diagnostics Manager is available.
Configuring Request Monitoring
To configure and enable request monitoring, follow these steps:
-
Deploy the Oracle Management Service and the Management Repository database. For details, see the Enterprise Manager Basic Installation and Configuration Guide.
-
Install the ADP Manager, and deploy the ADP Agent on the WebLogic Server targets. For details on installing the ADP Manager, see the Chapter 10, "Installing and Configuring Application Dependency and Performance". The ADP Manager must be installed as the same user as the Management Agent (as described in the step below).
-
Deploy the Management Agent on all the machines on which the ADP Managers have been installed.
-
Deploy the Management Agent on the machine on which the WebLogic server target to be monitored is running. In Enterprise Manager Grid Control, click Targets and Middleware. On the Middleware page, check if the WebLogic Server target to be monitored has been discovered and registered as a target. If it has not been registered, add the WebLogic Server as a target and register it. For details on discovering and registering the WebLogic Server target, see the Oracle Fusion Middleware Administration Guide. If this WebLogic server target is configured to connect to a database running on a remote machine, ensure that the Management Agent is deployed on the remote machine, and confirm that this database is listed as a target in Enterprise Manager Grid Control.
-
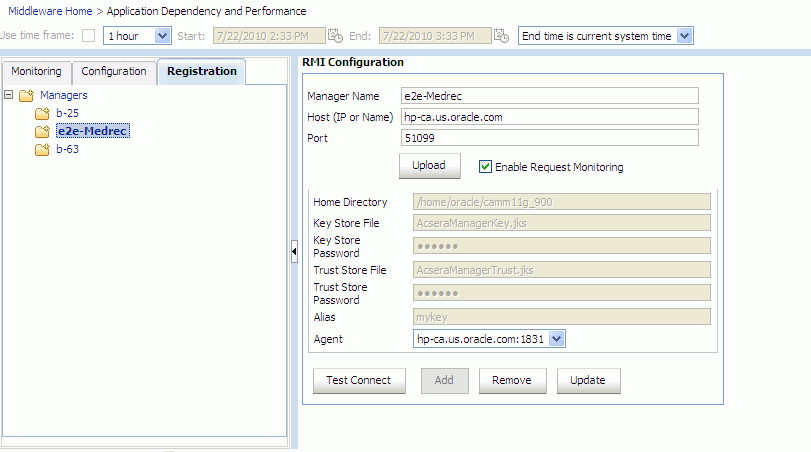
Register the ADP Manager. Navigate to the Middleware and click the Application Dependency and Performance link. In the Application Dependency and Performance page, click the Registration tab on the right panel. Figure 11-2, "RMI Configuration Page" is displayed.
Enter the name of the ADP Manager to be registered and the fully qualified host name of the machine that the ADP Manager is running on. The default port 51099 is pre-populated for you. To ensure that this ADP Manager can collect request monitoring data, you must check the Enable Request Monitoring checkbox. Click Test Connect to check if you can successfully connect to the ADP Manager. Select the Management Agent from the Agent drop-down list and click Add to complete the ADP Manager registration. For more details on registering the ADP Manager, see the Chapter 10, "Installing and Configuring Application Dependency and Performance".
-
Install the JVM Diagnostics Manager and deploy the JVM Diagnostics Agent on WebLogic Server targets. For more details, see the Chapter 9, "Configuring JVM Diagnostics".
-
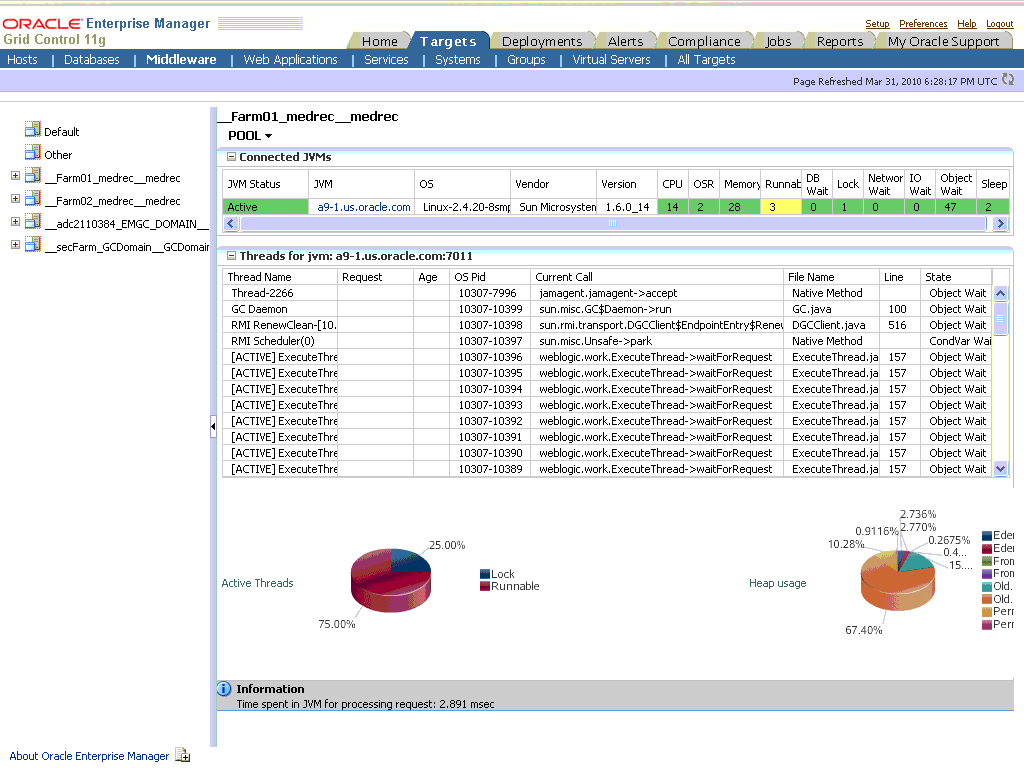
To validate that the JVM Diagnostics Manager is communicating with the JVM Diagnostics Agent, click the JVM Diagnostics link on the Middleware page. Click on a target in the left hand panel, for example
__Farm01_medrec__medrec. In the right hand panel, click Pool > Threads > Real-Time Analysis. The following screen is displayed:On this page, you can view the threads for each connected JVM.
-
Restart the ADP Manager and the WebLogic Server targets.
-
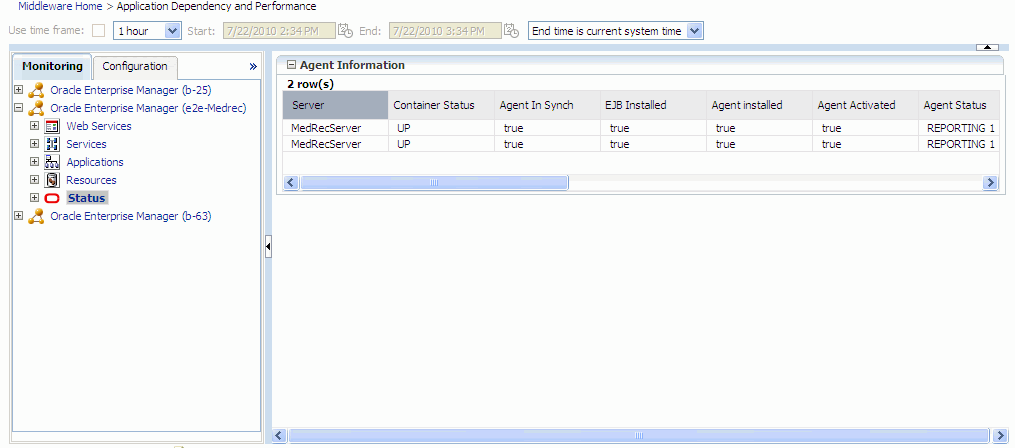
Click Application Dependency and Performance link on the Middleware page. Click the Monitoring tab on the right panel and select the Status option from the menu. The following screen is displayed.
You can validate that the ADP Agent has discovered the Java EE target by checking the Agent Status on this page.
-
Request Monitoring setup is now complete. To view and configure requests, grant the Request Monitoring Administrator privilege which provides full access to the Request Monitoring pages and allows the user to modify the request configuration settings. For richer Request Monitoring functionality, we recommend that you grant the following privileges:
-
View any Target privilege which allows user to drill down to the Target Home page and to view the target metrics in the Topology view.
-
JVM Diagnostics privilege which allows user to drill down to the JVM Diagnostics pages from the Topology page.
-
-
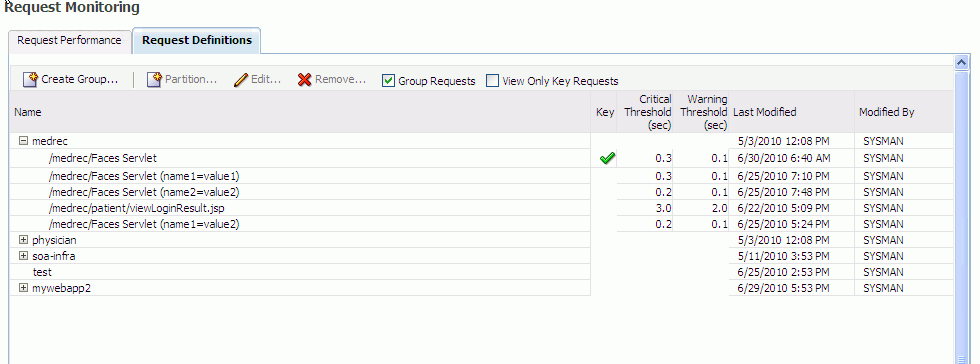
After the appropriate privileges have been granted, click the Request Monitoring link on the Middleware page and then click the Request Definitions tab. The following screen is displayed.
On this page, you can:
-
View and edit requests or request groups.
-
Create or edit request groups.
-
Partition an existing request by defining additional parameters for the request.
-
Set request response time violation thresholds (critical and warning)
