| Oracle® Retail Predictive Application Server User Guide for the Fusion Client Release 14.1 E59121-01 |
|

 Previous |
 Next |
| Oracle® Retail Predictive Application Server User Guide for the Fusion Client Release 14.1 E59121-01 |
|
Previous |
Next |
This chapter describes special RPAS Fusion Client features that you can use. The following sections are included:
Retailers routinely deal with very large volumes of data. To help you to manage the inevitable problems that occur, two forms of alerts are provided. These can help you to focus directly on the areas of the plan that need corrective action.
Batch Alerts
Batch alerts are run at a regular time interval by a scheduling tool (for example on a daily basis). They provide a method for a retailer to set up a systematic framework to identify data that falls outside of specific parameters.
Real Time Alerts
Real time alerts are calculated and updated when the workbook is opened. They can then be manually updated by users. Data outside of specified parameters is highlighted. After you have modified the data to a suitable value, click Calculate to clear the alert. This lets you systematically work through and clear a particular set of problems.
Configuring Batch and Real Time Alerts
The defaults for both batch and real time alerts are configured in the RPAS Configuration Module. This configuration can be done by users with access to the configuration tools and the alertmgr utility. They are not accessible by standard users. Standard users can only modify the visual appearance and priorities of real time alerts for workbooks or workbook templates to suit their personal preferences.
Batch alerts are based on business rules that notify users about retail events such as open to buy opportunities, stock outages, sales performance against plan, margin opportunities, and many others. The home page includes a Batch Manager Alert option, allowing users to create new workbooks to deal with the batch alerts.
With a combined taskflow, batch alerts can be displayed from multiple solutions. Only a global domain environment is required to show the tree-based master/locals breakdown. The results can be filtered by Solution or Solution and Domain.
A batch alert for a global domain environment has a master line that can be expanded to show lines for each accessible local domain. The master line shows the -sumAlerts count, and each local domain its respective -findAlerts count. For simple domains, or for a global domain in which the user only has access to a single local domain, a single line per batch alert appears with the -findAlerts count.
Batch alerts are set up by identifying a business measure as the foundation and then creating the alert by using a mathematical rule. A facility behind the scene finds the areas of a plan that fall outside the thresholds that is declared within the batch alert rules. This creates an alert that is flagged to the user through the Batch Alert Manager feature.
You can configure batch alerts to automatically run on a defined schedule using the alertmgr utility. Each time that Batch Alert Manager is run, it shows you all the alert conditions that were identified during the last execution. For more information about alertmgr, see the Oracle Retail Predictive Application Server Administration Guide for the Fusion Client.
In the RPAS Fusion Client, Batch Alert Manager provides two methods for viewing the measures associated with identified alerts, loading batch alerts in a new workbook and inserting batch alerts in an existing one. For more information, see "Building a Workbook Using Batch Alerts" and Inserting a Batch Alert in an Existing Workbook.
The following scenario describes how the batch alert manager displays records:
The batch alert manager table shows the master record at the top and local domain records as the children in a tree structure. However, if a user runs findAlert in the local domain, but forgets to run findAlert or sumAlert on the master domain, the Fusion Client only receives records for local domains and will not be able to build a master and child type structure since there is no master record. In this case, the UI shows local domain records that are not grouped under the master domain (no tree structure).
A user may have already run findAlert or sumAlert over the master domain, but there is still a chance that the total of the local domains is not the value shown for the master domain, because a later run may have been for just a single local domain.
Hit counts may include hits from positions the user does not have position level security access to; those hits are not visible in any workbook user builds.
The hit count on the master record may not add up to the sum of the local domain records if the user does not have access to one or more local domains.
You can also use the Batch Alert Manager window to keep track of alerts that have been resolved. See Resolving Batch Alerts for more information.
When you use the active batch alert, the positions of the dimensions that are contained in the base intersection of the alert measure can be filtered to display only the positions that have alerts.
You can right-click a dimension on which an alert is based and select the Show members with batch alert option to display only the positions for which an alert condition is triggered.
|
Note: The Fusion Client displays this option on all dimensions when the workbook has alert hits. When you select the Show members with batch alert option for a dimension that is not part of the alert measure, the view does not change. |
For example, if you have an batch alert that is based at SKU/store/week, you can right-click the Product, Location, or Calendar dimension when they are on the X, Y, or Z axis and select the Show members with batch alert option. This displays all positions that have alerts for that dimension. This option is also available on the Page Edge tool.
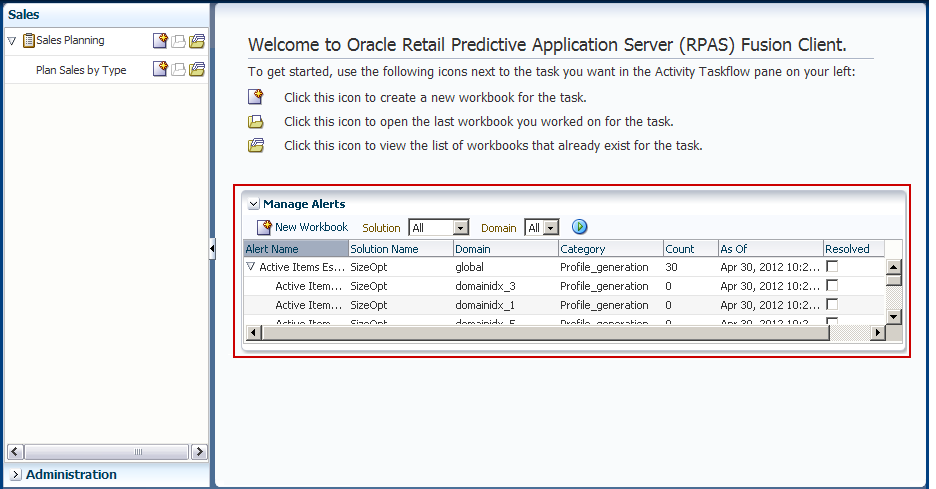
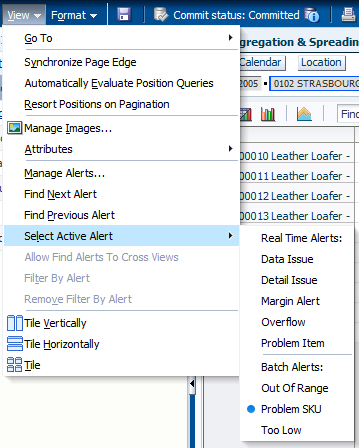
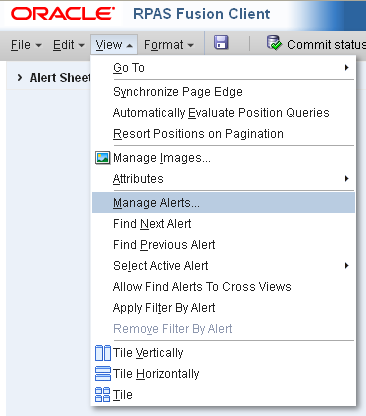
You can access the Alert Manager from the Home page (Figure 16-1) or from the View menu (Figure 16-2).
|
Note: If there are no alerts of either type in the workbook, the Alert Manager window and the alert options in the View menu will not appear. |
If no workbooks are currently open, you may pick a batch alert from the Alert Manager list to load and have the system automatically construct a workbook that contains that alert's measure and any other measures that you want to display. Use this workbook to examine the actual measure values involved in the generation of the batch alert, so that you can make decisions about what needs to be done next.
To build an alert manager workbook using batch alerts, complete the following steps:
In the Alert Manager dialog box, select the alert that you want to see. Selecting a batch alert enables the New Workbook option.
Click New Workbook.
The Workbook Wizard dialog box opens. Select any optional alerts you want to include in the workbook and click Next.
Select the workbook template type and click Next.
|
Note: If the workbook template for the workbook the user is building contains real time alerts, the real time alerts will be incorporated into the new workbook. This lets the user to see complementary batch and real time alerts. |
The hierarchies shown in this step are related to the workbook you select. In the top section, select the hierarchies you want to range. This means that only the positions in this hierarchy that trigger the alert are available for selection in the workbook wizard. In the bottom section, select the hierarchies that you do not want to see in the workbook. Click Next.
The workbook wizard steps from this point on depend on the workbook you selected. For each step, select the positions you want to see in each dimension. At the last step, click Finish.
The Alert Worksheet Selection dialog box opens. Select the view (worksheet) you want the alert to appear in. If you do not select a view, Alert Manager automatically selects one with the appropriate base intersection.
|
Note: The Alert Manager Selection dialog box does not have a cancel button. Once you click the Finish button on the Alert Manager Workbook Wizard, you can no longer change the selected positions and can only select the worksheet from the list provided and click OK. |
If you select a view that has a base intersection below the base intersection of the alert, a message appears that states the base intersections do not match and an additional view is created.
The workbook opens.
If you have an open workbook already displayed, you can use the Alert Manager to insert a batch alert measure into that workbook. This lets you view multiple alert measures simultaneously and address alert-related issues without building a new workbook for each.
To insert a batch alert in an existing workbook, complete the following steps:
In the open workbook, select the Manage Alerts option in the View menu.
The Alert Manager dialog box for batch alerts opens. Select the batch alert you want to insert in the open workbook and click Insert Alert. (Insert Alert is grayed out until a batch alert is selected.)
The workbook refreshes and the alert measure is inserted.
Close the dialog box using the Close icon or Cancel.
The Alert Manager dialog box closes, and the alert measure is visible in the workbook.
In the view, the batch alert appears and behaves like a read-only Boolean measure. Positions that have triggered the alert have selected check boxes.
If you have more than one batch alert (or a combination of batch and real time alerts) in the workbook, use the Select Alert icon to choose the alert type that you want to work with. Use the Find Next and Find Previous alert icons (Figure 16-11) to scroll through all instances of that alert in the workbook. If the next or previous alert is not visible in the view, the view refreshes or scrolls to make it visible.
|
Note: You can use the alert controls to determine whether to work with batch alerts or real time alerts. If you opt to work with batch alerts, you can use the controls to step forward or back through those alerts. If you opt to work with real time alerts, you can use the controls on those. |
After you have reviewed the alert instances and made any necessary changes to the data, you can mark the batch alert as resolved in the Alert Manager dialog box.
To resolve a batch alert, check the Resolved check box for that alert (Figure 16-12). Checking the resolved check box does not change the data in the workbook or clear the instances of that alert. It serves only as a visual cue that you have addressed the alert.
Real time alerts can be considered resolved when their hit count falls to zero in the workbook.
Real time alerts are interactive alerts that are displayed when you open a workbook or view. The alerts are then updated each time you edit data and click Calculate.
|
Note: For a detailed explanation of how to configure Real Time Alerts, see the RPAS Configuration Tools User Guide. |
Real Time Alerts are configured in the RPAS Configuration Module, which is normally only accessible by Administrators. This section gives a brief overview of how these alerts are configured. It is intended to give some background information for users with access to the Fusion Client only.
Alert Definition
Real Time Alerts are configured on workbook templates and appear in workbooks built using those templates. An alert definition specifies a number of conditions, each with styles and a message, that the alert can detect and display. Alerts hits are determined by a designated alert measure, which uses a rule to calculate a condition identifier representing each hit at a designated alert intersection. These hits are then displayed on the cells of a designated target measure at that same intersection. The alert definition also contains a priority that is used when multiple alerts are raised on the same target measure cells.
Alert Measure
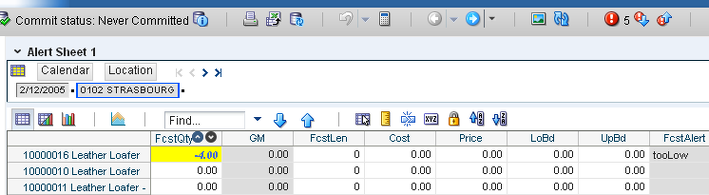
The alert measure is calculated by a rule that detects the conditions for the alert. For example, an alert measure FcstAlert may be computed by the following rule:
FcstAlert = if(FcstQty <300, "tooLow", if(FcstQty >600, "tooHigh",""))
In this example, tooLow and tooHigh are condition identifiers, which the alert definition would associate with a style and a message. The alert measure does not have to be visible in any views.
Target Measure
The alert definition specifies a target measure on which the hits appear. This may be a measure used in the alert measure's rule, for example FcstQty above, but does not have to be. When an alert measure computes a condition for a cell, the corresponding target measure cell represents the alert hit and is formatted (and navigated to) accordingly.
The target measure cells must be visible at the alert intersection for hits to be shown. The target measure can be the same as the alert measure, if desired. The same measure may be used as the target for a number of different alerts. In the case of colliding hits, the alert's priority is used to determine which alert formats the cell, but the cell will be navigated to for any of the alerts present.
Condition Definitions
For each condition that can be produced by the alert measure's rule, a style, label, and message is defined. You can modify the styles via Format/Alert Styles. The styles are used to format target measure cells with the condition, and the message is displayed as part of the tooltip information that appears when you mouse over hit cells.
When you open a worksheet, the real time alert hits are calculated and displayed. They are refreshed every time you click Calculate or invoke operations such as Save and Custom Menu Executions or as part of the Commit process.
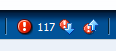
The toolbar contains an alerts icon. The number beside the icon shows the number of hits for the currently active real time alert for the entire workbook.
Click on the up or down arrows to move to the next or previous real time alert hit relative to the currently selected cell in the pivot table.
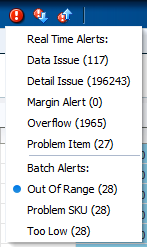
Click on the exclamation mark to bring up a detailed list for both forms of alert.
If only one form of alert has active alerts, only that form of alert is displayed. For example, if there are no current batch alerts, this list only displays real time alert hits.
Select a specific type of alert to select that type of alert hit in the worksheet. You can then step through those alerts using the Find Next Alert or Find Previous Alert options on the toolbar.
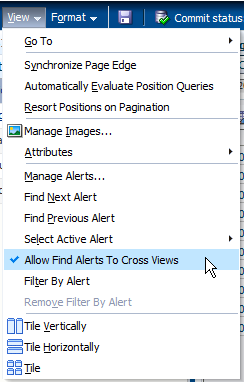
The View menu has Find Next, Find Previous, and Select Active Alert controls:
Find Next and Find Previous Alert
These options work in the same way as the options on the toolbar. Select them to move to the next or to the previous alert. These controls are disabled when navigation is not possible, given the count or layout of the view(s).
Select Active Alert
This option works in the same way as the option on the toolbar. Select a specific type of alert to select that type of alert in the work sheet. You can then step through those alerts using the Find Next Alert or Find Previous Alert options.
Several other options are available on the View menu.
Allow Users to Find Alerts to Cross Views
This option is only active when a real time alert is selected. You can toggled it on or off by clicking it. If it is active, it will display a check mark.
This options affects the behavior of the navigation controls. If you select it, real time alert navigation will move to the next or previous worksheet view in the current task when all real time alert hits have been exhausted in the current view. Otherwise, navigation is restricted to the current worksheet view.
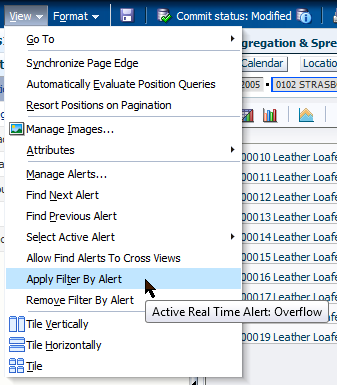
Filter by Alert
This option is only available for real time alerts. If Filter by Alert is selected, the current view will be filtered to only display the active real time alerts of the current type. Select it from the View menu.
When applied, the rows, columns and pages in the worksheet view are restricted to those with the currently selected real time alert. These rows are not dynamically updated. The same rows, columns and pages remain visible after a calculation changes the data.
Remove the filter by selecting the Remove Filter by Alert option on the View menu.
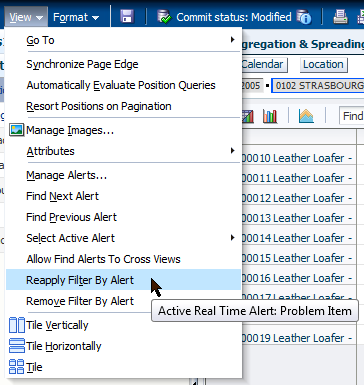
Reapplying an Alert Filter
After editing the data to address problems associated with a number of alerts, you can use the Calculate option. Once the results are recalculated, some real time alerts will being cleared. In addition, other real time alerts may be generated.
Since the number, type, and position of the alerts may be changed by the calculation, you can remove the filter to see all rows in the worksheet. All rows become visible, including alerts of different types.
Reapply Filter By Alert is available in the View menu. If you select it, the same alert that was used previously will be reapplied. Alternatively, you can select a different type of alert from the global toolbar. In this case, you will see the Apply Filter By Alert option.
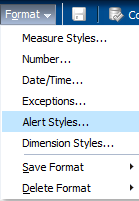
Each real time alert is preconfigured with a specific appearance. These styles are set up in the Configuration Module. You can modify them using the Alert Styles option in the Format menu.The settings are saved with the current workbook.Use Save Format so that the modified styles can be used in other workbooks or by other users.
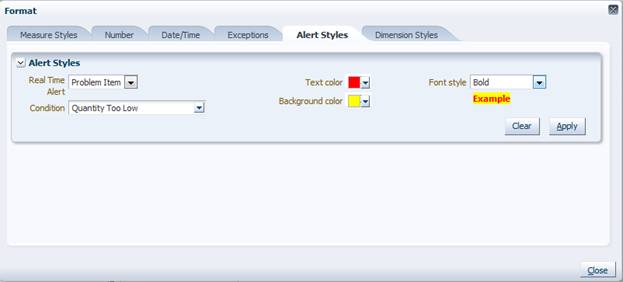
This brings up the Format dialog box opened to the Alert Styles tab.
You can customize the appearance of the alerts.
Real Time Alert automatically sets the options visible in the Condition drop-down list.
Condition customizes the appearance of the Condition drop-down list. All conditions can be set to the same appearance, or individual conditions may be set to different appearances.
The visual appearance can be specified from a combination of text color, background color, and font style. The result is shown as an example.
Three buttons are available:
Apply saves the current settings.
Clear removes the settings so the real time alert reverts to an unformatted style.
Close closes the dialog box.
Saving the Alert Styles
You can save the modified real time alert appearances in three forms: For Just Me, For My Group, or For Everyone. Specify the save option using the Save Format option on the Format menu. These take effect the next time you create a new workbook from the workbook template that the modified real time alert appearances have been saved back to.
A specific measure (such as Gross Margins or Forecast Quantities) may be the subject of more than one real time alert. The order of precedence can be set for cases where multiple alerts occur. Do this by selecting the Manage Alerts option from the View menu.
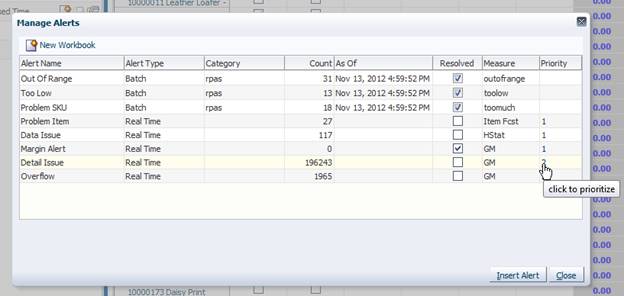
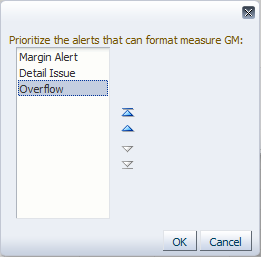
This brings up the Manage Alerts dialog box.
Click on any figure in the Priorities column to bring up the Prioritize dialog box.
This shows all real time alerts for a specific measure. Change the priority by highlighting an alert and using the up or down arrows. Click OK to close the dialog box and return to the Manage Alerts dialog box. Click the Close button to close this dialog box.
This section explains how to work with real time alerts.
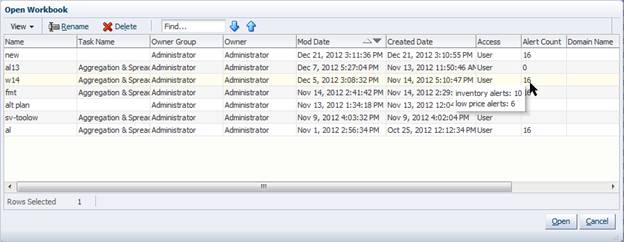
Saved Real Time Alert Counts
The Open Workbook dialog box lists the number of real time alerts for each available workbook. Mouse over the number to bring up a tool tip that contains further details.
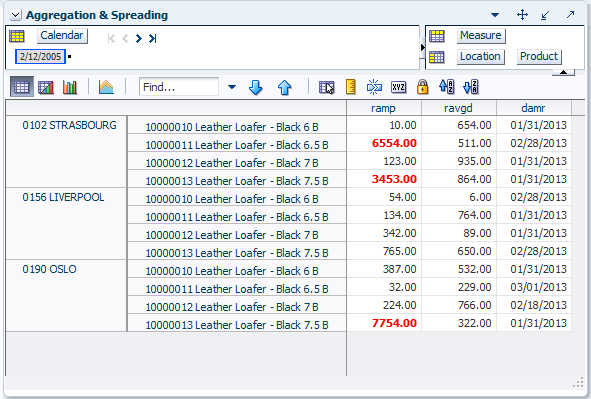
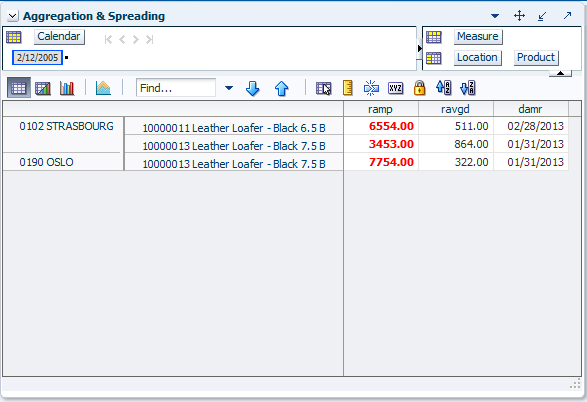
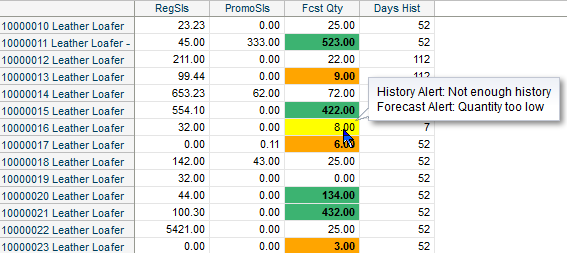
Real Time Alerts in the Workbook
Real time alerts in the workbook are shown by highlighted cells. The highlighting consists of a combination of text color, background color, and font style. Mouse over a specific cell to bring up a tooltip specifying the nature of the alert.
The appearance of the cells are set to default values in the configuration module, but you can customize the appearance using Customizing Alert Appearance. If a cell has multiple real time alerts, the order in which they appear is set in the configuration Module. Only the first alert is visible. You can customize the order using Setting the Alert Priorities.
Where a view has large numbers of rows, you can filter the view so that only rows, columns, and pages with alerts show, using Other Alert Options on the View Menu.
You can then systematically work to clear the real time alerts in the view by:
Navigating to a specific real time alert and identifying its nature from its appearance or from the tool tip.
Editing the value of any cell referenced by the rule to calculate the alert.
Clicking Calculate to update the view.
When you click calculate, if an appropriate value has been entered into the cell, the alert should clear.
You can then periodically commit the changes to save them back to the multidimensional database.
You can use an extended measure to define, view, and edit a measure as a proportion or percentage of another measure for a parent that is up one or more levels. These measure relationships are also referred to as participation measures. These measures can be defined in the RPAS Fusion Client in a view or preconfigured in the RPAS Configuration Tools. For more information about preconfigured measures, see the Oracle Retail Predictive Application Server Configuration Tools User Guide.
This functionality is commonly used to define measures that are percentage participations of sales measures. Typically, these measures are defined as:
Absolute Percent of Parent: A percentage of a fixed level (such as class) so that the participation of each item to the class can be viewed and manipulated.
Relative Percent of Parent: A percentage to the next level shown in any dimension (such as Product).
Ranking: A value that indicates the relative order of positions in either ascending or descending order.
Cumulative Sum: A sequence of partial sums of a given sequence, based on an ascending or descending rank.
Cumulative Percent: A sequence of partial sums of a given sequence, based on an ascending or descending rank expressed as a percentage to the total.
|
Note: Extended measures can be defined only on measures that have Total as their default aggregate method.When the percentage of the extended measure is changed, values of the underlying measure change to reflect the newly set percentage.Multiple extended measures can be defined for the same underlying measure; however, only one extended measure or the underlying measure can be edited before calculation. All other versions are protected. Smart editing is not allowed in the extended measure. Extended measures cannot be based on split dimensions. The value of an extended measure is a fraction between zero and one. If desired, you must format the measure to be displayed as a percentage. For extended measures contributions in instances with very small values (such as 0.000001) in the cell, those values are considered to be 0.0 when the extended measurescontribution is determined. For Ranking, Cumulative Sum, and Cumulative Percent, the extended measures are read only. |
The following sections describe the extended measures features.
The absolute percent of parent type of absolute percent of parent measures allows you to explicitly define the parent levels that are used to calculate the percentage at all child levels.
As shown in Figure 16-28, an absolute percent of parent measure has been created for the Weekly Sales - Regular measure with a defined parent at the Fiscal Half level of the Calendar dimension. Therefore, this measure shows what percentage of the Season 4 half that each week is.
To create an absolute extended measure, complete the following steps:
Right-click the measure for which you want to create an extended measure.
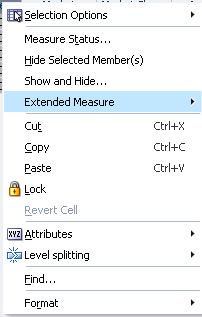
The right-click context menu opens. Select the Extended measure... as shown in Figure 16-29.
Click Create.
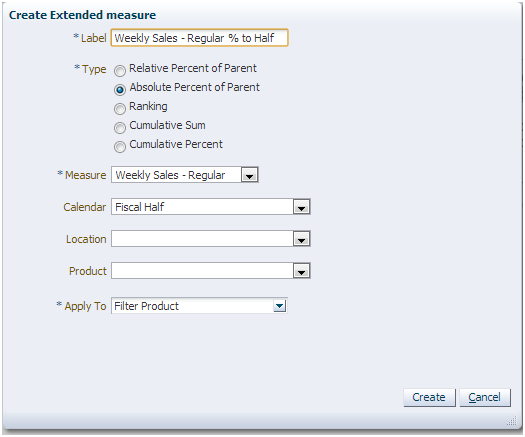
The Create Extended Measure dialog box opens (Figure 16-30). If you right-clicked a valid measure (one that has Total as its aggregation) in Step 1, then that measure appears in the Measure list. If not, then you must select a valid measure from the list.
In the Create Percent-of-Extended Measure dialog box, change the Type to Absolute Percent of Parent. The dialog box refreshes and displays drop-down lists for all the dimensions (Figure 16-31). These lists contain the levels that are available for that dimension. These levels are defined by the intersection of the measure.
Select the level at which you want to compare the child levels.
When finished defining the parent levels, click Create. The view refreshes and the new extended measure appears (Figure 16-32).
As shown in Figure 16-32, a new extended measure has been created for the Weekly Sales - Regular measure with a defined parent at the Fiscal Half level of the Calendar dimension.
The measure shows what percentage of the Season 4 half that each week is. For example, the Weekly Sales - Regular for week 10/6/2006 are 8 percent of the entire Season 4 half of the 2006 fiscal year.
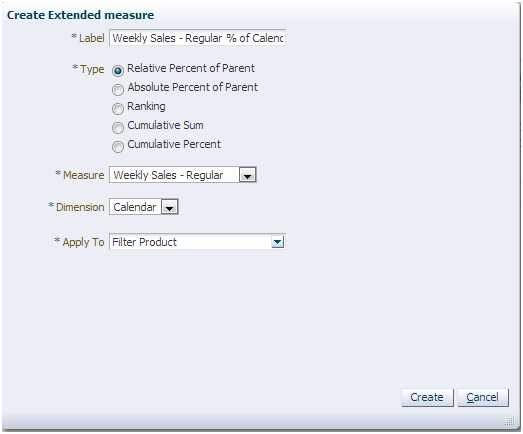
The relative percent of parent type of extended measure calculates the value for a given level, which is the percentage that level is of the immediate parent level displayed in the view. This type can only be set for a single dimension.
To create a relative percent of parent measure, complete the following steps:
Right-click the measure for which you want to create an extended measure.
The right-click context menu opens. Select the Extended measure... as shown in Figure 16-33.
Click Create.
The Create Extended Measure dialog box opens (Figure 16-34). If you right-clicked a valid measure (one that has Total as its aggregation) in Step 1, then that measure appears in the Measure list. If not, then you must select a valid measure from the list.
In the Create Extended Measure dialog box, select the dimension for which you want to set the parent level.
Click Create. The view refreshes and the new extended measure appears.
As shown in Figure 16-35, a new extended measure has been created for the Weekly Sales - Regular measure with a defined dimension of Calendar. Because a dimension is defined and not a specific level of a dimension, the extended measure data shown is relative. This means that the percentage shown is compared to the next level shown in the view.
For example, the Weekly Sales - Regular % of Calendar measure for week 10/6/2006 makes up 24 percent of the next level shown, which is October, FY 2006. Accordingly, October makes up 32 percent of all [Quarter 4, FY 2006]. No percentage is shown for all [Calendar] because it is the highest level in the workbook.
The difference between an absolute percent of parent measure and a relative one is that the parent level for absolute is specified by the user. The parent level for relative is not specified. It is the next parent level shown in the view.
As shown in Figure 16-36, there is an Absolute and Relative Percent of Parent measure created on the source measure of Weekly Sales - Regular. The absolute measure (Weekly Sales - Regular % to Half) compares the children levels to the static level of Fiscal Half.
The relative extended measure (Weekly Sales - Regular % of Calendar) displays the percent of the children position to the next higher position displayed in the view.
Since the absolute extended measure specifies Fiscal Half as the parent level, the other level shown in the view, Month, is compared to Half. For instance, week 10/6/2006 is 8 percent of the Season 4. October is 32 percent of the Season 4. Because Fiscal Half is the specified parent, it does not show what percentage of FY2006 it is.
However, the relative extended measure only specifies the Calendar dimension as the parent. This means that any parent level shown in the view can act as the parent. Therefore, week 10/6/2006 is 24 percent of its immediate parent level, which is month October. October is 32 percent of its immediately displayed parent level, which is Season 4. Finally, Season 4 is 100 percent of its immediately displayed parent level, FY2006. The relationship of month to quarter (the configured parent of the month level) is not displayed since quarter is not displayed in the view.
If the month level of the Calendar dimension were hidden in this view, then the relative extended measure would look more like the absolute one since the immediately displayed parent level for week would be Fiscal Half, which is the specified absolute parent. This is illustrated in Figure 16-37.
A ranking extended measure is used to create a measure that indicates the relative order of positions in either ascending (Low to High) or descending order (High to Low). You can also display rankings at only the base level or at all visible levels.
|
Note: These ranking measures are read-only measures and cannot be edited. |
To create a ranking measure, complete the following steps:
Right-click the measure for which you want to create an extended measure.
The right-click context menu opens. Select the Extended measure... as shown in Figure 16-38.
Click Create.
The Create Extended Measure dialog box opens (Figure 16-39). If you right-clicked a valid measure (one that has Total as its aggregation) in Step 1, then that measure appears in the Measure list. If not, then you must select a valid measure from the list.
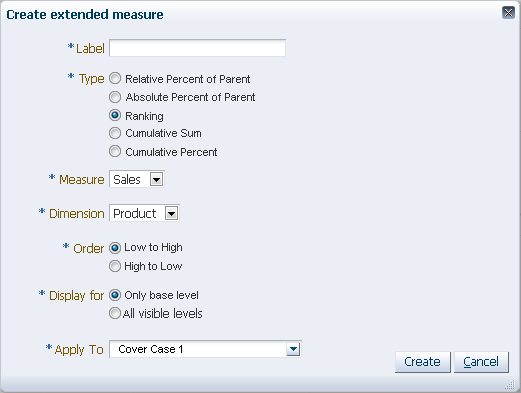
In the Create Extended Measure dialog box, select Ranking as the type of extended measure.
Enter a label for the new ranking extended measure. The Measure selection changes to the list only numerical (real or integer) source measures. It defaults to the measure selected in the right-click operation.
Select the dimension in which to rank the source measure.
Select the rank from Low to High or High to Low.
Select the position ranking display, either Only base level or All visible levels.
When Only base level is selected, the ranks are displayed for positions at base level only. The rank values for positions at higher levels would be empty. This is the default.
When All visible levels is selected, the rank is displayed for positions at all visible levels except the All level.
Select views to display the extended measure. Only worksheet views that have the selected measure are listed. By default, the current worksheet view is selected.
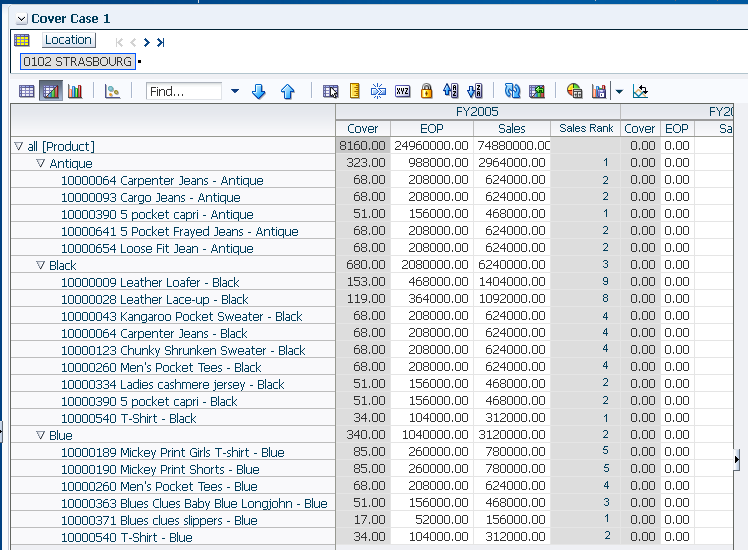
Click Create. The view refreshes and the new extended measure appears next to the source measure when the source measure is visible. If it is not visible, the ranking measure is hidden as well.
A cumulative sum extended measure is used to create a measure that indicates the source measure in ascending or descending order.
|
Note: These cumulative sum measures are read-only measures and cannot be edited. |
To create a cumulative sum measure, complete the following steps:
Right-click the measure for which you want to create an extended measure.
The right-click context menu opens. Select the Extended measure... as shown in Figure 16-41.
Click Create.
The Create Extended Measure dialog box opens (Figure 16-42). If you right-clicked a valid measure (one that has Total as its aggregation) in Step 1, then that measure appears in the Measure list. If not, then you must select a valid measure from the list.
In the Create Extended Measure dialog box, select Cumulative Sum as the type of extended measure.
Enter a label for the new cumulative sum extended measure. The Measure selection changes to the list only numerical (real or integer) source measures. It defaults to the measure selected in the right-click operation.
Click Create. The view refreshes and the new extended measure appears next to the source measure when the source measure is visible.
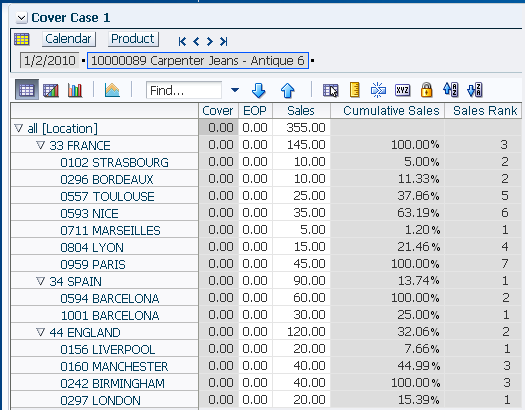
A cumulative percent extended measure is used to create a sequence of partial sums of a given sequence based on an ascending or descending rank expressed as a percentage to the total.
|
Note: These cumulative percent measures are read-only measures and cannot be edited. |
To create a cumulative percent measure, complete the following steps:
Right-click the measure for which you want to create an extended measure.
The right-click context menu opens. Select the Extended measure... as shown in Figure 16-44.
Click Create.
The Create Extended Measure dialog box opens (Figure 16-34). If you right-clicked a valid measure (one that has Total as its aggregation) in Step 1, then that measure appears in the Measure list. If not, then you must select a valid measure from the list.
In the Create Extended Measure dialog box, select Cumulative Percent as the type of extended measure.
Enter a label for the new cumulative percent extended measure. The Measure selection changes to the list only numerical (real or integer) source measures. It defaults to the measure selected in the right-click operation.
Click Create. The view refreshes and the new extended measure appears next to the source measure when the source measure is visible.
You can select all cells in the current slice by using the Select All option. This is useful if you need to select all instances within a large view.
The Select All option is located in the toolbar as well as in the right-click context menu.
To select all cells in the current slice, use one of the following methods:
In the RPAS Fusion Client, you can select all instances of a particular level at once with the Replicate Selections feature. This is useful if you need to select all instances within a large view.
To select instances using the Replicate Selections feature, complete the following steps:
Select an instance of the particular level for which you want to select all instances. You can select a single cell or an entire row or column.
Click the Selection Options icon in the toolbar. Or, right-click the measure and from the right-click context menu select Selection Options. Then, click Replicate [Row/Column] Selections.
The view refreshes and all instances of the chosen level are selected.
Complete the following steps to copy an instance of a particular level and paste it to all other instances of that level:
Right-click an instance of the particular level for which you want to copy and paste to all other instances.You can select a single cell or an entire row or column.
The right-click context menu opens. Select the Copy option.
Select the same instance again. Either click the Selection Options icon in the toolbar, or right-click and select Selection Options from the right-click context menu. Then, click Replicate [Row/Column] Selections.
The view refreshes and all instances of the chosen level are selected.
With all the instances of that particular level highlighted, select the Paste option in the Edit menu.
The view refreshes, and all the selected instances contain the copied information.
Complete the following steps to use the replicate selection function to create a particular chart view.
Select an instance of the particular level for which you want to select all instances to show in a chart view. You can select a single cell or an entire row or column.
Click the Selection Options icon from the toolbar. Or, right-click and select Selection Options from the right-click context menu. Then click Replicate [Row/Column] Selections.
The view refreshes and all instances of the chosen level are selected.
With all the instances of that particular level highlighted, click the Switch to Chart View icon.
The chart view opens. Only the selected instances are shown in the chart. In Figure 16-59, the chart only shows data for the Brick & Mortar because those were the selected instances.
The RPAS Fusion Client includes functionality to create Consumer Decision Trees. Instead of viewing data within a pivot table, you access a hierarchy viewer, also called a Consumer Decision Tree Editor, in which you can create positions in a tree structure of an hierarchy.
The Consumer Decision Tree represents an ordered decision flow for a consumer of a certain category of product made prior to buying the product. The Consumer Decision Tree is an unbalanced tree where each decision point represents an attribute value. Consumer Decision Trees are used to aggregate data in the product dimension and are displayed as an alternate hierarchy in the product dimension within the pivot table.
To access the Consumer Decision Tree Editor, you must be logged into a solution that has a task configured as a Consumer Decision Tree editor. To access the editor, the process is the same as it is to build or open any workbook. The only difference is in using the editor.
The Page Edge component displays in the Consumer Decision Tree Editor and shows the dimensions that make up a Consumer Decision Tree. Keeping the page edge lets you access the Consumer Decision Tree in a sequential and ordered way by paging through the various Consumer Decision Tree positions.
After accessing a task that is configured to be a Consumer Decision Tree Editor task, you can create a new Consumer Decision Tree.
To create Consumer Decision Tree:
Select New CDT from the context menu while on a File Node. The New CDT window displays.
Enter a label for the new version.
Click Create.
Continue to edit and build the Consumer Decision Tree.
The Consumer Decision Tree editor is within the framework of the Fusion Client workbook page, but many of the workbook functions do not apply to the Consumer Decision Tree. The available commands from the Consumer Decision Tree editor view are shown in Figure 16-62 and Table 16-1:
The Consumer Decision Tree tree displays the root node representing the pre-selected highest node of the Consumer Decision Tree.
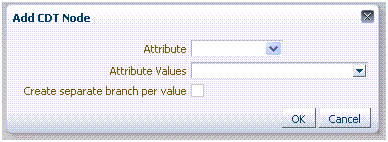
Click Add Child to add a child node to the branch. A pop-up is displayed.
Select an attribute from the Attribute drop-down list.
Select a value from the Attribute Value drop-down list.
Select the Create separate branch per value, if applicable. When you select more than one of the attribute values, this field create a separate node for every attribute value selected.
|
Note: A node can be created by selecting one or more attribute values. If multiple attribute values are chosen, and the check box to create a separate branch is not selected, one node that represents multiple attribute values is created.If one branch is created for all values of an attribute, select all attribute values and only one node will appear with the attribute value of ALL. If all the attribute values for an attribute are used, either by creating one node or separate nodes, a child cannot be added to the node, and the Add Child is disabled. Creating a node with ALL does not associate the specific attribute values with the node. Instead, it encompasses any attribute value. |
Click OK.
Editing is allowed on all nodes as long as there are additional attribute values available. The selections from the node being edited are preselected in the dialog. The attribute cannot be changed, so the attribute drop-down is disabled. Any attribute values that are in use by other siblings are not displayed in the list.
Nodes can be deleted from the tree. There are two options for deleting: Delete and Delete Branch.
Selecting Delete deletes the selected node. Delete is available for any leaf node (a node without any children). It is also available for a non-leaf node that represents all the attributes for an attribute value: the children under this node move under the parent.
Selecting Delete Branch deletes the entire branch of nodes under the selected node, but not the selected node itself.
Copy and Paste functionality is provided to copy nodes from one branch to another. Copy Branch is enabled when a node is selected that has children. The Copy Branch function copies the full branch of children of the selected node, but not the selected node itself. Paste Branch is enabled when a branch has been copied and the selected node is a leaf node.
The Consumer Decision Trees have the potential to become large and occupy more space than the screen real estate allows for. The hierarchy viewer component used to display the Consumer Decision Tree provides several features to assist in viewing the Consumer Decision Tree effectively.
One way to limit the amount of space taken up by the Consumer Decision Tree is to collapse branches of the tree. For any node that has children, a small triangle appears at the bottom of the box for that node. Mouse over the triangle to enlarge it and display an option to collapse that node if it is expanded and expand the node if it is collapsed.
The easiest way to copy Consumer Decision Trees as a whole is to use the Consumer Decision Tree explorer as it provides quick access to any Consumer Decision Tree. Quick copying is aided by the Consumer Decision Tree explorer's right-click menu and selecting Copy, which copies the selected node.
To paste, select one more node to copy to, again using either the right-click menu or the menu item under Edit.
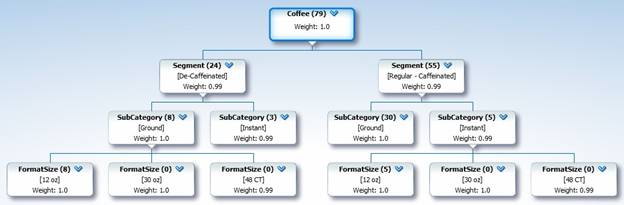
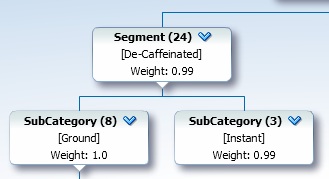
The nodes in the Consumer Decision Tree contain two items of information that give the user information. These are SKU Count and Weight.
For each node, the SKU count is the number of SKUs that match the attribute common to that node and its parent.
In the above example, the Segment has an attribute of Decaffeinated and 24 SKUs match that attribute. The SubCategory levels have attributes of Ground and Instant, which are matched by 8 and 3 SKUs, respectively. Other attributes may be possible at the SubCategory level, such as Whole Bean and Flavored. If these attributes are not included in the CDT, the total number of SKUs at the SubCategory level will be less than that of their parent Segment node.
The SKU count for a a parent node is always greater than or equal to the SKU counts of its children.
SKU weights measure the relative importance of each node. They are normally calculated in another application and imported into the CDT. A typical way of calculating the weight is as the total sales of items represented in the node as a percentage of the total sales of items in the category. This value may change, depending on the time period, trade area, and customer segment for which the CDT has been defined.
For example, if a specific node had 10,247 sales from a total of 93,284 sales in the category, it would be assigned a weight of 0.11.
The XML button enables a CDT to be imported in the form of an XML file. The XML file has an attribute that enables the imported CDT to be set to Read Only. This can be used to ensure that externally generated CDTs are not edited after import.
However, copying from one CDT to another is allowed in some circumstances. In that case, imported values are cleared.
If the CDT is edited, for example by deleting or cutting and pasting nodes, the SKU count for each node will be recalculated and re-displayed. However, cutting and pasting a note invalidates any calculations of the weights associated with each node. As these calculations cannot be carried out by the CDT editor, the weights are removed from the entire tree.
Save and Save As functions are available for any Consumer Decision Tree Editor Workbook. Overall, the Consumer Decision Tree workbook save process behaves exactly the same way as any other workbook save does, despite the difference in appearance.