| Oracle® Retail Item Planning Configured for COE User Guide for the RPAS Classic Client Release 14.1 E55948-01 |
|

 Previous |
 Next |
| Oracle® Retail Item Planning Configured for COE User Guide for the RPAS Classic Client Release 14.1 E55948-01 |
|
Previous |
Next |
Use the Markdown Planning workbook during in-season planning to create a new price plan using COE forecasts and what-if calls. This price plan can then be seeded into the associated Wp measures in the Item Planning workbook. After this Markdown Planning workbook process is complete, return to the Item Planning workbook to complete your in-season updates.
The Markdown Planning workbook has four tabs:
To build the workbook, perform the following steps.
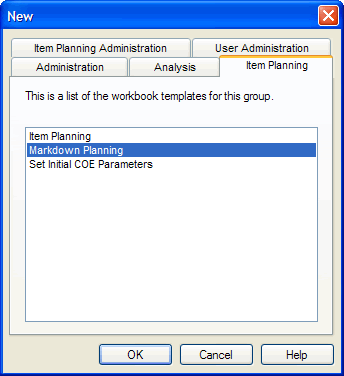
Click the New icon in the toolbar.
The New Workbook dialog box appears. On the Item Planning tab, select Markdown Planning and click OK.
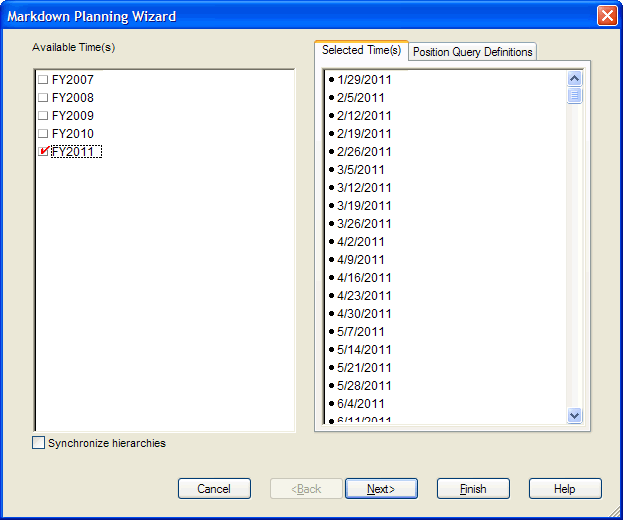
The workbook wizard opens at the Calendar Selection step. Select the fiscal year that you want to plan. Click Next.
The Product Selection step of the workbook wizard appears. Select the style/colors you want to plan. Click Next.
The Location Selection step of the workbook wizard appears. Select the price zones you want to plan. Click Finish.
The workbook is built, and Lifecycle Summary Worksheet worksheet opens.
Use the worksheets in the Markdown Setup tab to review the lifecycle of the style/color as it was setup in the Item Planning workbook.
The Markdown Setup tab contains two worksheets:
Use this worksheet to review the lifecycle of the style/color that was set up in the Item Planning workbook. This worksheet is read-only.
Table 8-1 Lifecyle Summary Worksheet Measures
| Measure | Description |
|---|---|
|
Start Sell Week |
The first week the style/color is sold. |
|
Out of Stock Week |
The planned week that the style/color is out of stock. |
|
Weeks on Sale (Reg + Promo) |
The combined number of weeks the style/color is on sale at the regular and promotional price. |
|
Wp Number of Weeks - Clearance Price |
The number of weeks that the style/color is on sale at clearance price. |
|
Wp Number of Weeks - Total Life |
The total number of weeks of the style/color's entire lifecycle. This is the sum of the regular, promotional, and clearance weeks. |
|
Wp Exit Strategy Start Week |
The first week that the style/color inventory and sales are moved from regular to clearance. |
After you have reviewed the lifecycle, continue to the Spread to Price Zone Worksheet.
Use this worksheet to spread the item plan's sales from the channel level to the price zone level. This is done by choosing a spread method and setting the price zone contribution.
To set the spread method, perform the following steps:
In the Spread Source measure, select a spread method. There are three options:
Store Count: Spreads the sales according to the number of stores in each price zone.
COE Initial Forecast: Spreads by the initial forecast sales units that the COE engine creates. These forecasts, which are at the price zone level, are sent in a batch process from COE.
What If Forecast: Spreads according to the COE forecast that you revise in the What-If Request Worksheet.
Click Calculate. The data in the System Recommended Contribution measure is updated to reflect the relevant recommendations for the spread method.
In the Wp Price Zone Contributions measure, enter the spread percentages for each price zone. Use the data in the System Recommended Contribution measure as a guideline. The percentages you enter are used to spread the channel level plan down to the price zone level.
Table 8-2 Spread to Price Zone Worksheet Measures
| Measure | Description |
|---|---|
|
Spread Source |
Select the spread method to use. Options are Store Count, COE Initial Forecast, and What If forecast. |
|
System Recommended Contribution |
The system recommended contribution for the spread method. Use this data as a guideline. |
|
Wp Price Zone Contributions |
Enter the spread percentages for each prize zone. The sales are spread to the price zones according to these percentages. |
When finished, continue to the Markdown Analysis Tab.
Use the worksheets in the Markdown Analysis tab to create and review what-if forecasts. There are five worksheets to help you do this:
Use this worksheet to review the COE initial forecast and the what-if forecasts you create in this workbook. Use the three measure profiles provided in this worksheet to review this high level information:
Initial Forecast: Displays the initial forecast from the COE engine. This forecast is generated automatically by the Clearance Optimization Engine based on the actual sell through, compared to the target sell through and exit dates. This forecast is loaded into IP COE in the batch process. This is the default measure profile (shown in Table 8-2).
What-If Forecast: Displays the forecast you create in the What-If Request Worksheet. The what-if forecast is the COE response to your what-if request, based on your markdown cadence.
Initial and What-If Forecast: Displays the COE and the what-if forecast.
After you have reviewed the forecast data, continue to the What-If Request Worksheet to create and review what-if forecasts.
Table 8-3 lists the measures in this worksheet.
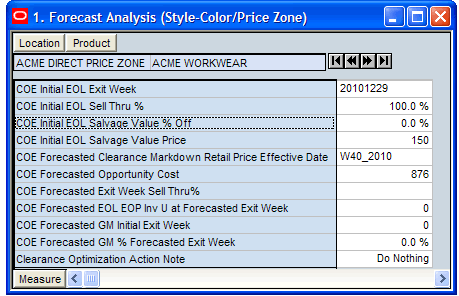
Table 8-3 Forecast Analysis (Style-Color/Price Zone) Worksheet Measures
| Measure | Description |
|---|---|
|
COE Initial EOL Exit Week |
The Exit Date COE uses to calculate the Recommended Clearance Markdown. This measure is a single hierarchy selection that displays the week ending date of the exit week. |
|
COE Initial EOL Sell Thru % |
The Recommended Sell Thru % used by COE to determine the optimal Recommended Clearance Markdown Price Plan that achieves the desired Sell Thru %. |
|
COE Initial EOL Salvage Value % Off |
The percent off the Current Ticketed Retail Price that is used to determine the Salvage Value Price for any remaining inventory at the Exit Date. |
|
COE Initial EOL Salvage Value Price |
The Salvage Value Price applied to any remaining inventory at the end of the Exit Date. |
|
COE Forecasted Clearance Markdown Retail Price Effective Date |
The Effective week of the COE Recommended Clearance Markdown Ticketed Retail Price. |
|
COE Forecasted Opportunity Cost |
The dollar amount you can generate in profit by taking the recommended markdowns. |
|
COE Forecasted Exit Week Sell Thru % |
The Forecasted week that the Targeted Sell Thru % is achieved. |
|
COE Forecasted EOL EOP Inv U at Forecasted Exit Week |
The Forecasted EOP Inv Units in the Forecasted Exit Week. |
|
COE Forecasted GM Initial Exit Week |
The cumulative Forecasted Gross Margin value at the Forecasted Exit Week. This is calculated for each time period based on the COE Recommended Clearance Markdown Retail Price and the Product Cost Price. |
|
COE Forecasted GM Forecasted Exit Week |
The cumulative Forecasted Gross Margin Value at the Forecasted Exit Week (Date) expressed as a percentage of the COE Forecasted Sales Retail Value and the Product Cost Price. |
|
COE Forecasted GM % Forecasted Exit Week |
The cumulative Forecasted Gross Margin Percentage at the Forecasted Exit Week (Date) expressed as a percentage of the COE Forecasted Sales Retail Value. |
|
Clearance Optimization Action Note |
Notation for the type of Clearance Optimization What-If action that has been initiated. |
Use this worksheet to create different what-if calls by trying different combinations of clearance prices, price ladders, markdown weeks, and so on.
|
Note: Price ladders, which define a set of markdown prices, are created within the Clearance Optimization Engine (COE) application.Because price ladders are created in COE, you can only select a price ladder to use within Item Planning. To edit it, you must return to COE. For more information about the creation of price ladders, see the "Price Ladders Standard Interface" section and the "Price Ladders Standard Interface Specification" table in Chapter 2 of the Oracle Retail Clearance Optimization Engine Operations Guide. |
To create a what if forecast, perform the following steps:
In the COE What-If Price Ladder ID measure, select the price ladder to apply to the style/color. These price ladders were created in COE.
Upon a calc, the COE What-If Price Type measure will auto-update to the correct type based on the Ladder ID, depending on if the Ladder ID is a percent-off (”Percent Off”) or a Price Point (”PPT”).
Enter the remaining What-If data.
In the Initiate COE Optimization What-If Call measure, select the check box.
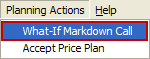
In the Planning Actions menu, select the What-If Markdown Call option.
Table 8-4 lists the measures in this worksheet.
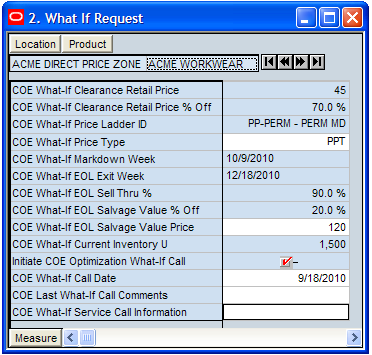
Table 8-4 What-If Request Worksheet Measures
| Measure | Description |
|---|---|
|
COE What-If Clearance Retail Price |
User-selected revised Clearance Price to be used during the What-If COE Optimization Service Call. |
|
COE What-If Clearance Retail Price % Off |
User-selected revised Clearance Price percent off the Current Ticketed Retail Price. |
|
COE What-If Price Ladder ID |
User-selected Price Ladder used for validation within COE. |
|
COE What-If Price Type |
Auto-selected Price Type (either Price Point "PPT" or Percent Off). |
|
COE What-If Markdown Week |
User-selected week in which the What-If Price is be applied to be used during the What-If COE Optimization Service Call. |
|
COE What-If EOL Exit Week |
User-selected revised EOL Exit Week to be used during the What-If COE Optimization Service Call. |
|
COE What-If EOL Sell Thru % |
User-selected revised EOL Sell Thru% to be used during the What-If COE Optimization Service Call. |
|
COE What-If EOL Salvage Value % Off |
User-selected revised Salvage Value % Off the Current Ticketed Price to be used during the What-If COE Optimization Service Call. |
|
COE What-If EOL Salvage Value Price |
The revised Salvage Value Price based on the What-If Clearance Salvage Value % Off and the Current Ticketed Price. |
|
COE What-If Current Inventory U |
User-selected Current Inventory Units to be used during the What-If COE Optimization Service Call. |
|
Initiate COE Optimization What-If Call |
Selecting this measure indicates that a What-If Call should be invoked from the What-If Markdown Call custom menu option. |
|
COE What-If Call Date |
Date of the last What-If Call. |
|
COE Last What-If Call Comments |
Text measure for user comments associated with the last What-If Call. |
|
COE What-If Service Call Information |
Text measure that contains error information passed from the COE service call. |
To see the what-if forecast at the week level, continue to the Forecast Analysis (Style-Color/Price Zone/Week) Worksheet. To see the forecast at the style/color/price zone level, return to the Forecast Analysis (Style-Color/Price Zone) Worksheet.
Use this worksheet to review a detailed view of the initial forecast and the what-if forecast you created in the What-If Request Worksheet. Use the three measure profiles provided in this worksheet to review this information:
Initial Forecast: Displays the initial forecast from the COE engine. This forecast is loaded into IP COE in the batch process. This is the default measure profile.
Initial and What-If Forecast: Displays both the COE initial forecast and the what-if forecast.
What-If Forecast: Displays the forecast you create in the What-If Request Worksheet (shown in Table 8-4).
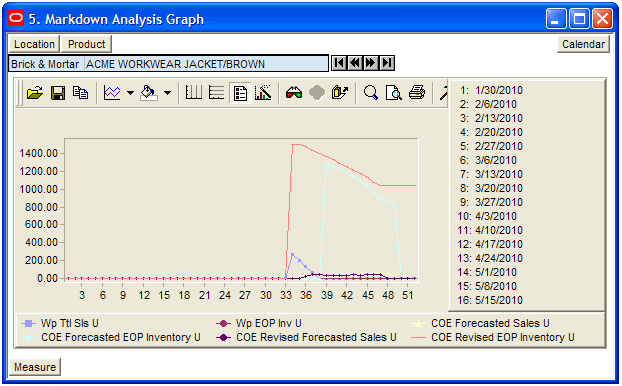
Figure 8-10 Forecast Analysis (Style-Color/Price Zone/Week) Worksheet - What-If Forecast Measure Profile

Table 8-5 Forecast Analysis (Style-Color/Price Zone/Week) Worksheet - What-If Forecast Measure Profile Measures
| Measure | Description |
|---|---|
|
Wp Original Ticketed Retail Price |
The Original Ticketed Retail Price at the time when the product was first set-up in the Item Master files. |
|
Wp Product Cost Price |
The Cost Price of the product. |
|
Wp Current Ticketed Retail Price |
The Current Ticketed Retail Price for the product at the end of the last period / beginning of the current time period. |
|
COE Recommend Clearance Markdown Retail Price |
The COE Optimized Recommended Clearance Markdown Ticketed Retail Price. |
|
COE Revised Price Type |
Text measure that contains the price type value returned from the COE service call. |
|
COE Revised Clearance Retail Price |
Revised Clearance Price validated against the COE Price Ladders and used during the What-If COE Optimization Service Call. |
|
COE Revised Clearance Retail Price % Off |
Revised Clearance Price percent off the Current Ticketed Retail Price. |
|
COE Revised Price % Off Original Price |
Original Price Measure that holds the value returned by the COE service call. |
|
COE Revised Clearance Markdown R |
The extended Retail Value of the COE Clearance Markdown based on the COE Revised Clearance Markdown Price and the Beginning of Period Inventory Units in the effective week of the Clearance Markdown. |
|
COE Revised Salvage Value Markdown R |
The extended Retail Value of the Salvage Markdown. |
|
COE Revised Clearance Markdown Retail Price Plan |
The COE Optimized Revised Clearance Markdown Ticketed Retail Price Plan following a What-If COE Optimization Service Call. |
|
COE Revised Forecasted Sales U |
Units in unelapsed time periods combined with Actual Sales Units in elapsed time periods. |
|
COE Revised Forecasted Sales R |
The extended Retail Value of the COE Forecasted Sales Units. |
|
COE Revised Sales AUR |
The Revised Sales AUR following a What-if COE Optimization Service Call. |
|
COE Revised Forecasted GM Revised Exit Week |
The Forecasted Periodic Gross Margin value at the Targeted Exit Week (Date). Calculated for each time period based on the COE Revised Clearance Markdown Retail Price and the Product Cost Price. |
|
COE Revised Forecasted GM % Revised Exit Week |
The Forecasted Periodic Gross Margin Percentage at the Targeted Exit Week (Date). Calculated for each time period based on the COE Revised Sales AUR and the Product Cost Price. |
After you have reviewed the what-if forecast, continue to the Markdown Impact Dashboard Worksheet to see the key performance indicators that were created in the Merchandise Financial Planning application.
Use this worksheet to review the markdown budget created in the Merchandise Financial Planning (MFP) application. This budget is at the subclass level. The key performance indicators of the budget are provided to help you understand the total budget for the subclass and to enable you to compare it to the price plan you create in this workbook.
Use the measure details to compare the actual plan to the working plan, initial forecast, and revised forecast.
Table 8-6 and Table 8-7 describe the measures in this worksheet.
Table 8-6 Markdown Impact Analysis Dashboard Worksheet Measures
| Measure | Description |
|---|---|
|
MFP Total Sales Retail |
This is a Key Performance Indicator that contains the MFP Total Sales Retail for the measure details on this worksheet. The measure details are shown in Table 8-7. |
|
Sales Retail |
This is a Key Performance Indicator that contains the Sales Retail for the measure details on this worksheet. The measure details are shown in Table 8-7. |
|
MFP Total Markdowns Retail |
This is a Key Performance Indicator that contains the MFP Total Markdowns Retail for the measure details on this worksheet. The measure details are shown in Table 8-7. |
|
Markdowns |
This is a Key Performance Indicator that contains the Markdowns for the measure details on this worksheet. The measure details are shown in Table 8-7. |
|
Gross Margin |
This is a Key Performance Indicator that contains the Gross Margin for the measure details on this worksheet. The measure details are shown in Table 8-7. |
|
Gross Margin % |
This is a Key Performance Indicator that contains the Gross Margin % for the measure details on this worksheet. The measure details are shown in Table 8-7. |
|
Sell Thru % |
This is a Key Performance Indicator that contains the Sell Thru % for the measure details on this worksheet. The measure details are shown in Table 8-7. |
|
EOL Inventory Retail |
This is a Key Performance Indicator that contains the EOL Inventory Retail for the measure details on this worksheet. The measure details are shown in Table 8-7. |
Table 8-7 Markdown Impact Analysis Dashboard Worksheet Measure Details
| Measure | Description |
|---|---|
|
Total Plan |
Original Plan for all time periods until EOL. |
|
Total Act / Proj |
Actual data in all elapsed time periods and Current Plan Projection for all unelapsed time periods until EOL. |
|
Total Act/Proj diff to Total Plan |
The difference between the Actual-Projections and the Original Plan. |
|
Total Act/Proj var to Total Plan |
The difference between the Actual-Projections and the Original Plan expressed as a percentage variance to the Original Plan. |
|
Total Act / Initial Optimization Forecast |
Actual data in all elapsed time periods and Initial Optimized Forecast for all unelapsed time periods until EOL. |
|
Total Act/Initial Opt Fcst diff to Total Plan |
The difference between the Actual-Initial Optimized Forecast and the Original Plan. |
|
Total Act/Initial Opt Fcst var to Total Plan |
The difference between the Actual-Initial Optimized Forecast and the Original Plan expressed as a percentage variance to the Original Plan. |
|
Total Act / Revised Optimization Forecast |
Actual data in all elapsed time periods and Revised Optimized Forecast for all unelapsed time periods until EOL. |
|
Total Act / Rev Opt Fcst diff to Total Plan |
The difference between the Actual-Revised Optimized Forecast and the Original Plan. |
|
Total Act/ Rev Opt Fcst var to Total Plan |
The difference between the Actual-Revised Optimized Forecast and the Original Plan (Op) expressed as a percentage variance to the Op. |
Once you have reviewed the markdown budget from MFP, continue to the Markdown Analysis Graph Worksheet.
Use this worksheet to view the forecast analysis in the graph view. If you are not satisfied with the results, return to the What-If Request Worksheet to adjust the what-if call.
After you have created a what-if forecast you are satisfied with, continue to the Review and Approval Tab.
Use the worksheets in the Review and Approval tab to roll the what-if forecast back to the channel level and seed it into the item plan.
This tab has three worksheets:
Begin with the Markdown Analysis (Style-Color/Price Zone/Week) Worksheet.
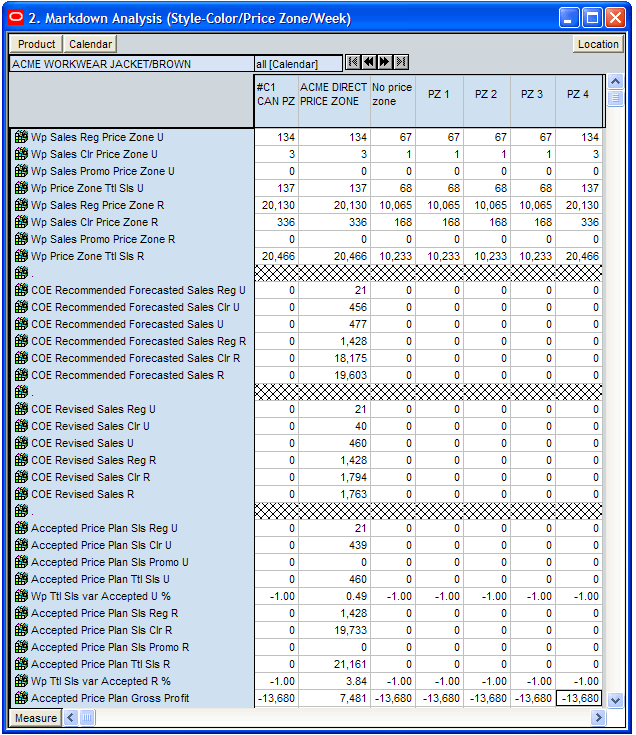
Use this worksheet to review all of the recommendations for each price zone. The purpose of this worksheet is to compare the different recommendations and choose which one you want to use with each price zone in the Price Plan Acceptance Worksheet.
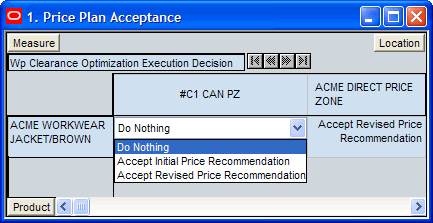
Use this worksheet to select the recommendation for each price zone. You can select different recommendations for each price zone.
To assign recommendations to a price zone, perform the following steps:
Review the different recommendations for each price zone in the Markdown Analysis (Style-Color/Price Zone/Week) Worksheet and decide which recommendation you want to use for each price zone.
In this worksheet, select recommendation you decide to use. There are three options:
Do Nothing: Uses the Wp sales spread from the channel plan as the price plan in this price zone.
Accept Initial Price Recommendation: Uses the unaltered recommendations from COE that were loaded through the batch process.
Accept Revised Price Recommendation: Uses the recommendation that you created in the What-If Request Worksheet.
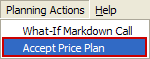
After you have selected a recommendation for each price zone, select the Accept Price Plan option in the Planning Actions menu.
A success message appears, confirming that the recommendation has been assigned to the price zone.
Based on the decision for each price zone, the accepted price plan for each channel is computed by aggregating the corresponding sales measures.
After you have selected a recommendation for each price zone, continue to the Markdown Analysis (Style-Color/Channel/Week) Worksheet to review the price zones rolled into the channel level.
Use this worksheet to compare the current working plan to the newly accepted price plan at the channel level.
All measures in the Markdown Analysis (Style-Color/Channel/Week) Worksheet are read-only. They are separated into groups:
First group: Wp measures. These contain data from the Item Planning workbook you created.
Second group: COE Recommended Forecast measures. These contain data from the initial forecast loaded in IP COE from COE.
Third group: COE Revised Sales measures. These contain data of the revised forecast you created with the what-if call.
Fourth group: Accepted Price Plan. These contain the data of the price plan you chose in the Price Plan Acceptance Worksheet.
Review these groups to confirm that the accepted price plan you have chosen is the best choice. Then, you can return to the Item Planning workbook to seed the item plan with this new accepted price plan. By seeding with the accepted price plan, you are seeding the updated clearance price and regular units. The regular price should remain the same as it was in the preseason.
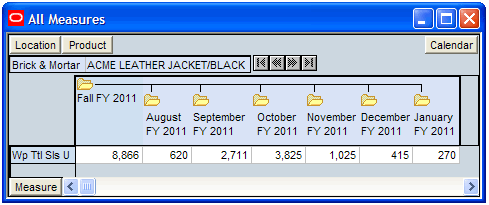
The All Measures tab contains one worksheet: All Measures. This worksheet contains all the measures in the workbook; however, only the Wp Ttl Sls U measure is visible in the default measure profile. The purpose of this worksheet is to allow you to create a view of workbook measures that you may not be able to view all at once in other worksheets.
Return to the Item Planning workbook and seed the item plan with the new price plan you have created in this workbook. To do this, select Accepted Price Plan as the seed source in the Seed Worksheet. The working plan measures of the selected style/colors are updated based on the planned sales units (regular and clearance) of the accepted price plans. All other item planning measures, such as shrink, margin, profit, and so on, are recalculated. At that point, you can compare the re-approved item plan to the MFP measures.