

|
The following sections describe the relationship between and the process of data collection and presentation in the WLDF Console Extension:
In a standard WLDF configuration, you can configure the Harvester to collect metrics for specified attributes of specified MBean instances. This information is available for programmatic access, and it is written to a standard log, HarvestedDataArchive, which you can view through the standard Administration Console. See
“Configuring the Harvester for Metric Collection” in Oracle Fusion Middleware Configuring and Using the Diagnostic Framework for Oracle WebLogic Server.
In the Instrumentation component, you can configure diagnostic actions to generate instrumentation events when the diagnostic actions are executed. See
“Configuring Instrumentation” in Oracle Fusion Middleware Configuring and Using the Diagnostic Framework for Oracle WebLogic Server. This information, too, is persisted in a standard log, EventsDataArchive., which you can view through the standard Administration Console.
Those WLDF components and log files enable you to display data in the WLDF Console Extension:
HarvestedDataArchive log. See How Metrics Data Is Collected and Presented.EventsDataArchive log. See How Instrumentation Data Is Collected and Presented.Data displayed in the WLDF Console Extension is generated, collected, and optionally persisted on the server, and the WLDF Console Extension on the client periodically polls that data for display in a chart.
When a view containing one or more metrics charts is activated in the WLDF Console Extension, data collection for viewing those metrics in real time is started on the server. The data collector continually gathers the data and places it in a “wrap-around” cache. That is, as new data fills the cache, the oldest data in the cache is lost. When a view is stopped (see Starting and Stopping a View), data collection for the contained charts is stopped. However, if the Harvester is configured to collect data for a metric, that data will continue to be harvested and persisted to the log.
To display current data, the WLDF Console Extension periodically polls the cache for a current data set and displays it in a chart.
| Note: | The size of the data set returned to the client is configurable. See Setting Global Properties. |
To display current metric data, no prior WLDF configuration is required. However, to display historical data for a metric, the WLDF Harvester must have been configured to harvest that data.
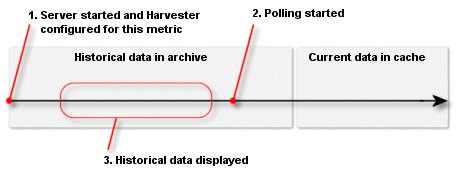
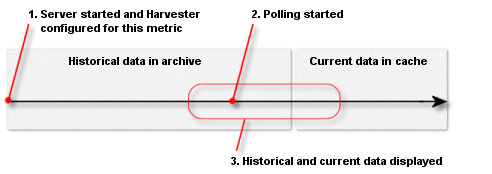
The following four illustrations (Figure 4-1, Figure 4-2, Figure 4-3, and Figure 4-4) show how metric data is retrieved and displayed for present and historical data, with and without harvesting.
These conceptual illustrations show a timeline from server startup to the present:
The data cache always contains the most current data. But if polling has been taking place long enough for old data to be purged, the cache does not contain all data from the time polling started. That is why the range of data shown through the viewport is not equivalent to the range of data collected since polling began.
If the Harvester was not configured to harvest data for this metric, no historical data is available for the metric and therefore cannot be displayed in the WLDF Console Extension client. If the Harvester was configured to harvest data for this metric, historical data is available for the metric and can be displayed by scrolling back through a chart (see Scrolling and Zooming the Data Displayed in a Chart
Figure 4-1 illustrates the following scenario:
Figure 4-2 illustrates the following scenario:
The scenario in Figure 4-3 shows the same scenario as in Figure 4-2, but in this case, the chart is scrolled to show historical data. All data is retrieved from the archive. Current data continues to fill the cache, but that data is not currently used.

The scenario in Figure 4-4 shows the same scenario as in Figure 4-2 and Figure 4-3, but in this case, the chart is scrolled to show some historical data and some current data. The historical data is retrieved from the archive, and the current data is taken from the cache.

For instrumentation data to be displayed in a chart, instrumentation must be configured in the WLDF configuration on the server. Data is always retrieved from the persisted store. If instrumentation is not configured and activated for a server, you will not be able to see any events in the Requests tab. For more about these requirements, see Making Instrumentation Data Available for Method Performance Charts.


|