15 Diagnosing Problems
This chapter contains the following sections:
Diagnosing Problems with Oracle WSM Policy Manager
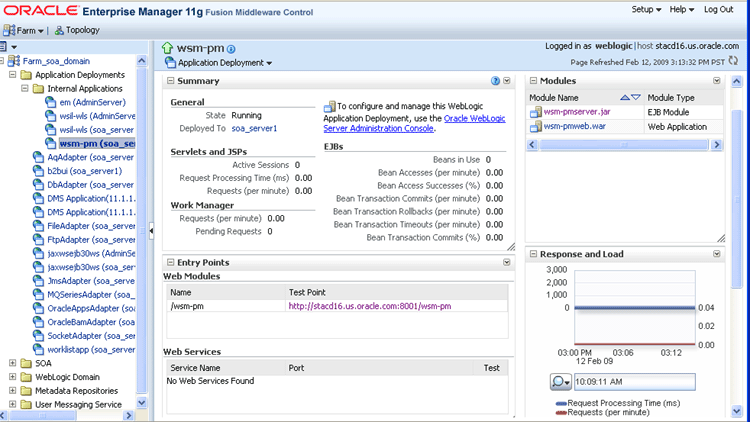
The Oracle WSM Policy Manager manages all Oracle WSM policies and needs to be running in order to use the Oracle WSM policy framework. You can check the current state of the Policy Manager and review its response time, load, and other data from the Oracle WSM Policy Manager page, shown in the following figure.
Figure 15-1 Oracle WSM Policy Manager Page

Description of "Figure 15-1 Oracle WSM Policy Manager Page"
To view the Oracle WSM Policy Manager page:
-
In the navigator pane, expand Application Deployments.
-
Expand Internal Applications.
-
Click wsm-pm.
The Oracle WSM Policy Manager home page is displayed.
-
Perform one or more of the following tasks:
-
Check the current state of the Policy Manager and identify the server to which it is deployed.
-
View the response time and current load.
-
Click the Test Point URL to validate the Policy Manager. Click the Validate Policy Manager link. If operational, a list of the predefined policies is displayed with descriptions.
-
The following lists the signs that indicate the Oracle WSM Policy Manager is not running. You can restart the wsm-pm application, as described in "Starting and Stopping Applications Using Fusion Middleware Control" in Oracle Fusion Middleware Administrator's Guide.
-
The Policy Manager state is shown as being shutdown in the Oracle WSM Policy Manager home page, shown in Figure 15-1.
-
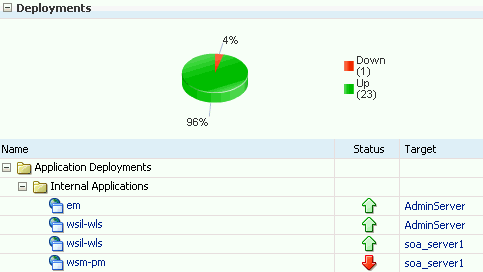
The wsm-pm internal application deployment displays as being shutdown on the Farm page in the Enterprise Manager, as shown in the following figure.
Figure 15-2 Oracle WSM Policy Manager Shutdown (Farm Page)

Description of "Figure 15-2 Oracle WSM Policy Manager Shutdown (Farm Page)"
-
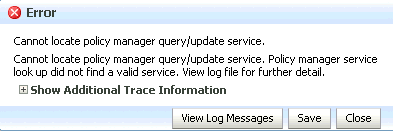
An error dialog box similar to the following displays when you attempt to access the Oracle WSM policy management pages in the Enterprise Manager. This error information is also written to the diagnostic log file, as described in "Reviewing Sample Logs".
Figure 15-3 Error Message—Oracle WSM Policy Manager Unavailable

Description of "Figure 15-3 Error Message—Oracle WSM Policy Manager Unavailable"
Diagnosing Problems Using Logs
Oracle Fusion Middleware components, including Web services, generate log files containing messages that record all types of events, including startup and shutdown information, errors, warning messages, access information on HTTP requests, and so on. Each log message includes specific information such as time, component ID, and user to assist you in pinpointing and diagnosing problems that arise.
You can review log messages to diagnose problems with specific components, such as Web services. There are two categories of log files that you can reference to assist in diagnosing problems with Web services:
-
Diagnostic logs—Enable you to access diagnostic data about specific feature components in Oracle Fusion Middleware. For more information, see "Using Diagnostic Logs for Web Services".
There is a set of predefined diagnostic loggers. You can configure your own diagnostic logger, as described in "Configuring a Diagnostic Logger for a Web Service".
-
Message logs—Enable you to view elements of the SOAP message request. You control message log creation using policies. For more information, see "Using Message Logs for Web Services".
For more information about logging in Oracle Fusion Middleware, see "Managing Log Files and Diagnostic Data" in Oracle Fusion Middleware Administrator's Guide.
The following sections describe how to use diagnostic and message logs to diagnose problems. A set of sample logs is provided at the end of this section.
Using Diagnostic Logs for Web Services
Diagnostic logs enable you to access diagnostic data about specific feature components in Oracle Fusion Middleware.
The following sections describe how to view and manage diagnostic log files:
Setting the Log Level for Diagnostic Logs
You set the logging level for Web service and Oracle WSM components at the WebLogic Server level, using the Log Configuration page.
In addition, you can override the log levels set at the server level for a specific Web service endpoint from the Web service endpoint page. The logging level set at the Web service endpoint level must be "finer grained" than the level set at the WebLogic Server level. Otherwise, the logging level set at the WebLogic Server level will be used.
The following procedures describe how to set the log level for diagnostic logs at the WebLogic Server and Web service endpoint levels. For more information, see "Setting the Level of Information Written to Log Files" in Oracle Fusion Middleware Administrator's Guide.
To set the log level for diagnostics logs at the WebLogic Server level:
-
Navigate to the WebLogic Server for which you want to configure diagnostic logs.
-
In the navigator pane, expand WebLogic Domain.
-
Expand the domain.
-
Select the desired server from the list.
The WebLogic Server home page is displayed.
-
-
From the WebLogic Sever menu, select Logs > Log Configuration.
The Log Configuration page is displayed.
-
Select the Log Levels tab.
-
Expand Root Logger.
-
Expand oracle.
-
Set the logging level for one or more of the following components:
-
oracle.webservices—Web service components.
-
oracle.wsm—Oracle WSM components.
You can fine tune the logging level by expanding either of the above components and specifying the logging level at the subcomponent level. By default, the logging levels are inherited from the parent and set to NOTIFICATION: 1 (INFO) for the Web service and Oracle WSM components and subcomponents.
-
To set the log level for diagnostic logs at the Web service endpoint level:
-
Navigate to the Web service endpoint page, as described in "Viewing the Details for a Web Service Port".
-
Click the Configuration tab.
-
Set the Logging Level field to one of the following settings: Severe, Warning, Information, Configuration, Fine, Finer, Finest or NULL.
Viewing Diagnostic Logs
You can view the diagnostic log files for an ADF and WebCenter Web service endpoint from the Log Messages page.
To view diagnostic logs for a Web service endpoint:
Navigate to the Web service endpoint page, as described in "Viewing the Details for a Web Service Port", and in the Quick Links section of the Web Services endpoint page (top right), click Diagnostic Logs.
Note:
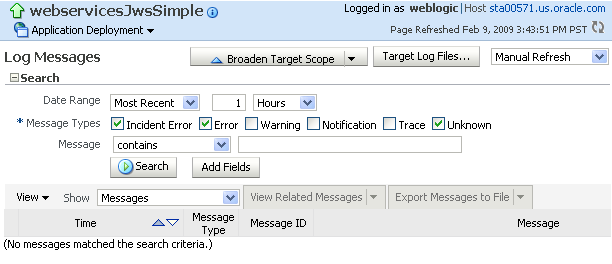
You can view a summary of all faults incurred by the Web services in your application. For more information, see "Monitoring the Performance of Web Services".The Log Messages page is displayed, as shown in the following figure.
Click on a message in the message area to view more details at the bottom of the page. If desired, you can export a message to a text, XML, or CSV file by selecting the messages on the list and clicking Export Messages to File.
You can control the message content displayed using the following controls:
-
Search—Modify the search criteria. For more information, see "Filtering Diagnostic Logs".
-
View menu—Select the columns to display in the table. Click on a particular column to sort contents up or down.
-
Show menu—Group messages by type or ID, or view them in chronological order.
-
View Related Messages—View messages related to those selected on the list.
-
Broaden Target Scope—Broaden the scope of messages displayed. You can broaden the scope to include all messages for the domain, WebLogic Server, or Farm.
-
Refresh menu—Specify an automatic or manual refresh rate.
To view the contents of a generated log file:
-
Click the log file icon associated with a message to view the contents of that log file.
-
Click Target Log Files... to display the Log Files page and view or download the contents of all generated log files.
For more information, see "Searching and Viewing Log Files" in Oracle Fusion Middleware Administrator's Guide.
Filtering Diagnostic Logs
By default, the Log Messages page displays a summary of diagnostic messages logged over the last hour.
-
Filter the messages that are displayed by updating the search criteria using the following fields:
-
Date Range—Set the date range to one of the following:
-
Most Recent—Set the amount of time to define the duration.
-
Time Interval—Set the start and end dates to define the interval.
-
-
Message Types—Select the message types that you want to display.
-
Add Fields—Add other message fields to your search criteria, such as Message ID, Component, and so on.
-
-
Click Search once you have set the fields, as desired.
The messages area is updated with the filtered results.
For more information, see "Searching and Viewing Log Files" in Oracle Fusion Middleware Administrator's Guide.
Using Message Logs for Web Services
Message logs enable you to access the contents of the SOAP message requests and responses for ADF and WebCenter Web services and clients. Messages logs are stored in a log file separate from the diagnostic messages, by default.
The following sections describe how to view and manage message log files:
Configuring Message Logs
You configure message logs for a Web service or client by attaching a policy that contains a logging assertion.
There is one predefined logging assertion template: oracle/log_template. This template is configured to log the entire SOAP message for the Web service request and response. By default, all predefined Web service security policies use this logging assertion to capture the entire SOAP message before and after the primary security assertion is executed. By default, the log assertion is not enforced. You must enable it in order for the SOAP message to be logged in message logs. It is recommended that the logging assertion be enabled for debugging and auditing purposes only. For more information about the predefined logging policy, see "oracle/log_policy".
You can create your own logging policy or assertion template to further refine the elements of the SOAP message that are logged for the Web service request and response. For example, you may wish to view only the SOAP body of the request message. To create a new policy, following the procedure described in "Creating Web Service Policies". You may wish to create a copy of the oracle/log_template assertion template and configure it for use in the new policy. For more information about creating a new assertion template, see "Creating an Assertion Template".
Viewing Message Logs
You can view the message log files for an ADF and WebCenter Web service endpoint from the Log Messages page.
To view message logs for a Web Service endpoint:
Navigate to the Web service endpoint page, as described in "Viewing the Details for a Web Service Port", and in the Quick Links section of the Web Services endpoint page (top right), click Message Logs.
The Log Messages page is displayed, similar to Figure 15-4. For more details about the contents of the Log Messages page, see "Viewing Diagnostic Logs".
Filtering Message Logs
By default, the Log Messages page displays a summary of SOAP messages logged over the last hour. You can filter the messages that are displayed by updating the search criteria. The process is the same as for diagnostic logs; for more information, see "Filtering Diagnostic Logs".
By default, the Component and Module message fields are included as part of the Search criteria for message logs. The Component field is set to the WebLogic Server name; the Module field is set to oracle.wsm.msg.logging, which is the name of the message logging component.
Reviewing Sample Logs
The following sections provide excerpts from sample logs, demonstrating how to diagnose specific problems using the log entries.
Sample Log: Oracle WSM Policy Manager Not Available
The following sample log excerpt indicates that the Oracle WSM Policy Manager is down. To resolve this issue, restart the wsm-pm application, as described in "Starting and Stopping Applications Using Fusion Middleware Control" in Oracle Fusion Middleware Administrator's Guide.
2009-02-16 16:21:28,029 [[ACTIVE] ExecuteThread: '4' for queue:
 'weblogic.kernel.Default (self-tuning)']
 ERROR policymgr.PolicyManagerModelBean logp.251 -
 Service lookup failed with URL:t3://stadk13.us.oracle.com:7001/wsm-pm
 oracle.wsm.policymanager.PolicyManagerException: WSM-02118 :
 The query service cannot be created.
...
Sample Log: Security Keystore Not Configured
The following sample log excerpt indicates that an Oracle WSM security policy with message protection was applied, but the keystore was not configured. To resolve this security fault, configure the keystore, as described in "Setting up the Keystore for Message Protection".
Feb 16, 2009 5:29:56 PM oracle.wsm.common.logging.WsmMessageLogger logSevere
 SEVERE: The specified Keystore file /scratch/sbollapa/stage131/user_projects/domains/sai131_domain/config/fmwconfig/default-keystore.jks
 cannot be found; it either does not exist or its path is not included in the
 application classpath.
 Feb 16, 2009 5:29:56 PM oracle.wsm.common.logging.WsmMessageLogger logSevere
 SEVERE: Keystore is not properly configured in jps config.
 Feb 16, 2009 5:29:56 PM oracle.wsm.common.logging.WsmLogUtil log
 SEVERE: failure in OWSM Agent processRequest, category=security,
 function=agent.function.client, application=default, composite=pe3test3,
 modelObj=Service1, + policy=null, policyVersion=null, assertionName=null
 oracle.wsm.common.sdk.WSMException: WSM-00101 : The specified Keystore file
 /scratch/sbollapa/stage131/user_projects/domains/sai131_domain/config/fmwconfig/default-keystore.jks cannot be found;
 it either does not exist or its path is not included in the application classpath.
...
Sample Log: Certificate Not Available
The following sample log excerpt indicates that an Oracle WSM security policy with message protection was applied that required a security certificate that was not available in the keystore. To resolve this security fault, configure the keystore with a certificate, as described in "Setting up the Keystore for Message Protection".
[2009-04-15T04:07:02.821-07:00] [jrfServer] [ERROR] [WSM-000062]
 [oracle.wsm.resources.security] [tid: [ACTIVE].ExecuteThread: '0' for
queue: 'weblogic.kernel.Default (self-tuning)'] [userId: <anonymous>]
 [ecid: 0000I2dTFG7DScT6uBe9UH19tRyv000000,0:1] [WEBSERVICE_PORT.name:
 NonCAAsCAMessageProtectionPolicyPort] [APP: jaxwsservices]
 [J2EE_MODULE.name: NonCAAsCAMessageProtectionPolicy] [WEBSERVICE.name:
 NonCAAsCAMessageProtectionPolicyService] [J2EE_APP.name: jaxwsservices]
 [arg: oracle.wsm.security.SecurityException: WSM-00062 :
 The path to the certificate used for the signature is invalid.]

[2009-04-15T04:07:02.810-07:00] [jrfServer] [NOTIFICATION] []
 [oracle.wsm.security.policy.scenario.processor.Wss11X509TokenProcessor]
 [tid: [ACTIVE].ExecuteThread: '0' for queue: 'weblogic.kernel.Default
 (self-tuning)'] [userId: <anonymous>]
[ecid: 0000I2dTFG7DScT6uBe9UH19tRyv000000,0:1]
[WEBSERVICE_PORT.name: NonCAAsCAMessageProtectionPolicyPort]
[APP: jaxwsservices] [J2EE_MODULE.name: NonCAAsCAMessageProtectionPolicy]
 [WEBSERVICE.name: NonCAAsCAMessageProtectionPolicyService] [J2EE_APP.name:
 jaxwsservices] Certificate path validation failed for signing certificate

[2009-04-15T04:07:02.821-07:00] [jrfServer] [ERROR] [WSM-00006]
 [oracle.wsm.resources.security] [tid: [ACTIVE].ExecuteThread: '0' for queue:
 'weblogic.kernel.Default (self-tuning)'] [userId: <anonymous>]
[ecid: 0000I2dTFG7DScT6uBe9UH19tRyv000000,0:1] [WEBSERVICE_PORT.name:
 NonCAAsCAMessageProtectionPolicyPort] [APP: jaxwsservices]
[J2EE_MODULE.name: NonCAAsCAMessageProtectionPolicy] [WEBSERVICE.name:
 NonCAAsCAMessageProtectionPolicyService] [J2EE_APP.name: jaxwsservices]
[arg: oracle.wsm.security.SecurityException: WSM-00062 : The path to the
 certificate used for the signature is invalid.] Error in receiving the request:
 oracle.wsm.security.SecurityException: WSM-00062 : The path to the certificate
 used for the signature is invalid.
Configuring a Diagnostic Logger for a Web Service
To further organize your diagnostic data, you can configure a new diagnostic logger for a Web service. You can configure diagnostic loggers for SOA, ADF, and Web Center services.
By default, the following loggers are defined:
-
odl-handler—Logs general diagnostic data for the Java EE components in the server.
-
owsm-message-handler—Logs SOAP messages as per Oracle WSM logging policies.
-
owsm-odl-handler—Logs diagnostic data for Oracle WSM components.
To configure a diagnostic logger for a Web service:
-
Navigate to the WebLogic Server for which you want to configure a diagnostic logger.
-
In the navigator pane, expand WebLogic Domain.
-
Expand the domain.
-
Select the desired server from the list.
The WebLogic Server home page is displayed.
-
-
From the WebLogic Sever menu, select Logs > Log Configuration.
The Log Configuration page is displayed.
-
Select the Log Files tab.
The current list of diagnostic loggers is displayed.
-
Click Create.
Note:
To copy the configuration for an existing diagnostic logger, select the logger and click Create Like.The Create Log File page is displayed.
-
Enter the data for the diagnostic logger, as follows.
Table 15-1 Fields in Create Log File Page
Field Description Handler Class
Handler class. Leave this value set to oracle.core.ojdl.looging.ODLHandlerFactory.
Log File
Name of the log file.
Log Path
Path to the log file.
Log File Format
Format of the log file. Valid values are text or XML.
Log Level
Default log level for the diagnostic logger. Select a log level from the list. Valid values include: INCIDENT_ERROR
-
INCIDENT_ERROR:1 (SEVERE+100)
-
ERROR:1 (SEVERE)
-
WARNING:1 (WARNING)
-
NOTIFICATION:1 (INFO)
-
NOTIFICATION:16 (CONFIG)
-
TRACE:1 (FINE)
-
TRACE:16 (FINER)
-
TRACE:32 (FINEST)
Use Default Attributes
Flag that specifies whether to use default attributes for the diagnostic logger.
Supplemental Attributes
Supplemental attributes required.
Loggers to Associate
Components to associate with the logger.
Rotation Policy
Specify whether you wish to rotate log files based on file size of length of time. For more information, see "Configuring Log File Rotation" in Oracle Fusion Middleware Administrator's Guide.
-
-
Click OK to create the diagnostic logger.
