User Guide
|
|
Monitoring
BEA AquaLogic Service Bus provides the capability to monitor and collect run-time information for systems operations purposes. AquaLogic Service Bus aggregates run-time statistics that you can view on a customizable Dashboard. The Dashboard allows you to monitor the health of the system and alerts you to problems in your messaging services. With this information, you can quickly and easily isolate and diagnose problems as they occur.
This chapter includes the following topics:
Monitoring Scenarios
The following describes some of the ways in which you can use AquaLogic Service Bus to check system operations and monitor messages.
The Dashboard page in the AquaLogic Service Bus Console provides the ability to immediately view the state of all servers and monitored services. The Dashboard displays two pie charts, a table, and several links. The Service Summary pie chart shows the percentage of alerts according to their severity for all services that have alert rules defined and monitoring enabled for the last 30 minutes. The Server Summary pie chart shows the current status of every server in the AquaLogic Service Bus domain. Additionally, from the Server Summary panel, you can drill-down and view the domain logs, which are grouped according to severity.
In addition to the pie charts, these Summaries include a list of the most active services and critical servers. The list displays up to ten services in descending order of the most number of alerts. The most critical server list displays the ten most critical servers. This display is based on the health state of the running servers, as defined by the WebLogic Diagnostic Service. For more information about the WebLogic Diagnostic Service, see Configuring and Using the WebLogic Diagnostics Framework.
From each of the summaries, you can drill-down into more detail by clicking a specific area on a pie chart or by clicking one of the links on the page.
The default Alert Summary table shows the severity of the alert, when the alert occurred, the name of the corresponding service, and what alert rule was violated. Alerts are displayed by severity. You can customize, search, and scroll through this table.
When you log into the AquaLogic Service Bus Console, you see a list of alerts on the Dashboard. Each row of the table displays the information that you have configured, such as the severity, timestamp, and associated service. You notice that numerous alerts have been generated since your last viewing. To find the problem, you filter the alerts and discover that the Service Level Agreement (SLA) violation is due to errors produced by the Post-Trade Processing proxy service. SLAs are agreements that define the precise level of service expected by AquaLogic Service Bus business and proxy services.
Alternatively, attention to the problem involves an alert rule's ability to send messages in the event of a SLA violation. In this case, you are notified by email of the alert rule violation. After receiving the emails, you look into the problem and discover that the errors are produced by the Post-Trade Processing proxy service.
To narrow the problem down, you can use the reporting module. This scenario is continued in Message Tracking.
Suppose that you want to see how many messages in a particular service have processed successfully and how many have failed. To access this information, from the Dashboard, you access the Service Monitoring Summary page and filter the display for the relevant service. Besides displaying the number of messages that have successfully processed or failed, you can also see which project the service belongs to, the average execution time of message processing, and the number of alerts associated with the service. You can display monitoring statistics for the period of the current aggregration interval or you can display monitoring statistics for the period since you last reset statistics for this service or since you last reset statistics for all services.
Note: You use the Global Settings page in the System Administration module of the AquaLogic Service Bus Console to reset statistics. When you do this, make sure you are not in a WebLogic session on the WebLogic Server Administration Console.
Clicking the name of the service brings you to that service's Service Monitoring Details page. This page provides additional information such as the minimum and maximum response times and the overall average time it takes for the service to execute a message, the success-failure ratio, the number of messages that have failed because of security or validation errors, and the number of messages associated with proxy service components (pipelines and route nodes). You can display this information for specific operations associated with the service. Again, you can display these statistics for the period of the current aggregration interval or you can display the statistics for the period since you last reset statistics for this service or since you last reset statistics for all services.
You are notified by email of a large number of execution-time SLA violations from the Trade Execution proxy service. To track down this problem, you log into the AquaLogic Service Bus Console. From the Dashboard, you drill into the service associated with the alerts and see that a pipeline operation that invokes an Avitek Web Service is unacceptably slow. After successfully renegotiating service-level characteristics with Avitek, you configure alert metrics to track Avitek's compliance with the agreement. Your company uses these results as the basis of ongoing discussions with Avitek regarding their performance.
About Monitoring
This section contains information on the following topics:
- Aggregation Interval
- Monitoring Architecture
- Monitoring Services
- Refresh Rate of Monitored Information
- Dashboard
Aggregation Interval
In AquaLogic Service Bus, the monitoring subsystem collects statistical information, such as message-count and execution time, over an aggregation interval. The aggregation interval is the time period over which data points for a statistic are collected and then displayed in the AquaLogic Service Bus Console.
To illustrate how the aggregation interval works, suppose that you have configured a Purchasing Order proxy service that has monitoring enabled with an aggregation interval of 10 minutes. When a user sends the first message through the proxy service, monitoring is started. During the first ten minutes, the Service Summary page displays the partially computed data. At this time the system does not have 10 minutes of data. After the first 10 minutes of data aggregation, the system always displays the last 10 minutes of data. For example, at the 14th minute, the Dashboard displays minutes 4 through 14. If no messages are processed after the 15th minute, on the 25th minute, the Service displays zero messages. For more information about how aggregation interval affects the display of monitored information, see Alert Rules.
You must explicitly enable monitoring for any business or proxy service that you create; monitoring is disabled by default. After you have enabled monitoring and set the aggregation interval for your individual services, you can enable or disable monitoring for all those services from the Global Settings page in the System Administration module. For more information, see Monitoring Services.
Alerts are automated responses to Service Level Agreements (SLAs) violations or occurrences, which are displayed on the Dashboard. You define alert rules to specify unacceptable service performance according to your business and performance requirements. Each alert rule allows you to specify the aggregation interval for that rule when configuring the alert rule. This aggregation interval is not affected by the aggregation interval set for the service. Alert rules also allow you to send an email notification or post a message to a JMS queue or topic about the violation.
Monitoring Architecture
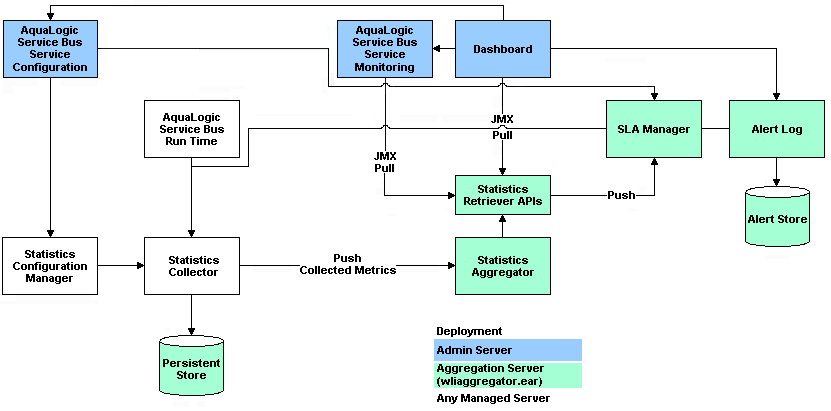
The following diagram shows the architecture of AquaLogic Service Bus monitoring.
Figure 5-1 Monitoring Architecture
The Statistics Configuration Manager stores and manages the statistics configuration for each operational resource. An operational resource is defined as the unit for which statistical information can be collected by the monitoring subsystem. An operational resource includes a proxy service, service operations, and pipelines. The Statistics Configuration Manager is notified about changes in the service definition, such as adding, updating, or deleting a pipeline.
Each managed server in a cluster hosts a Statistics Collector. The Statistics Collector collects statistics on operational resources as directed by the Statistics Configuration Manager. The collector also keeps samples history within the aggregation interval for the collected statistics. At every system-defined checkpoint interval, the collector stores the snapshot of current statistics into a persistent store for recovery purposes and sends the information to the Aggregator.
One of the managed servers in a cluster, called the Aggregating Server or Aggregator, is designated as the aggregator for cluster-wide statistics. At system-defined checkpoint intervals, each managed server in the cluster sends a checkpoint snapshot of its contributions to the Aggregator. The Aggregator then combines this information to offer cluster-wide statistics to its clients through Retriever APIs. The clients of Aggregator are the Dashboard, SLA Manager, and Service Monitoring modules.
To contribute a data point to the system, an operational resource in the system, such as a proxy service pipeline run time, calls a method on the Statistics Collector, and identifies itself, the statistic, and the data point.
The Dashboard shows the overall health related information of AquaLogic Service Bus. It provides an overview of the state of the system organized by server, services, and alerts.
After monitoring is enabled, the Service Monitoring Summary page in the AquaLogic Service Bus Console provides a view of the statistics collected for each service. It also provides information about the alerts generated due to SLA violations.
As previously mentioned, an SLA is an agreement that defines the precise level of service expected from business and proxy services in AquaLogic Service Bus. The SLA Manager, with the help of the AquaLogic Service Configuration module, allows users to configure SLA rule conditions and actions. The SLA Manager monitors SLA violations with the help of data provided by the Aggregator and sends notifications as configured in the alert rule actions. The SLA Manager is always deployed with the Aggregator and resides on only one managed server in cluster. The SLA Manager gives alerts to the Alert Log to store in the Alert Store.
Monitoring Services
When you create a business or proxy service, monitoring is disabled by default for that service. Enable monitoring as follows:
- To enable monitoring for an individual service, select the Enable Monitoring check box on the Manage Monitoring page. Then set the aggregation interval for the service by selecting the interval times from the hour and minute drop-lists. For information on how to do this, see "Viewing the Dashboard Statistics" in Monitoring in the Using the AquaLogic Service Bus Console.
- To enable monitoring for all services, select the Enable Monitoring check box on the Global Settings page. For information on how to do this, see "Enabling Monitoring" in System Administration in the Using the AquaLogic Service Bus Console.
Note: The Enable Monitoring option permits you to enable or disable monitoring of all services that have individually been enabled for monitoring. If monitoring for a particular service has not been enabled, you must first enable it and set the aggregation interval on the Manage Monitoring page before the system starts collecting statistics for that service.
When creating alert rules, you must enable monitoring before you create the rule. For more information, see Alert Rules and "Create an Alert Rule" in Monitoring in the Using the AquaLogic Service Bus Console.
Refresh Rate of Monitored Information
At run time, the default refresh rate for the Dashboard page is one minute. However, it may take up to three minutes for the information to be displayed on the Dashboard. This delay happens because of the time gaps between when the messages are processed by the proxy service, when the metrics are collected, and the refresh rate of the Dashboard. The system works as follows:
- Every 60 seconds, the aggregator merges all the documents it has received from the managed servers within the last minute.
- The AquaLogic Service Bus Console refreshes every minute; that is, it runs a query on the aggregated document and then displays the results.
Figure 5-2 Aggregation Time Line
For example, a proxy service starts sending data in T1, as shown in Figure 5-2. At T2—that is, the second minute—the collector sends the data to the aggregator. However, if an aggregation cycle has just occurred, the aggregator does not merge this data until the next aggregation cycle, which occurs after one minute, or a maximum of two minutes from the previous aggregation cycle. When the data is merged, it is now available for the AquaLogic Service Bus Console. Since the console refreshes every minute, if the refresh cycle has just passed, then the data is not displayed on the console until the third minute. Therefore, three minutes is the maximum delay.
You change the Dashboard polling interval in the System Administration module in the AquaLogic Service Bus Console. For information on how to do this, see "Setting the Dashboard Polling Interval Refresh Rate" in System Administration in the Using the AquaLogic Service Bus Console.
Dashboard
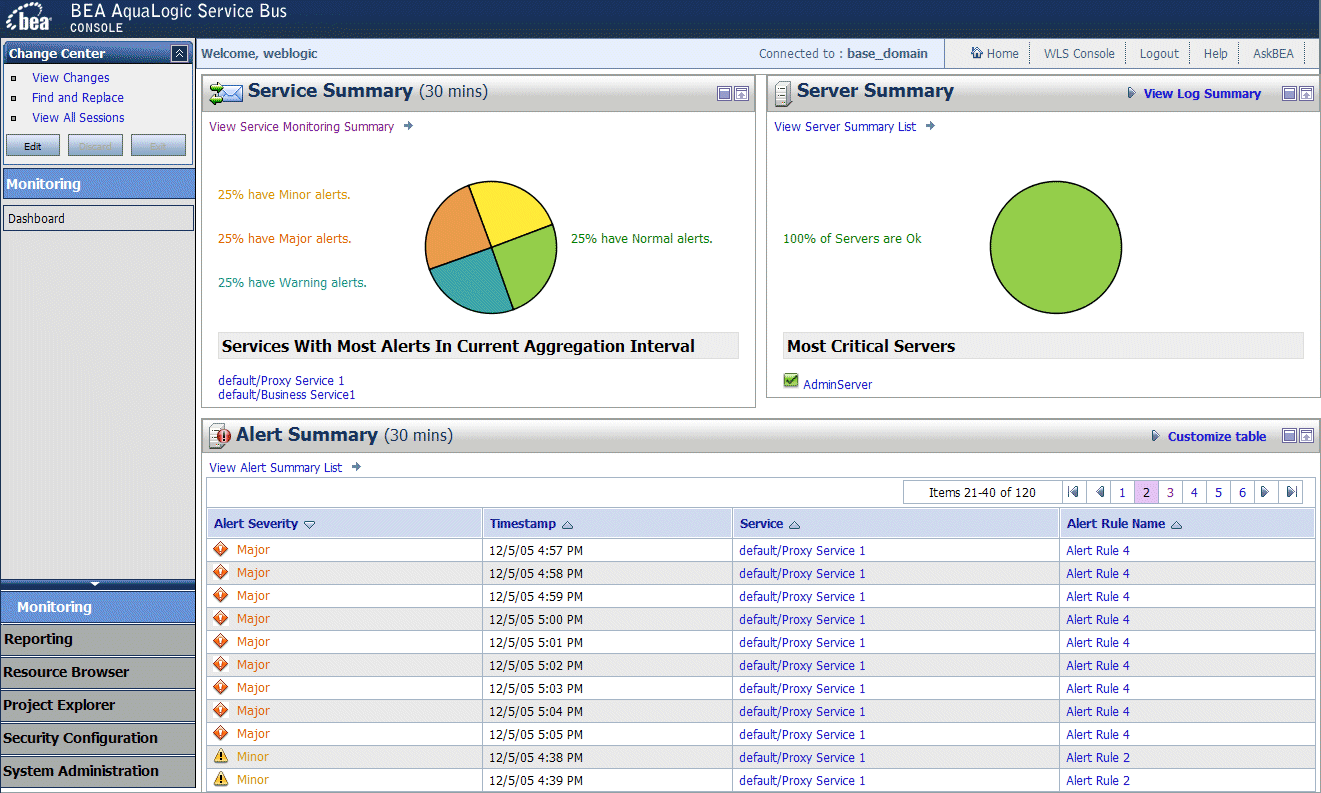
When you log onto the AquaLogic Service Bus Console, the Dashboard is automatically displayed. The Dashboard shows the monitoring information for the last 30 minutes. It provides an overview of the state of the system organized by server, services, and alerts, as shown in the following figure.
Figure 5-3 AquaLogic Service Bus Dashboard
As shown in the previous figure the Dashboard displays the following information:
- Services Summary—if alerts have been configured, summarizes the alert status for both proxy and business services. Alerts notify you of service performance based on rules you create.
- Servers Summary—displays the status of the servers.
- Alerts Summary—if alerts have been configured, displays which alert rules have been triggered.
From the Dashboard, you can drill-down into the system and easily find specific information, such as the average execution time of a service, the date and time an alert occurred, or length of time a server has been running.
You configure the Dashboard and monitoring in the AquaLogic Service Bus Console, which is described in the Monitoring and System Administration sections of the Using the AquaLogic Service Bus Console.
Service Summary
This section contains information on the following topics:
About the Service Summary
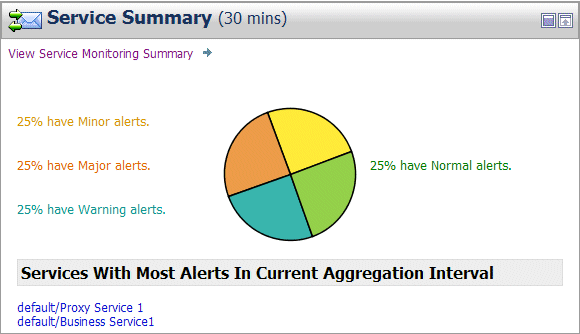
The Service Summary panel provides an overview of the state of the services. The Service Summary pie chart shows the percentage of alerts according to their severity for all services that have alerts defined and monitoring enabled for the last 30 minutes. The severity level of alerts is user configurable and has no absolute meaning. Severity types include Fatal, Critical, Major, Minor, Warning, and Normal.The services having the highest severity alerts are listed beneath the pie chart, as shown in the following figure. Up to ten services can be listed in descending order of the sevice with the most alerts.
Figure 5-4 Services Summary Pane
From the Service Summary panel, you can access more information about alerts by clicking the following:
- A specific area on a pie chart—displays the Service Summary page.
- The name of a service under Services With Highest Severity Alerts—displays the Service Monitoring Details page for that service.
- View Service Summary List—displays the Service Monitoring Summary page. To help you locate specific services, you can filter the services by different criteria.
Each of these pages is fully described in the sections that follow.
Warning: When a service (or its component; for example, a pipeline node) is renamed or relocated, its statistical data is lost.
For information on how to access detailed alert information, see "Viewing the Dashboard Statistics" in Monitoring in the Using the AquaLogic Service Bus Console.
Service Monitoring Summary
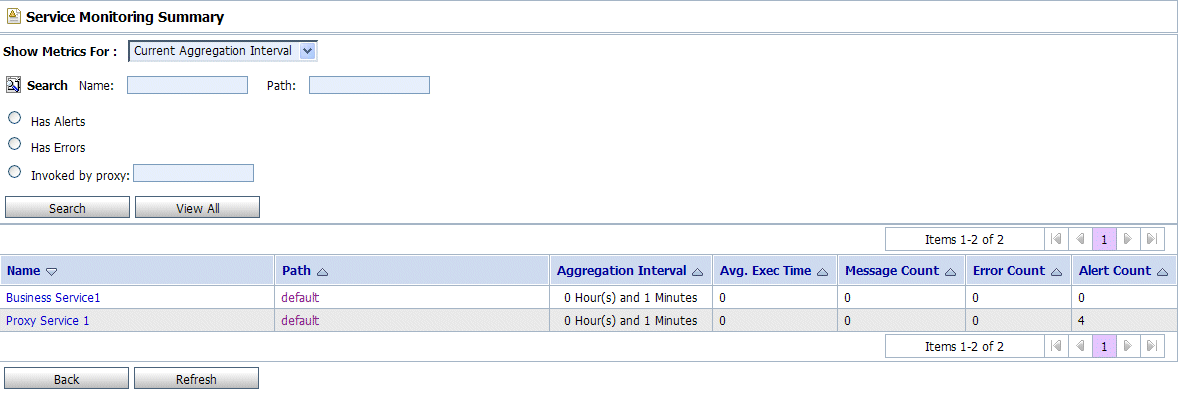
The Service Monitoring Summary page provides two views of service monitoring statistics, as shown in the following figures.
The first view is a moving statistic of the data collected by each service. This view is available when you select Current Aggregation Interval in the Show Metrics For field. The aggregation interval shown in the Aggregation Interval column determines the statistics that are displayed. For example, if the aggregation interval of a particular service is 20 minutes, that service's row displays the data collected in the last 20 minutes.
Figure 5-5 Service Monitoring Summary Page—Current Aggregation Interval
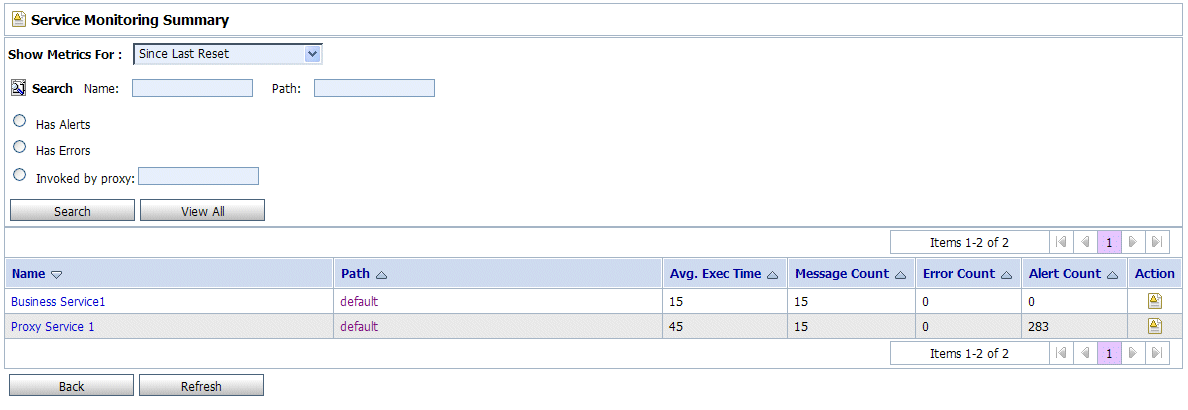
The second view is a running count of the metrics. This view is available when you select Since Last Reset in the Show Metrics For field. The statistics displayed in each row are for the period since you last reset statistics for an individual service or since you last reset statistics for all services on the Global Settings page in the System Administration module.
Figure 5-6 Service Monitoring Summary Page—Since Last Reset
As shown in the top section of the preceding figures, you can filter the display of information using the following criteria:
- Name—the name of the proxy service or business service.
- Path—the project folder in which the proxy service or business service resides.
- Has Alerts—by services that have alert messages.
- Has Errors—by services that have failed messages.
- Invoked by proxy—the name and path of the proxy service.
The Service Monitoring Summary table displays the following information:
- Name—the name of the proxy or business service. The name is a link to the Service Monitoring Details page. See Service Monitoring Details.
- Path—the project folder in which the service resides. The path is a link to the Project View or Folder View page, depending on whether the service resides in the top level of a project or in a folder.
- Aggregation Interval—the time period over which data points for specific statistics are collected and then displayed for the service. This information is displayed only when you have selected Current Aggregation Interval in the Show Metrics For field.
- Average Execution Time—the average time it has taken the service to process a message for the period of the current aggregation interval or for the period since the last reset.
- Message Count—the total number of messages processed by the service for the period of the current aggregation interval or for the period since the last reset.
- Error Count—the number or messages that have failed for the period of the current aggregation interval or for the period since the last reset.
- Alert Counts—the number of alerts raised by alert rule occurrences and violations for the period of the current aggregation interval or for the period since the last reset.
Note: An Action column is displayed when you have selected Since Last Reset in the Show Metrics For field. In this column, you can click the Reset Statistics icon for a specific service to reset the statistics for that service. When you confirm you want to do this, the system deletes all monitoring statistics that were collected for the service since the last time you clicked the Reset Statistics icon or the last time you clicked Reset Statistics on the Global Settings page. However, the system does not delete the statistics being collected during the Current Aggregation Interval for the service. Additionally, after you click the Reset Statistics icon, the system immediately starts collecting monitoring statistics for the service again.
Service Monitoring Details
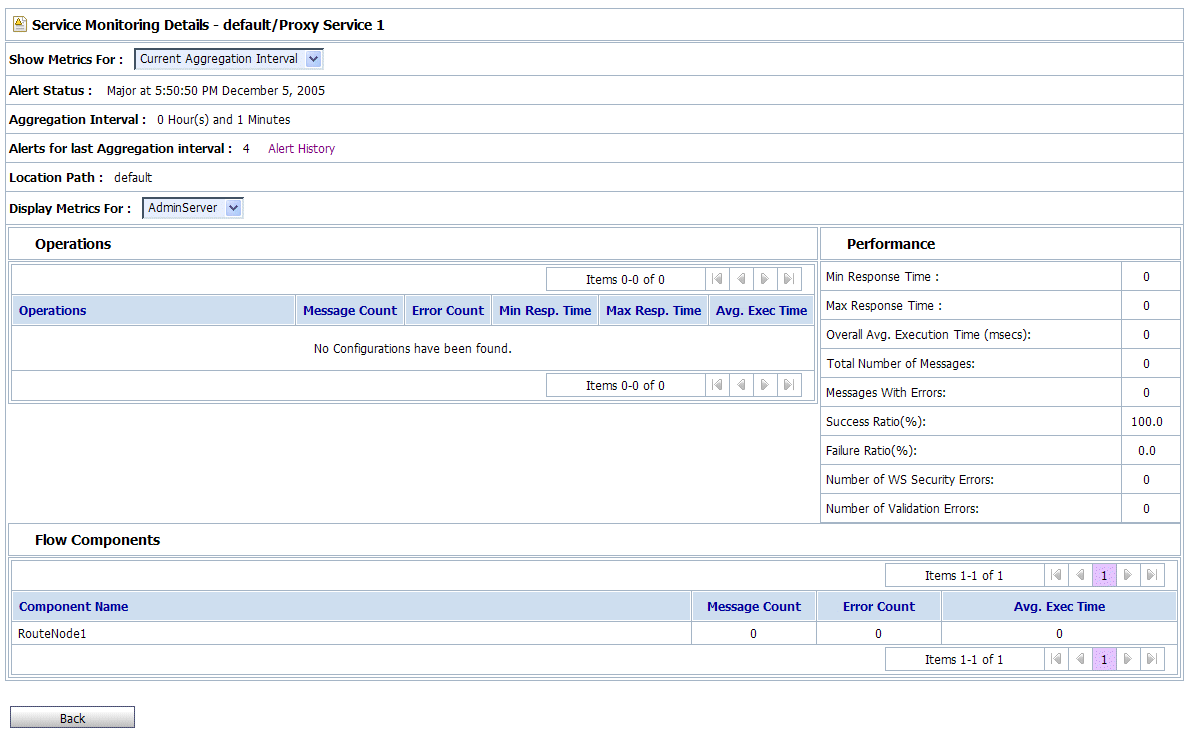
The Service Monitoring Details page provides you with two views of detailed information about a specific service, as shown in the following figures.
The first view is a moving statistic of the data collected by the service. This view is available when you select Current Aggregation Interval in the Show Metrics For field. The aggregation interval shown in the Aggregation Interval column determines the statistics that are displayed. For example, if the aggregation interval of this service is 20 minutes, the view displays the data collected in the last 20 minutes.
Figure 5-7 Service Monitoring Details Page—Current Aggregation Interval
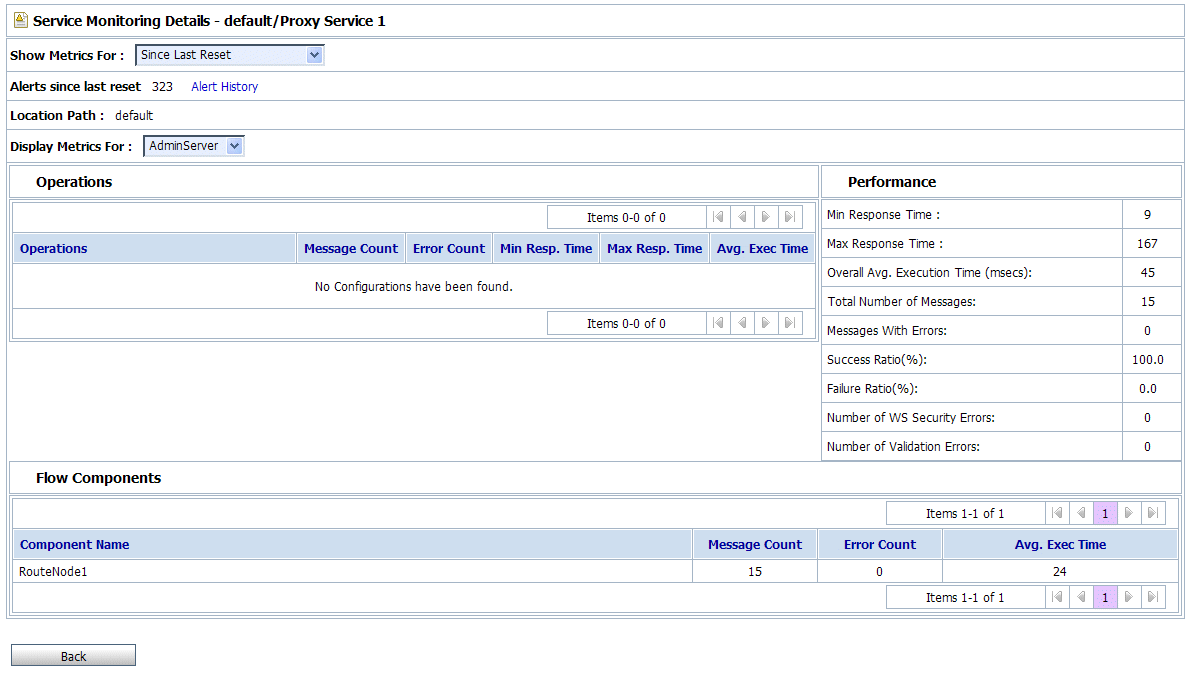
The second view is a running count of the metrics. This view is available when you select Since Last Reset in the Show Metrics For field. The statistics displayed are for the period since you last reset statistics for this particular service or since you last reset statistics for all services on the Global Settings page in the System Administration module.
Figure 5-8 Service Monitoring Details Page—Since Last Reset
The displayed details have the following definitions:
- Service Monitoring Details
- Alert Status—the current alert status, which is displayed only when you have selected Current Aggregation Interval in the Show Metrics For field.
- Aggregation Interval—the time period over which data points for specific statistics are collected and then displayed for the service. This information is displayed only when you have selected Current Aggregation Interval in the Show Metrics For field.
- Alerts for last Aggregation Interval—the total number of alerts associated with this service within the last aggregation interval. This information is displayed only when you have selected Current Aggregation Interval in the Show Metrics For field.
- Alerts since last reset—the total number of alerts associated with this service since you last reset statistics for the service or since you last reset statistics for all services on the Global Settings page. This information is displayed only when you have selected Since Last Reset in the Show Metrics For field.
- Alert History—a link to the Customized System Alerts History page. See System Alerts History.
- Location Path—the project and folder where the service resides.
- Display Metrics For—displays the metrics for a server. For a single node, only one item is displayed.
- Operations
- Operations—the operations associated with the service, if any exist.
- Message Count—the number of messages associated with each operation within the period of the current aggregation interval or within the period since the last reset.
- Minimum Response Time—the minimum time this operation has taken to execute messsages within the period of the current aggregation interval or within the period since the last reset.
- Maximum Response Time—the maximum time this operation has taken to execute messsages within the period of the current aggregation interval or within the period since the last reset.
- Average Execution Time—the average time the operation has taken to execute messages within the period of the current aggregation interval or within the period since the last reset.
- Performance
- Minimum Response Time—the minimum time this service has taken to execute messsages within the period of the current aggregation interval or within the period since the last reset.
- Maximum Response Time—the maximum time this service has taken to execute messsages within the period of the current aggregation interval or within the period since the last reset.
- Overall Average Execution Time—the overall average time that the service has taken to execute messages within the period of the current aggregation interval or within the period since the last reset.
- Total Number of Messages—the total number of messages, including failed messages, within the period of the current aggregation interval or within the period since the last reset.
- Messages With Errors—the number of messages that failed within the period of the current aggregation interval or within the period since the last reset. In two-way messaging, if the response message fails, but the request message was processed, only the failed response message is counted.
- Failover Count—for business services only, the number of failover messages within the period of the current aggregation interval or within the period since the last reset.
- Success Ratio—the percentage of successfully processed messages within the period of the current aggregation interval or within the period since the last reset.
- Failure Ratio—the percentage of messages that failed to process within the period of the current aggregation interval or within the period since the last reset.
- Security—the number of messages that failed due to security reasons, such as authentication errors, security policy violations, or authorization errors, within the period of the current aggregation interval or within the period since the last reset.
- Validation—the number of messages that failed when a validate action compared one or more parts of a message against an XSD schema or WSDL resource, within the period of the current aggregation interval or within the period since the last reset. Displays for proxy services only.
- Flow Components for proxy services
- Component Name—the name of pipeline or node in the message flow.
- Message Count—the number of messages associated with each component within the period of the current aggregation interval or within the period since the last reset.
- Error Count—the number of failed messages associated with each component within the period of the current aggregation interval or within the period since the last reset.
- Average Execution Time—the average time the component has taken to execute a message within the period of the current aggregation interval or within the period since the last reset.
Server Summary
This section contains information on the following topics:
About the Server Summary
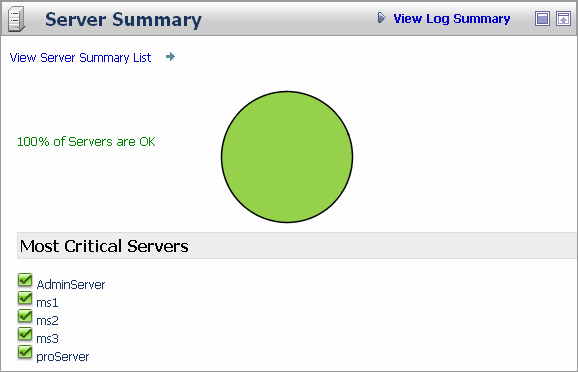
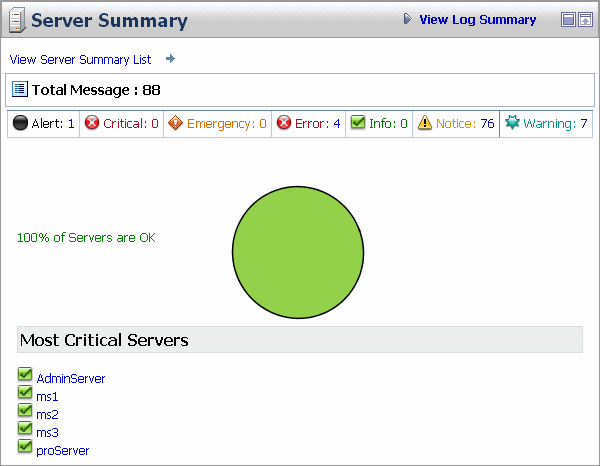
The Server Summary panel provides an overview of the state of the servers. The pie chart shows the status of each server in the domain. The status for each server is derived from the WebLogic Diagnostic Service (see Configuring and Using the WebLogic Diagnostics Framework.). The ten most critical servers are displayed, as shown in Figure 5-9.
Figure 5-9 Server Summary Pane
The displayed statuses have the following meanings:
- Fatal—the server has failed and must be restarted.
- Critical—server failure pending; something must be done immediately to prevent failure. For more details, check the server logs and the corresponding
RuntimeMBean. - Warning—the server could have problems in the future. For more details, check the server logs and the corresponding
RuntimeMBean. - Ok—the server is functioning without any problems.
- Overloaded—the server has more work assigned to it than the configured threshold; it might refuse more work.
Log Summary
The AquaLogic Service Bus Console allows you to view the WebLogic Server domain log. The domain log file provides a central location from which to view the overall status of the domain. Each server instance forwards a subset of its messages to a domain-wide log file. By default, servers forward only messages of severity level NOTICE or higher. You can modify the set of messages that are forwarded. For more information, see Understanding WebLogic Logging Services in Configuring Log Files and Filtering Log Messages.
If you configure the logging action in a pipeline, the log is forwarded to the server log. Unless you configure WebLogic Server to forward these messages to the domain log, you cannot view this log from AquaLogic Service Bus Console. For information in how to do this, see Create Log Filters in the WebLogic Server Administration Console Online Help.
To see the number of messages currently raised by the system, click the View Log Summary link in the Server Summary panel. A table is displayed that contains the number of messages grouped by severity, as shown in the following figure.
The displayed message statuses have the following meanings:
- Alert—a particular service is in an unusable state while other parts of the system continue to function. Automatic recovery is not possible; the immediate attention of the administrator is needed to resolve the problem.
- Critical—a system or service error has occurred. The system can recover but there might be a momentary loss or permanent degradation of service.
- Emergency—the server is in an unusable state. This severity indicates a severe system failure.
- Error—a user error has occurred. The system or application can handle the error with no interruption. Limited degradation of service may occur.
- Info—reports normal operations; a low-level informational message.
- Notice—an informational message with a higher level of importance than Info messages.
- Warning—a suspicious operation or configuration has occurred. However, normal operations may not be affected.
This display is based on the health state of the running servers, as defined by the WebLogic Diagnostic Service. For more information about the WebLogic Diagnostic Service, see Configuring and Using the WebLogic Diagnostics Framework.
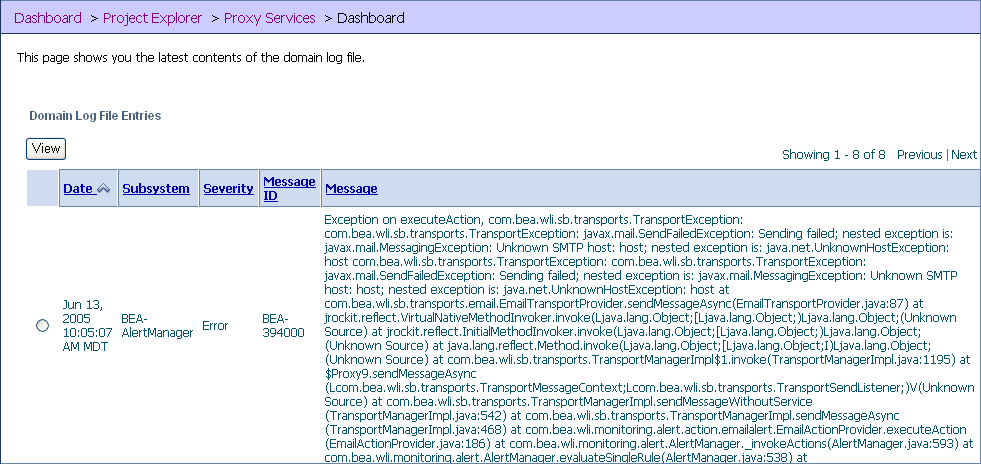
To view the domain log for a particular type of message, click the number corresponding with the type of message. The following figure shows an example of a domain log file displayed in the AquaLogic Service Bus Console.
Figure 5-11 Domain Log File Entries
The following information is displayed:
- Date—the date and time the entry was logged in a format that is specific to the local time zone and format.
- Subsystem—the WebLogic Server subsystem that was the source of the message, such as the EJB container or Java Messaging Service.
- Severity—indicates the degree of impact or seriousness of the event.
- Message ID—the unique six-digit identification for the message.
- Message—a description of the event or condition.
For more information, see "Message Attributes" in Understanding WebLogic Logging Services in Configuring Log Files and Filtering Log Messages.
To display details of a single log file on the page, select the radio button for the appropriate log, then click the View button.
Server Summary
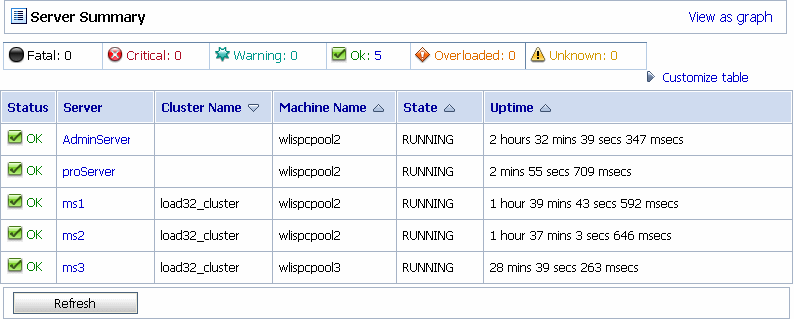
The Server Summary page provides a customizable table of servers, as shown in the following figure.
Figure 5-12 Server Summary Page
As shown in the top section of the preceding figure, the Server Summary Page displays the number of messages currently raised by the system. For information about the meaning of each type of status message, see Log Summary.
The server table displays the following information:
- Status—the status of the server:
- Fatal—the server has failed and must be restarted.
- Critical—server failure pending; something must be done immediately to prevent failure. For more details, check the server logs and the corresponding
RuntimeMBean. - Warning—the server could have problems in the future. For more details, check the server logs and the corresponding
RuntimeMBean. - OK—the server is functioning without any problems.
- Overloaded—the server has more work assigned to it than its configured threshold; it might refuse more work.
- Server—the name of the server. The name is a link to the View Server Details page. See Server Details.
- Cluster Name—if the server is associated with a cluster, the name of the cluster.
- Machine Name—the name of the computer associated with the server.
- State—the state of the server:
- Uptime—the length of time this server has been running.
To view this information in the table as a pie or bar chart, click View as a Graph.
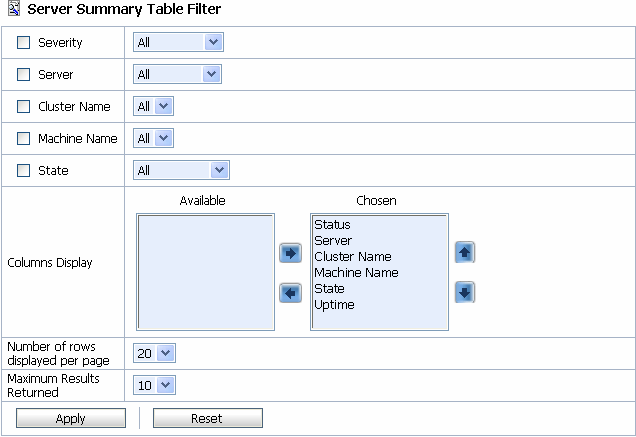
To filter the display of servers, click Customize Table above the server table. The available filtering is shown in the following figure.
Figure 5-13 Server Summary Table Filter
For information about how to use the Server Summary Table Filter, see "Customize Your View of the Server Summary" in Monitoring in the Using the AquaLogic Service Bus Console.
Server Details
You can access the View Server Details page by clicking the name of a server under Most Critical Servers or by clicking the name of a server in the Servers Summary page.
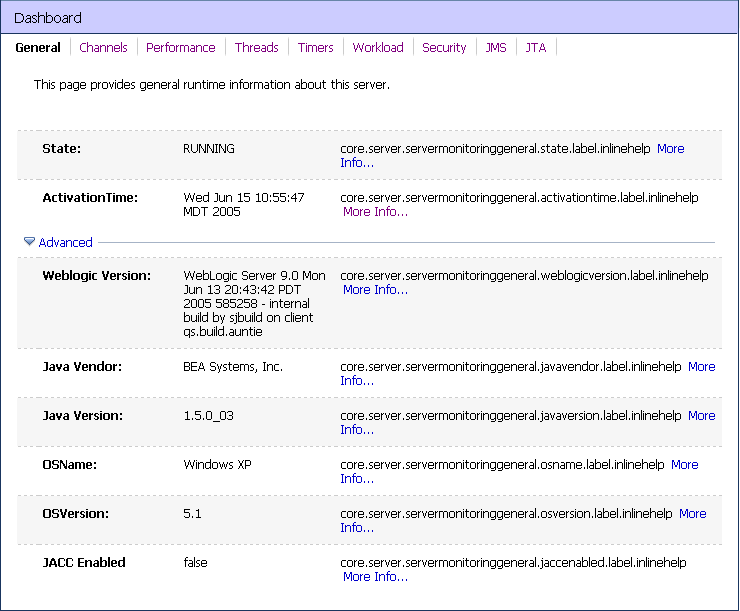
The View Server Details page enables you to view more server monitoring details, as shown in the following figure.
Figure 5-14 Server Details Page—General Tab
The information displayed on this page is a subset of the Monitoring tab in the AquaLogic Service Bus Console Server Settings page. The details available are:
- General—provides general run-time information about the server. Click Advanced to display more information, such as WebLogic Server version or operating system name.
- Channels—displays monitoring information about each channel.
- Performance—displays performance information about the server.
- Threads—displays current run-time characteristics and statistics for the server's active executable queues.
- Timers—displays information about the timer in use by the server.
- Workload—displays statistics for work managers, constraints, and policies configured for the server.
- Security—allows you to monitor user-lockout management statistics for the server.
- JMS—allows you to monitor JMS information about the server.
- JTA—displays the summary of all transaction information for all resource types on the server.
For more information, see the WebLogic Server Administration Console Online Help.
Alert Summary
This section contains information on the following topics:
About the Alert Summary
The Alert Summary panel contains a customizable table displaying information about violations or occurrences of events in the system. These violations and occurrences are based on SLAs. AquaLogic Service Bus provides various SLA monitors that you can configure to monitor proxy and business services. Some examples of SLA monitors are maximum execution time and authorization failure. You configure these monitors by creating alert rules. When a rule evaluates to true, it raises an alert. Additionally, you configure an alert rule to send an email or post a message on a JMS queue or topic.
Note: When you configure an alert rule to post a message to a JMS destination, you must create a JMS connection factory and a queue or topic, and target them to the appropriate JMS server in the WebLogic Server Administration Console. For information on how to do this, see "Configuring a JMS Connection Factory" and "JMS Resource Naming Rules for Domain Interoperability" in Configuring JMS System Resources in Configuring and Managing WebLogic JMS.
The AquaLogic Service Bus Console provides several ways to view and find alerts, such as by severity and by service. You can also view alerts graphically. For information on how to do this, see "Listing and Locating Alerts" and "Viewing a Chart of Alerts" in Monitoring in the Using the AquaLogic Service Bus Console.
The following figure shows the Alert Summary panel:
Figure 5-15 Alert Summary Panel
The Alert Summary panel shows alerts for the last 30 minutes. It contains the following types of information:
- Alert Severity—the user-defined severity of the alert. The Severity is a link to the Alert Details page. See System Alert Details.
- Timestamp—the date and time that the alert occurred.
- Alert Rule Name—the name assigned to the alert. The name is a link to the View Alert Rule Details page. See View Alert Rule Details.
- Service/Project Name—the name of the service and project associated with the alert. The name is a link to the Service Monitoring Details page. See Service Monitoring Details.
To view a complete list of alerts, click View Alert Summary List. See System Alerts History.
To customize the information displayed in the Alert Summary Panel, click Customize table above the summary table. The available filtering is shown in the following figure.
Figure 5-16 Alert Summary Table Filter
System Alerts History
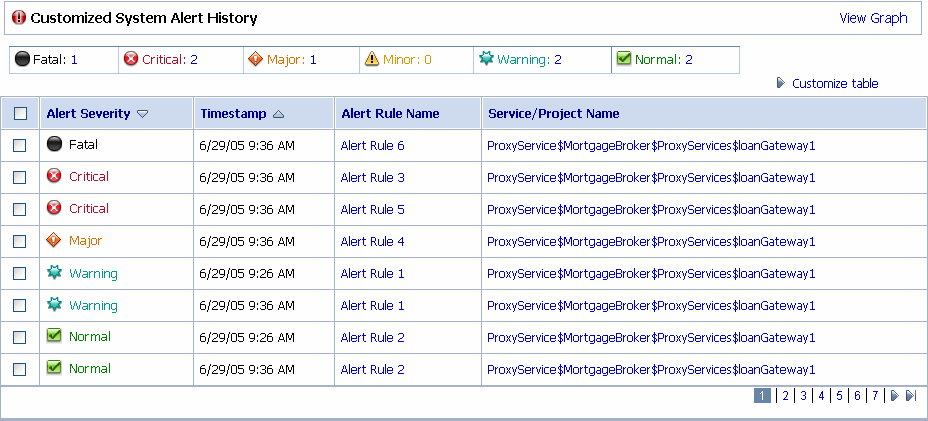
To access the Customized System Alerts History page, in the Alert Summary panel, click View Alert Summary List. The Customized System Alerts History page enables you to view all the alerts by paging through the table (Figure 5-17) or by filtering the display of the alerts (Figure 5-18).
Figure 5-17 Customized System Alerts History
The table shown in the preceding figure is customizable and provides the following information:
- Alert Severity—the severity level of alerts is user configurable and has no absolute meaning. The field is a link to the System Alert Details page. See System Alert Details.
- Timestamp—the date and time that the alert occurred.
- Alert Rule Name—the name assigned to the alert. The name is a link to the View Alert Rule Details page. See View Alert Rule Details.
- Service/Project Name—the name of the service and project associated with the alert. The name is a link to the Service Monitoring Details page. See Service Monitoring Details.
To view a pie or bar chart of the alerts, click View Graph in the table.
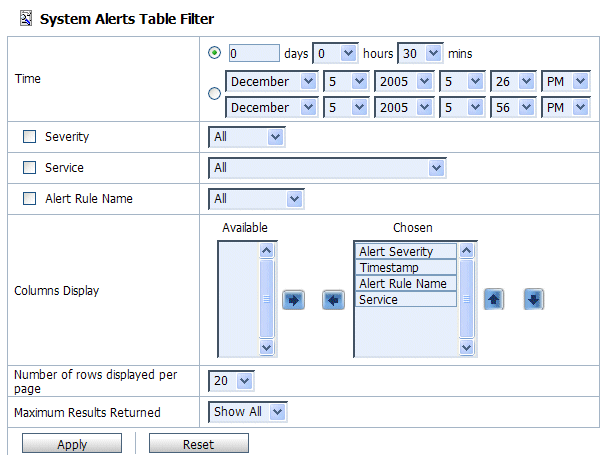
To search for a specific alert, you can filter the display of alerts by clicking Customize Table in the Customized System Alerts History table. The available filtering is shown in the following figure.
Figure 5-18 System Alerts Table Filter
For information about how to use the Alerts Table Filter, see "Customizing Your View of Alerts" in Monitoring in the Using the AquaLogic Service Bus Console.
Note: When an alert is fired in your configuration, a message is sent to your domain log, which resides at the following location:
[BEA_home\servers\<server_name>\logs\<domain_name>.log
Where domain_name represents the name you assigned your AquaLogic Service Bus domain when you created it.
The message is logged as an alert and has this message ID: BEA-394015
The message body is a string that consists of the following elements:
System Alert Details
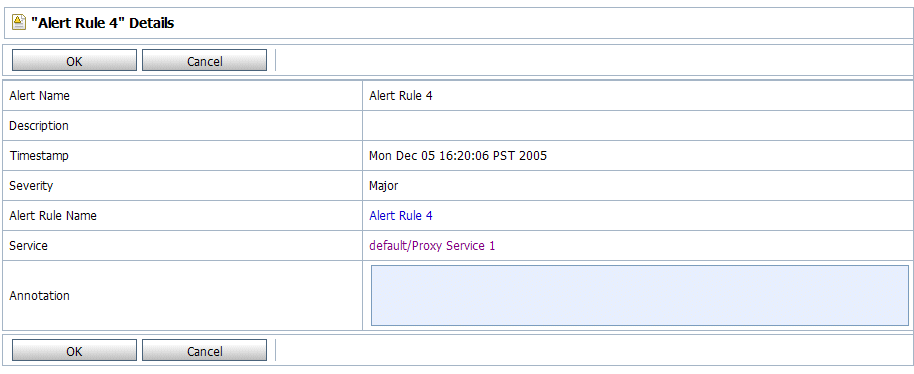
The System Alert Details page displays complete information about the alert and allows you to add an annotation to the alert, as shown in the following figure.
The following information is displayed:
- Alert Name—the name assigned to the alert.
- Description—a description of the alert.
- Timestamp—the date and time the alert occurred.
- Severity—the user-defined severity of the alert.
- Alert Rule Name—the name of the alert rule. The name is a link to the View Alert Rule Details page. See View Alert Rule Details.
- Service—the name of the service associated with the alert. The name is a link to the Service Monitoring Details page. See Service Monitoring Details.
- Annotation—use this field to add notes to the alert.
You access this page from the Dashboard by clicking Alert Severity in the Alert Summary table. This page also allows you to delete the alert.
View Alert Rule Details
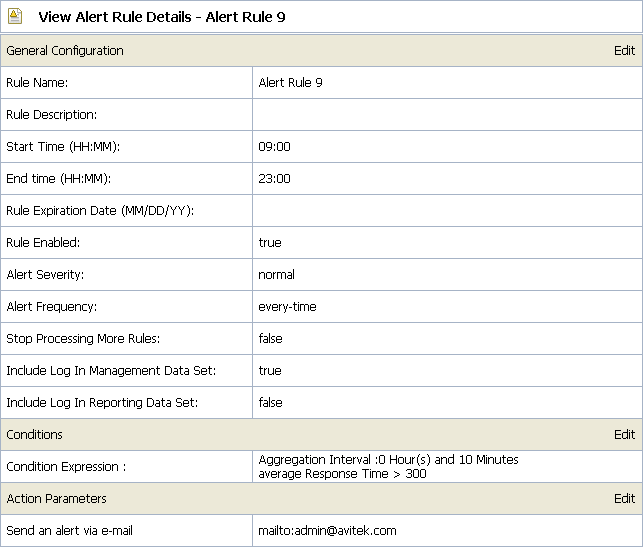
The View Alert Rule Details page displays complete information about a specific alert rule, as shown in the following figure.
Figure 5-20 View Alert Rule Details Page
The following information is displayed:
- General Configuration
- Rule Name—the name assigned to the alert rule.
- Description—a description of the rule.
- Start Time (HH:MM)—specifies the starting time during which the rule is active on each day prior to the expiration date.
- End Time (HH:MM)—specifies the ending time during which the rule is active on each day prior to the expiration date.
- Rule Expiration Date (MM/DD/YY)—the expiration date of the rule. The rule expires at 12.01am on the specified date. If you do not specify a date, the rule never expires.
- Rule Enabled—indicates whether the rule is enabled or not.
- Alert Severity—the user-defined severity of the alert.
- Alert Frequency—indicates whether the actions (email or JMS destination) designated in the alert rule are executed every time the alert rule evaluates to true or are executed the first time the rule evaluates to true.
- Stop Processing More Rules—when multiple rules associated with a service exist, this flag indicates whether subsequent rules associated with the service must be evaluated if the current rule evaluates to true.
- Include Log in Management Data Set—indicates whether a log of the alert is included in the management data set. These alert logs are visible on the Dashboard in the Alert Summary table.
- Include Log in Reporting Data Set—indicates whether a log of the alert is included in the reporting data set. Viewing the reporting data set requires developing a Reporting Provider to fetch and display these logs. For more information, see Reporting Framework.
- Conditions
- Action Parameters
For information about how to define alert rules, see "Create an Alert Rule" in Monitoring in the Using the AquaLogic Service Bus Console.
Alert Rules
This section includes information on the following topics:
About Alert Rules
As mentioned earlier, alerts are automated responses to SLAs violations or occurrences, which are displayed on the Dashboard. You define alert rules to specify unacceptable service performance according to your business and performance requirements. Each alert rule allows you to specify the aggregation interval for that rule when configuring the alert rule. The alert aggregation interval is not affected by the aggregation interval set for the service.
Rules are executed once every aggregation interval. On the Alert Rule page, if you set the Alert Frequency to Every Time, the rule's actions are executed every time the alert rule evaluates to true. If you set the Alert Frequency to Once Until Conditions Clear, the rule's actions are executed the first time the rule evaluates to true, and no more alerts are generated until the condition resets itself and evaluates to true again.
In the case where the Alert Frequency is set to Every Time, the number of times an alert rule is fired depends on the aggregation interval and the sample interval associated with that rule. For example, if the aggregation interval is set to 5 minutes, the sample interval is 1 minute. Rules are evaluated each time 5 samples of data are available. Therefore, the rule is evaluated for the first time approximately 5 minutes after it is created and every minute thereafter.
In the case where the Alert Frequency is set to Once Until Conditions Clear, after an alert is fired the first time in an aggregation interval, it is not fired again in the same aggregation interval.
Creating an alert rule involves three parts:
- General Configuration—defines the name, duration, severity, frequency, logging, and other general behavior.
- Define Conditions—defines one or more conditions that trigger the alert rule. Additionally, you defined the aggregation interval for the condition on this page.
- Define Actions—defines whether to use an email or JMS message for notification that the rule was triggered.
Note: Rules can only be created for services that are enabled for monitoring.
Detailed information about creating an alert rule is located in "Create an Alert Rule" in Monitoring in the Using the AquaLogic Service Bus Console.
Some Uses for Alerts
The following are some uses for alerts:
- Monitoring and email notification of WS-Security errors.
- Monitoring the number of messages passing through a particular pipeline.
- Email notification when the average execution time exceeds 5 seconds during stock exchange hours.
Understanding Alert Rules
The information in this section is presented in question-answer format.
Question 1: I created a service with an alert rule that has the following condition expression:
Aggregation Interval: 0 Hours(s) and 1 Minutes
Message Count = 0
It's been 10 minutes and I have not received any alerts.
Answer: Monitoring statistic collection for each statistical attribute, such as message count and error count, associated with a service begins when a change in the value of that statistic occurs. Data collection for the Message Count attributes begins when the first message is processed by the service and the Message Count attribute is incremented. Similarly, collection of data for the Error Count statistic starts only when the service encounters its first error and the Error Count attribute is incremented. If the service is idle, no monitoring information is collected for that service and subsequently no alert rules are triggered. After the first message is processed, monitoring data for that service is continually collected even if the service does not receive any further requests. Check to see if the service has received any requests.
Question 2: I defined a new alert rule with an aggregation interval that did not exist before and that rule does not seem to fire at all. All other rules created prior to this one are working correctly.
Answer: The cause is the same as in Question 1; the service needs to process at least one request after a rule with a new aggregation interval is created to trigger the alert rule. The other rules defined with different aggregation interval values are not affected by the alert rule.
Question 3: I restarted the server and none of my services have processed any requests. Why do I see alerts being generated?
Answer: Once the Monitoring subsystem has started collecting data for services, killing and restarting a server does not abort the collection process. The data collected is persisted and statistic collection picks up from where it left off.
Question 4: I have an alert rule with the following definition:
Aggregation Interval: 0 Hours(s) and 5 Minutes
Success Rate < 80%
The Service Monitoring Summary page shows the following values:
Why am I being alerted in this case? Shouldn't the success rate be 80% in this case?
Answer: No, the message count value displayed is the total of all messages processed by the service, including the ones that generated an error. Subsequently, in this case, the success rate is 75%.
Question 5: I created a service with an aggregation interval of 10 minutes that sends a JMS message. I could see the message on the Service Monitoring Summary page, but some time later the message count for my service shows as zero.
Answer: The Service Monitoring Summary page displays a moving statistic. In this case, it shows the message count in the last 10 minutes. Because no messages were processed by the system in the last 10 minutes, the message count is displayed as zero.
Question 6: I changed the aggregation interval of a service from 10 minutes to 5 minutes. The Service Monitoring Summary page shows all statistics as zero. One of the alerts in this server was configured to a statistical element with a 2 minute aggregation interval, which did not fire the next minute.
Answer: Changing the aggregation interval for a service removes the statistical information for all the services and alerts associated with that service. The alert initializes again and fires after the next aggregation interval expiry.
Question 7: I have a business service with multiple endpoints with an alert rule defined as Failover-count > 0. When one of the endpoints goes down, the alert is triggered. However, when a service has only one endpoint, the Failover-count is not incremented for this service. Instead, an error is generated.
Answer: Set the Retry count to a number greater than zero. For information about setting the Retry count, see "Adding a Business Service" in Business Services in the Using the AquaLogic Service Bus Console.
Question 8: I see that an alert is generated on the Dashboard but the value for the Alerts for last Aggregation Interval field on the Service Monitoring Details page displays zero.
Answer: Alert rules are evaluated after the completion of the interval, which happens after a checkpoint completion. If a rule evaluates to true, the rule's actions are triggered, a log is generated, and the interval-count statistic attribute (Alerts for Last Aggregation Interval) is incremented. The updated value of this counter is processed in the next checkpoint, 60 seconds later. The Monitoring Details page displays the updated count approximately one minute after the alert is generated.
Question 9: How does the active time for rules that span midnight work?
Answer: Consider the case where the active time for a rule is specified as 22:00 to 09:00.
On a given date, say June 7, the rule will be active and inactive as follows:
The Collector sends ServerStatistics to the aggregator. The ServerStatistics represents the monitoring runtime data for that minute. In other words, it contains the statistics information for the services that have been enabled.
Every minute the aggregator aggregates the data received from the collector, and makes it available for the retriever sub system. The aggregator thread is skewed by 15 sec wrt to the collector checkpoint thread.
If you disable monitoring for the domain, you disable the statistics collection and the checkpointing process. The Collector no longer sends ServerStatistics to the aggregator server and the aggregator server does not have any aggregated data from the next minute, which means there is no data returned if you attempt to retrieve it. The same applies when you enable monitoring for the domain. The system initially does not show any data. However, after a maximum of two minutes, the aggregator has data and the Service Summary page displays this data.
As documented, disabling monitoring for the domain disables the statistics collection and the checkpointing process; that is, it no longer sends serverStatistics to the aggregation server and the aggregator server does not have any aggregated data from the next minute, which means when the user tries to retrieve the data it returns no configurations.
The same applies when one enables the domain monitoring , the system initially does not show any data and after a maximum of two minutes the aggregator would have data and service summary displays the same.
