


|
BEA AquaLogic Service Bus delivers message data and alerts to one or more reporting providers. Message data can be captured from the body of the message and from other variables associated with the message, such as header or inbound variables. Alert data contains information about Service Level Agreement (SLA) violations that you can configure to monitor proxy services. You can use the message or alert data delivered to the reporting provider for functions such as tracking messages or regulatory auditing.
AquaLogic Service Bus includes a JMS Reporting Provider for message reporting. The Reporting module in the AquaLogic Service Bus Console displays the information captured from this reporting provider. If you do not wish to use the JMS Reporting Provider that is provided with your AquaLogic Service Bus installation, you can untarget it and create your own reporting provider using the Reporting Service Provider Interface (SPI). If you configure your own reporting provider for messages, no information is displayed in the AquaLogic Service Bus Console and you will need to create your own user interface. If you wish to capture SLA data, you will need to create a reporting provider for alerts.
This chapter contains information on the following topics
The following scenarios describe some of the ways in which you can use AquaLogic Service Bus to track messages:
In the AquaLogic Service Bus Console, when you filter messages to display the Post-Trade Processing proxy service. When you drill down into some of the messages, you discover that the pipeline errors are due to message transformation errors and that the mangled messages are coming out of the portal associated with the proxy service. To solve the problem, a you can add a new transformation to the pipeline for all messages originating from that portal site.
Customer Service calls Operations with a complaint that the customer who submitted a trade did not receive a trade confirmation. You can log into the AquaLogic Service Bus Console and search for the trade number. The search shows that two messages were processed in the request pipelines, but no response messages. You can ask Customer Service to contact the customer and assure the customer that the trade was successfully processed.
At the end of the month, the Mortgage Processing team must provide their compliance department with information about the mortgages they have processed. To fulfill this requirement, the Application Development team updates the applicable proxy service pipelines to capture the relevant message information. Specifically, data is extracted from the messages for the customer ID and name, mortgage ID, mortgage amount, property address, and the date the loan application was submitted.
By configuring a reporting provider for alerts, you can receive an alert notification outside of the AquaLogic Service Bus Console and process the alert according to your business needs. For example, you could develop an alert reporting provider that utilizes the reporting stream for alerts and then display the alerts on a custom console, such as HP OpenView, or Tivoli.
AquaLogic Service Bus contains an extensible framework for creating one or more reporting providers for messages or alerts.
To enable message reporting you must first create a Report action in the message flow for the proxy service. The Report action allows you to extract information from each message and write it to the AquaLogic Service Bus Reporting Data Stream. You do not need to configure a report action for alert reporting. Alert data is always available in the Reporting Data Stream. For more information, see How to Enable Message Reporting.
All the information you need in order to create your own reporting provider is located in com.bea.wli.reporting in the
Javadoc for AquaLogic Service Bus. The Javadoc provides information about what you need to do to implement a reporting provider, including how to package it, where it goes, how to deploy it, and the order of deployment. The location of the reporting schema (MessageReporting.xsd) is <BEA_HOME>/weblogic92/servicebus/lib/sb-schemas.jar, where BEA_HOME is the directory in which you installed BEA products.
The following figure shows the reporting framework.
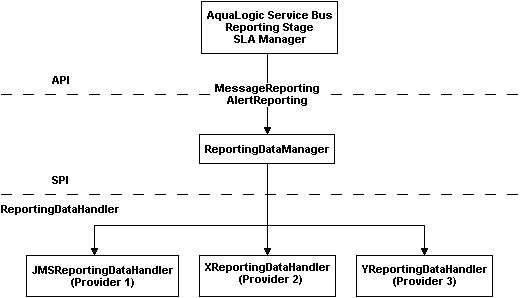
As shown in the Figure 5-1, both report messages and alerts are exported to reporting data streams. In the Report stage, information is extracted by the Report action from each message and written to the Reporting Data Stream with metadata that adheres to MessageReporting.xsd. Similarly, the SLA Manager uses Reporting Data Manager APIs to write to the Alert Reporting Stream with metadata that adheres to the AlertReporting.xsd. If you want to develop a reporting provider for alerts or your own message reporting provider, you need to implement an interface called ReportingDataHandler and use ReportingDataManager class.
The ReportingDataHandler interface takes the reporting or alert data stream and processes it. It can either process or store, or both this stream in a relational database, file, JMS queue, and so on. Depending on which stream you want to use, you need to implement the appropriate handle methods to process the data stream:
handle methods to write to the Message Reporting Stream: handle(com.bea.xml.XmlObject metadata, String s)
handle(com.bea.xml.XmlObject metadata, com.bea.xml.XmlObject data)
handle method to write to the Alert Reporting Stream: handle(com.bea.xml.XmlObject metadata, com.bea.xml.XmlObject data)
The ReportingDataManager is a server-local object that keeps a registry of reporting providers. Reporting providers implement the ReportingDataHandler interface. The ReportingDataManager provides operations to do the following:
The JMS Reporting Provider provides a pluggable architecture to capture the reporting information from each message via a Report action. All messages across the cluster are aggregated and stored in the JMS Reporting Provider Data Store in a database specific format. When you use the JMS Reporting Provider, which is provided with AquaLogic Service Bus installation the Reporting module in the AquaLogic Service Bus Console displays information from the JMS Reporting Provider Data Store.
| Note: | The JMS Reporting Provider is automatically configured when you create an AquaLogic Service Bus domain. If you do not wish to use this reporting provider, you must untarget it. For more information, see Removing, Stopping, or Untargeting a Reporting Provider. |
This section contains information on the following topics:
The JMS Reporting Provider consists of a producer and a consumer, which are decoupled to improve scalability. The producer is a JMS producer and the Message Driven Bean (MDB) acts as the JMS consumer, as shown in the following diagram.
The Reporting stage contains the Report actions that collect the reporting information and dispatch the reporting stream to JMS Reporting Provider through various handle operations in the ReportingDataManager. The JMSReportingDataHandler is the JMS producer of the reporting provider. The JMSReportingDataHandler takes the reporting stream and logs the information to a JMS queue. The MDB listens to the JMS reporting queue, which processes the message asynchronously and stores the data in the JMS Reporting Provider Data Store.
To receive report messages from either the JMS Reporting Provider, which is provided with AquaLogic Service Bus installation, or your reporting provider, you must first create a Report action in the message flow for the proxy service. The Report action allows you to extract information from each message and write it to the AquaLogic Service Bus Reporting Data Stream. In the Report action, you must specify the information you want to extract from the message and add to the AquaLogic Service Bus Reporting Data Stream.
You do not need to configure a report action for alert reporting. Alert data is always available in the Reporting Data Stream.
When configuring a Report action, you use key values to extract key identifiers from the message. You can configure multiple keys. Information can be captured not only from the body of the message but any other variable associated with the message, such as header or inbound variables. For more information about message variables, see Message Context in Using the AquaLogic Service Bus Console.
You can use any XML elements as a key:
<?xml version="1.0" encoding="utf-8"?>
    <poIncoming>
     <areacode>408</areacode>
     <item-quantity>100</item-quantity>
     <item-code>ABC</item-code>
     <item-description>Medicine</item-description>
    </poIncoming>
For example, you can specify the key as the itemcode, the value as .//item-code (an XPath expression), and the variable as message body (body), as shown in the following figure.

If you are using the JMS Reporting Provider, which is provided with AquaLogic Service Bus installation, the keys and associated values are displayed in the Report Index column of the Summary of Messages table. If you configure multiple keys, the key-value pairs are displayed in Report Index Column with each key-value separated by a semicolon, as shown in Figure 5-4.

For information on how to create a Report action or on how to view the Summary of Messages page, see the following in Using the AquaLogic Service Bus Console:
The reporting module in the AquaLogic Service Bus Console displays the information collected by the JMS Reporting Provider Data Store. The first page of the Reporting module, called the Summary of Messages, displays a table containing the extracted information and other information, such as the time the message was written to the database and the service with which the message is associated. You can customize the display of information on this page by filtering and sorting the data. You can also drill down to view detailed information about specific messages, including error information.
The Reporting module provides a purge function to help you manage your message data. You can purge all of the messages from the reporting datastore or base the purge on a time-range.
The JMS Reporting Provider Data Store requires a database. An evaluation version of the PointBase database is installed with WebLogic Server. You can use PointBase for a development environment but not for production. AquaLogic Service Bus also supports databases from other vendors. Be sure to apply standard database administration practices to the database hosting the JMS Reporting Provider Data Store. For more information, see Configuring a Database for the JMS Reporting Provider Store.
For more information on how to use the reporting module is located in the Using the AquaLogic Service Bus Console.
This section includes information on the following topics:
When you click Reporting in the navigation panel, the Summary of Messages page is displayed. This page contains a table that provides a list of report messages sorted by the database timestamp.

If the messages are not filtered, the Summary of Messages table displays up to 100 of the latest messages based on the database timestamp. If you filter the messages, up to 1000 messages are displayed.
| Note: | After you filter the message, the filter remains in effect until you update it. |
The table shown in the preceding figure provides the following information:
To search for specific messages, you can filter the display of messages by clicking Filter in the Summary of Messages Table. The available filtering is shown in the following figure.
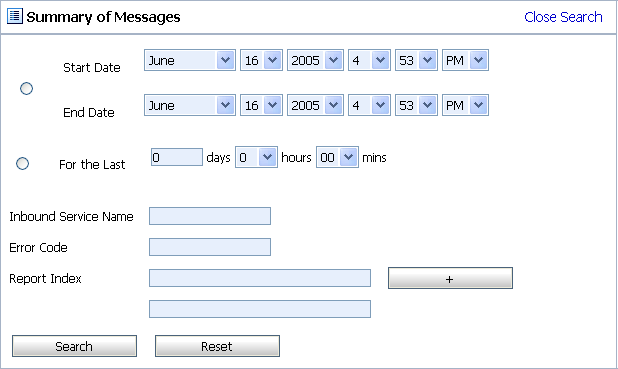
As shown in the Figure 5-6, you can filter report messages for a specified period of time, by the name of a service, by error code, and by report index. After you filter the messages, the title of the page changes to Summary of Filtered Messages. For information on how to use the Summary of Messages filter, see "Listing and Locating Messages" in Reporting in Using the AquaLogic Service Bus Console.
To view more information about a report message, click the name of the message in the Report Index column. The View Message Details page is displayed.
The View Message Details page displays complete information about the report messages, as shown in the following figure.
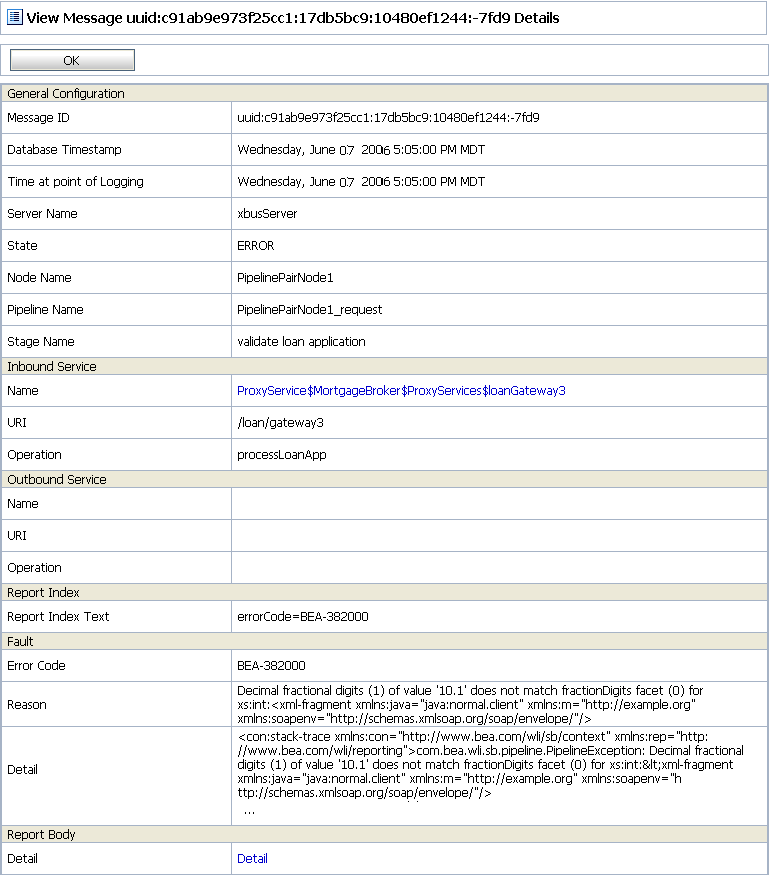
The page shows the following information:
You can purge all of the messages from the reporting datastore or base the purge on a range of time. Message purging is an asynchronous process that occurs in the AquaLogic Service Bus Console. This feature enables you to work with the Summary of Messages page in the AquaLogic Service Bus Console while the purge occurs in the background.
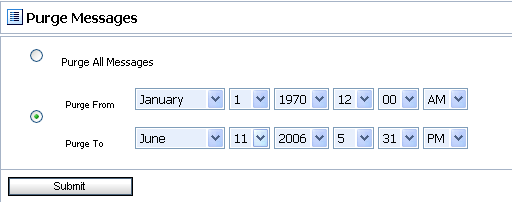
The duration of time it takes a purge to complete depends on how many messages are in the purge queue. The deletion of messages is slowed if you search for reporting messages during the purge process. Moreover, the Summary of Messages page may display incorrect data as some data may not yet be purged.
Because the purge process is asynchronous and occurs in the background, the AquaLogic Service Bus Console does not display any messages to indicate that a purge is in process. However, if another user attempts to start a purge when a purge is in progress, the following message is displayed:
A Purge job is already running. Please try later.AquaLogic Service Bus requires a database for the JMS Reporting Provider Data Store. The PointBase database that is installed with WebLogic Server is for evaluation purposes only and not intended for a production environment. Non-evaluation development or other use of the PointBase Server requires that you obtain a separate PointBase license.
In a production environment you must use one of the supported databases. For the latest information about supported databases, see "Supported Databases and Drivers" in Supported Configurations for WebLogic Platform in Supported Configurations for AquaLogic Service Bus.
This section provides information on the following topics:
When you create an AquaLogic Service Bus domain, the Configuration Wizard does not create database tables automatically. In a development environment, the JMS Reporting Provider, which is provided with AquaLogic Service Bus installation checks whether tables exist for the specified database at run time. If tables do not exist, the Reporting Provider creates them; if they do exist, the Reporting Provider uses them.
| Note: | If you are using Pointbase, you do not need to specify a database in the Configuration Wizard. |
You can specify which database is used by the JMS Reporting Provider in one of the following ways:
<BEA_HOME>/weblogic92/integration/common/dbscripts, where BEA_HOME represents the location in which you installed WebLogic products.Complete information about configuring a database for production is located in the AquaLogic Service Bus Deployment Guide in the following chapters:
As previously mentioned, the JMS Reporting Provider, which is provided with AquaLogic Service Bus installation is automatically configured when you create an AquaLogic Service Bus domain. If you do not wish to use this reporting provider or any reporting provider, you must untarget it.
| Note: | If no reporting provider exists, you can still define a Report action. However, no data will be written. |
The following sections provide information on how to stop or untarget any reporting provider:
If you wish to stop a reporting provider when the server is running in the AquaLogic Service Bus domain, do the following steps:
If you wish to untarget a reporting provider when the server is running in the AquaLogic Service Bus domain, do the following:
| Note: | This step is only required for reporting providers that use their own data sources. If you are untargeting the JMS Reporting Provider, which is provided with AquaLogic Service Bus installation you must perform the following steps. |
 JDBC
JDBC Data Sources.
If the server is not running in the AquaLogic Service Bus domain, you can use the WebLogic Scripting Tool (WLST) to remove the JMS Reporting Provider from the AquaLogic Service Bus domain. For more information about WLST, see WebLogic Scripting Tool in the WebLogic Server documentation.
To untarget a reporting provider, complete the following steps:
C:>java com.bea.plateng.domain.script.jython.WLST_offline
wls:/offline>readDomain("C:/bea/user_projects/domains/base_domain")
wls:/offline/base_domain>unassign("JdbcSystemResource", "wlsbjmsrpDataSource", "Target", "AdminServer")
wls:/offline/base_domain>unassign("AppDeployment", "JMS Reporting Provider", "Target", "AdminServer")
wls:/offline/base_domain>updateDomain()
wls:/offline/base_domain>closeDomain()
After the AquaLogic Service Bus JMS reporting provider is untargeted, the Reporting module in the AquaLogic Service Bus Console will indicate that the reporting provider is not deployed, as shown Figure 5-12.
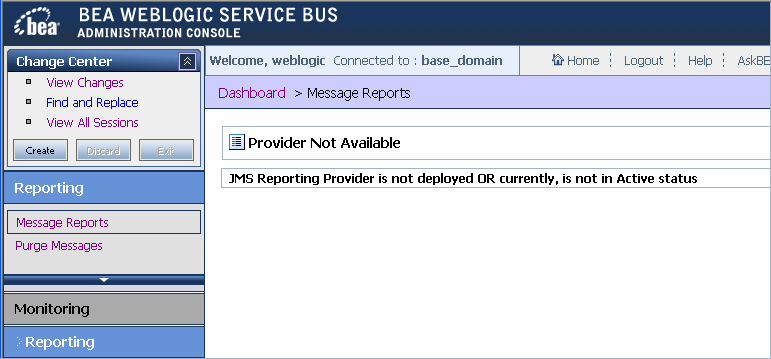
| Note: | In a cluster, the JMS Reporting Provider is targeted to Cluster. Therefore in a cluster, to view and purge messages, you must configure at least one managed server to run with the Administration server. If no managed servers are running, AquaLogic Service Bus Console displays the message shown in the previous figure. |


|