WebLogic SNMP Management Guide
|
|
Understanding WebLogic Server Trap Notifications
You can configure the WebLogic SNMP agent to detect certain thresholds or conditions within a managed resource and send a report (trap notification) to one or more SNMP managers. The WebLogic SNMP agent can generate traps that conform to the SNMPv1 or SNMPv2 protocols.
The following sections describe the trap notifications that the WebLogic SNMP agent can generate:
- Format of WebLogic Trap Notifications
- Automatically Generated WebLogic SNMP Traps
- Log Message Traps
- Monitor Traps
- Attribute Change Traps
To configure or delete WebLogic Server trap notifications, refer to "Use SNMP to monitor WebLogic Server" in the Administration Console Online Help.
Format of WebLogic Trap Notifications
The WebLogic SNMP agent sends each trap notification to SNMP managers in the form of a protocol data unit (PDU) that contains the fields shown in Figure 3-1.
The fields contain the following information:
PDU type— Identifies the packet as a trap notification.enterprise— Contains.1.3.6.1.4.140.625,which indicates the trap is generated by the WebLogic SNMP agent.agent address— IP address of the Administration Server. (All traps are generated and sent from the Administration Server even if an event occurs on a Managed Server.)generic trap type— Contains an integer in the range of 0 to 6. Table 3-1 lists the values that the different types of WebLogic SNMP traps supply for thegeneric trap typefield.Traps with a
generic trap valueof 6 are called enterpriseSpecific traps and are accompanied by a value in thespecific trap typefield.specific trap type— Number that further qualifies anenterpriseSpecifictrap. Table 3-2 lists the values that the different types of WebLogic SNMP traps supply for thespecific trap typefield.timestamp— Length of time between the last re-initialization of the WebLogic SNMP agent and the time at which the trap was issued.variable bindings— Consists of name-value pairs that further describe the trap notification. Later sections describe the name-value pairs for each type of trap notification:
|
An SNMP manager sends an incorrect community string. The community string prefix is the actual password and must match the value that you set in the Community Prefix field of the Administration Console. (See Community Names for WebLogic Server.) |
|
Automatically Generated WebLogic SNMP Traps
If you enable the SNMP service for a domain, the WebLogic SNMP agent automatically generates the trap notifications described in Table 3-3. Some of these traps include name-value pairs in the PDU to further describe the event.
|
An SNMP manager sends an incorrect community string. The community string prefix is the actual password and must match the value that you set in the Community Prefix field of the Administration Console. (See Community Names for WebLogic Server.) |
||
|
Contains two name-value pairs to identify server start time and the server name. |
||
|
Contains two name-value pairs to identify server down time and the server name. |
Log Message Traps
Subsystems and deployable modules (such as applications) on a WebLogic Server instance generate log messages to communicate status or other operational data.
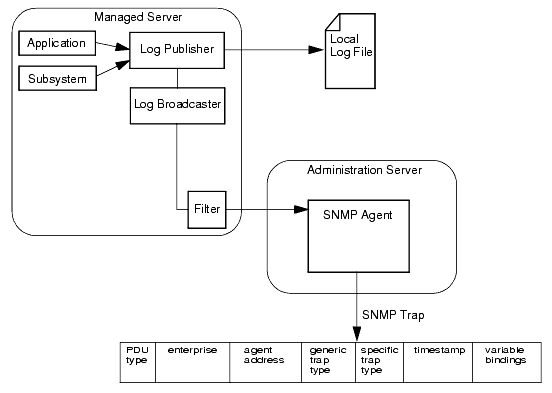
Each server instance saves these messages in a local log file and then broadcasts them as JMX notifications. You can set up the WebLogic SNMP agent to listen for all of these messages, or you can set up a filter based on criteria such as:
- Message severity level
- Name of the subsystem that generated the message
- User ID under which the subsystem is running
- Unique message ID
- String within the message text
For example, you can specify that only messages from the Security Service of severity level ERROR or higher are sent to the SNMP agent. For information on setting up the SNMP agent to listen for messages, refer to "Create SNMP Log Filters" in the Administration Console Online Help.
When the agent receives a message, it generates an SNMP log notification trap. (See Figure 3-2.)
Variable Bindings in Log Message Traps
This section describes the name-value pairs that the log message traps pass to the SNMP manager in the variable bindings field:
trapTime— Time the trap is generated.trapServerName— Name of the server instance on which the log message was generated.trapMachineName— Name of the machine on which the server instance is running.trapLogThreadId— Thread ID from the log message.trapLogTransactionId— Transaction ID, if any, from the log message. Transaction ID is present only for messages logged within the context of a transaction.trapLogUserId— User ID from the log message. The user ID indicates the security context in which the log message was generated.trapLogSubsystem— Subsystem that generated the log message.trapLogMsgId— Log message ID from the log message.trapLogSeverity— Message severity level from the log message.trapLogMessage— Text of the log message.
For more information on log messages and the WebLogic Server logging subsystem, refer to "Understanding WebLogic Logging Services" in Configuring Log Files and Filtering Log Messages.
Monitor Traps
To periodically check the value of WebLogic resources for changes, you set up JMX monitors and configure the SNMP agent to listen for notifications from these monitors.
JMX is a J2EE specification for exposing management data; it is the foundation for the WebLogic Server management system. In the JMX specification, management data and operations are made public through managed beans (MBeans). The managed objects in the WebLogic Server MIB correspond to MBeans and MBean attributes. See Relationship of the MIB to the WebLogic Server MBean Data Model.
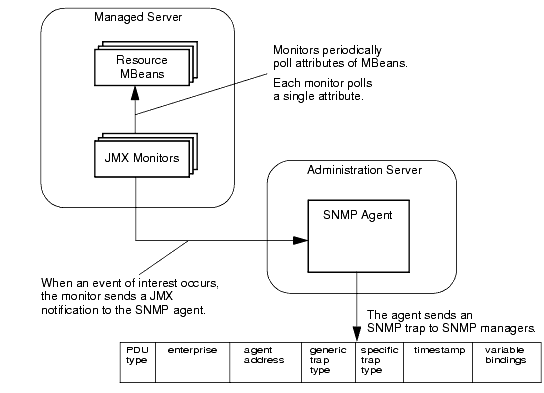
JMX monitors poll the WebLogic Server MBeans that are represented in the MIB at a specified interval and send notifications to the WebLogic SNMP agent when an event that you specify occurs, such as the crossing of a threshold. The SNMP agent generates a trap notification and sends it to the SNMP managers. (See Figure 3-3.)
You can configure three types of JMX monitors, depending on the data type of the attribute that you want to observe (the WebLogic Server MBean Reference describes the type of data that an attribute returns):
- Counter Monitor
A counter monitor observes MBean attribute values that are returned as an
Integerobject type.You can specify that a trap is generated if an attribute is beyond the bounds of a threshold value. You can also specify that if a value exceeds a threshold, the monitor increases the threshold by an offset value. Each time the observed attribute exceeds the new threshold, the threshold is increased by the offset value, up to a maximum allowable threshold that you specify.
For information on configuring a counter monitor, refer to "Create counter monitors" in the Administration Console Online Help.
- Gauge Monitor
A gauge monitor observes changes in MBean attributes that are expressed as integers or floating-point.
You can specify that a trap is generated if an attribute is beyond the bounds of a high or low threshold value.
For information on configuring a gauge monitor, refer to "Create gauge monitors" in the Administration Console Online Help.
- String Monitor
A string monitor observes changes in attributes that are expressed as
Stringobjects.You can specify that a trap is generated if there is a match between the value and the string you provide, or you can specify that the trap is generated if the value differs from the string you provide.
For information on configuring a string monitor, refer to Create string monitors" in the Administration Console Online Help.
Variable Bindings in Monitor Traps
A JMX monitor polls for a specified threshold or condition and the agent generates a monitor trap when the specified threshold is crossed, or the specified condition occurs. The WebLogic SNMP agent includes the following name-value pairs in the variable bindings of each monitor trap:
trapTime— Time at which the trap was generated.trapServerName— Local server whose attribute value generated the trap.trapMonitorType— EitherCounterMonitor,StringMonitor, orGaugeMonitor.trapMonitorThreshold— ASCII representation of the threshold that triggered the trap.trapMonitorValue— ASCII representation of the value that triggered the trap.trapMBeanName— Name of the MBean that contained the attribute being monitored.trapMBeanType— Type of the MBean that contained the attribute being monitored.trapAttributeName— Name of the attribute whose value triggered the trap.
Attribute Change Traps
While you can use JMX monitors to periodically poll WebLogic Server resources for changes to attributes that exceed the bounds of specific thresholds, you can also configure the SNMP agent to send a trap immediately after an attribute is changed in any way. For example, you can use a JMX monitor to poll for changes in the current number of active JDBC connections. If the number of active connections exceeds a threshold, the SNMP agent can send a trap. You would use an attribute change trap to detect whether an attribute such as the name of a JDBC data source or the server's listen port has been changed.
For information on configuring the SNMP agent to send attribute change traps, refer to "Create attribute changes" in the Administration Console Online Help.
Note: Creation of attribute changes for runtime MBeans is not supported. Only attributes of configuration MBeans support attribute change traps.
Variable Bindings in Attribute Change Traps
An attribute change trap notification includes the following name-value pairs in the variable bindings:
trapTime— The time at which the trap was generated.trapServerName— The name of the Administration Server.trapMBeanName— Name of the MBean that includes the attribute.trapMBeanType— Type of the MBean that includes the attribute.trapAttributeName— Name of the configuration attribute that has changed.trapAttributeChangeType— The value can be eitherADD,REMOVE, orUPDATE.trapAttriruteOldVal— Value of the attribute before the change.trapAttributeNewVal— Value of the attribute after the change.


