Using the WebLogic Diagnostic Framework Console Extension
|
|
Understanding How Data Is Collected and Presented
In a standard WLDF configuration, you can configure the Harvester to collect metrics for specified attributes of specified MBean instances. This information is available for programmatic access, and it is written to a standard log, HarvestedDataArchive, which you can view through the standard Administration Console (see Configuring the Harvester for Metric Collection in Configuring and Using the WebLogic Diagnostic Framework). You can also configure the Instrumentation component to generate events called diagnostic actions when certain conditions are met in instrumented code (see Configuring Instrumentation in Configuring and Using the WebLogic Diagnostic Framework). This information, too, is persisted in a standard log, EventsDataArchive., which you can view through the standard Administration Console.
Those WLDF components and log files are used for displaying data in the WLDF Extension:
- To view current metrics data in the WLDF Console Extension, it is not necessary to configure the Harvester. Data is retrieved from a data cache on the server. However, to see historical metric data, you must configure the Harvester to collect the data you want to monitor. Historical data is always retrieved from the
HarvestedDataArchivelog. See How Metrics Data Is Collected and Presented. - To view current and historical data for instrumented methods, you must configure Instrumentation as part of the WLDF configuration for the server. Instrumentation data displayed in the WLDF Console Extension is always retrieved from the
EventsDataArchivelog. See How Instrumentation Data Is Collected and Presented.
Data displayed in the WLDF Console Extension is generated, collected, and optionally persisted on the server, and the client periodically polls that data for display in a chart.
How Metrics Data Is Collected and Presented
When a view containing one or more metric charts is activated in the WLDF Console Extension, data collection for viewing those metrics in real time is started on the server. The data collector continually gathers the data and places it in a "wrap-around" cache. That is, as new data fills the cache, the oldest data in the cache is lost. When a view is stopped, data collection for the contained charts is stopped. (But note that if the Harvester is configured to collect data for a metric, that data will continue to be harvested and persisted to the log.)
To display current data on the client, the WLDF Console Extension periodically polls the cache for a current data set and displays it in a chart.
Note: The size of the data set returned to the client is configurable. See Setting Global Polling and View Scrolling Properties.
To display current metric data, no prior WLDF configuration is required. However, to display historical data for a metric, the WLDF Harvester must have been configured to harvest that data.
The following four illustrations (Figure 4-1, Figure 4-2, Figure 4-3, and Figure 4-4) show how metric data is retrieved and displayed for present and historical data, with and without harvesting.
These conceptual illustrations show a timeline from server startup to the present:
- The tail of the arrow, on the left, represents the time when the server was started. The tip of the arrow, on the right, represents the present.
- The point in the middle of the arrow represents the time when a view containing the metric chart was activated and, therefore, when the Console Extension client started polling for data to display for that metric.
- The oval represents the range of data that is being displayed in a chart in the Console Extension, sometimes called the viewport.
The data cache always contains the most current data. But if polling has been taking place long enough for old data to be purged, the cache does not contain all data from the time polling started. That is why the range of data shown through the viewport is not equivalent to the range of data collected since polling began.
If the Harvester was not configured to harvest data for this metric, no historical data is available for the metric and therefore cannot be displayed in the WLDF Console Extension client. If the Harvester was configured to harvest data for this metric, historical data is available for the metric and can be displayed by scrolling back through a chart (see Scrolling and Zooming the Data Displayed in a Chart.
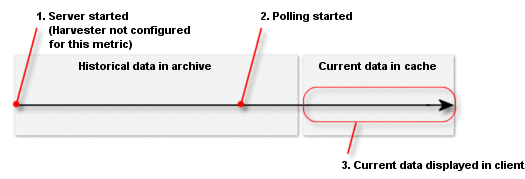
Figure 4-1 illustrates the following scenario:
- When the server starts, the Harvester is not configured for the metric. Therefore, no data is saved for later retrieval.
- At some point after the server was started, the Console Extension is started and the view containing the Metric chart is activated. Polling for the metric begins, and the current data fills the cache.
- The Metric chart, displayed in the client, shows current data from the cache. If you tried to scroll to see historical data, you could not see any, since none is available.
Figure 4-1 No Harvesting; Display Current Data
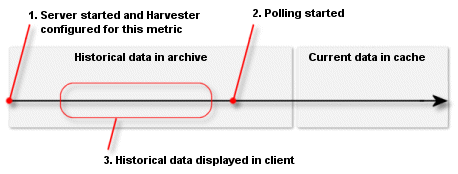
Figure 4-2 illustrates the following scenario:
- When the server starts, the Harvester is configured for the metric and starts to harvest data when the server is started. The data is persisted to the archive, and it can be retrieved for viewing.
- At some point after the server was started, the Console Extension is started and the view containing the Metric chart is activated. Polling for the metric begins, and the current data fills the cache.
- The Metric chart, displayed in the client, shows current data from the cache. Because the data was harvested and archived, you can scroll the chart to see historical data. However, in this illustration, the chart is still set to display current data. Even though data for the metric is being saved in the archive, the current data is still retrieved from the cache.
Figure 4-2 Harvesting; Display Current Data
The scenario in Figure 4-3 shows the same scenario as in Figure 4-2, but in this case, the chart is scrolled to show historical data. All data is retrieved from the archive. Current data continues to fill the cache, but that data is not currently used.
Figure 4-3 Harvesting; Display Historical Data
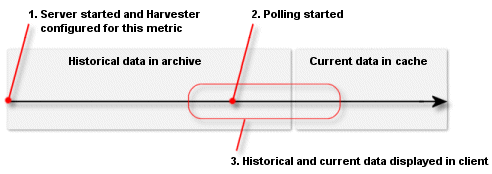
The scenario in Figure 4-4 shows the same scenario as in Figure 4-2 and Figure 4-3, but in this case, the chart is scrolled to show some historical data and some current data. The historical data is retrieved from the archive, and the current data is taken from the cache.
Figure 4-4 Harvesting; Display Current and Historical Data
How Instrumentation Data Is Collected and Presented
For instrumentation data to be displayed in a chart, instrumentation must be configured in the WLDF configuration on the server. Data is always retrieved from the persisted store. If instrumentation is not configured and activated for a server, you will not be able to see any events in the Requests tab.


