12 Monitoring the Performance of Web Services
This chapter describes how to monitor the performance of a Web service. The chapter includes the following sections:
In addition to the monitoring features described in this chapter, see "Analyzing Policy Usage" to analyze how policies are used by one or more Web services.
Overview of Performance Monitoring
Note:
Not all of the monitoring features described in this chapter apply to Java EE Web services.From the Web Services home page, you can do the following:
-
Monitor Web services faults, including Security, Reliable Messaging, MTOM, Management, and Service faults.
-
Monitor Security failures, including authentication, authorization, message integrity, and message confidentiality failures.
-
Configure your Web services ports, including enabling and disabling the port, attaching policies to Web services, and enabling or disabling policies.
The Application home page also displays select Web service details if the application includes Web services.
When Are Web Service Statistics Started or Reset?
The statistics described in this chapter are started or reset when any one of the following events occur:
-
When the application is being deployed for the first time.
-
When the application is redeployed.
-
If the application is already deployed, and the hosting server is restarted.
Viewing Web Service Statistics from the Summary Page
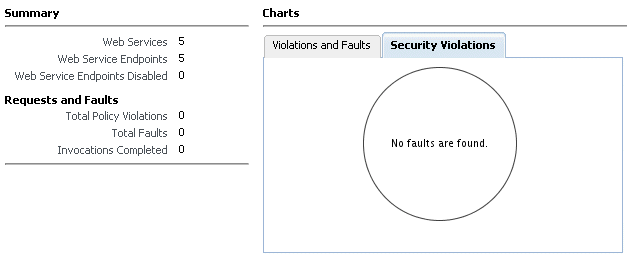
The Web Services summary page for an application displays the collective Summary and fault/violation information for all Web services in the application, as shown in Figure 12-1.
The Charts section shows a graphical view of all security faults for a Web service.
To navigate to the Web Service Summary page for a Web service
-
In the navigator pane, expand Application Deployments to show the application for which you want to monitor the Web service performance.
Select the application.
-
Using Fusion Middleware Control, click Web Services.
The Web Services Summary page for this application is displayed.
The page displays Web service endpoints as well as application-level metrics.
The following Web service-wide statistics are displayed:
-
Web Services (Number of Web services in the application)
-
Web Service Endpoints
-
Web Service Endpoints Disabled
-
Total Policy Violations
-
Total Faults
-
Invocations Completed
Figure 12-1 Web Services Performance Summary and Charts

Description of "Figure 12-1 Web Services Performance Summary and Charts"
Viewing Web Service Statistics for a Server Instance
The server-side Web services page displays statistics for all of the Web services on that server.
To view the Web service statistics for a server
-
In the navigator pane, expand WebLogic Domain to show the domain for which you want to see the policies. Select the domain.
-
Expand the domain to show the servers in that domain. Select the server for which you want to view the statistics.
-
Using Fusion Middleware Control, click WebLogic Server, and then Web Services.
-
The Web services statistics page for the server is displayed, as shown in Figure 12-2.
Depending on what types of Web services you have deployed, tabs are available for the available Web service types: Java EE, ADF and Web Center, and SOA.
Viewing Web Service-Specific Statistics
The Web Service Details section of the Web Services Summary page displays statistics on a per-Web service basis, as shown in Figure 12-3. The following statistics are displayed:
-
Endpoint Enabled
-
Invocations Completed
-
Response Time, in seconds
-
Policy Violations
-
Total Faults
Figure 12-3 Web Service-Specific Statistics

Description of "Figure 12-3 Web Service-Specific Statistics"
Viewing Endpoint-Specific Operations Statistics
To display operation statistics for a particular Web service endpoint, in the Web Services Details section of the Web Service Summary page select the endpoint for which you want to display the statistics.
The Web Service Endpoint page is displayed.
The following statistics are presented:
-
Policy Reference Status
-
Total Violations
-
Security Violations
Viewing Policy Security Violations for an Endpoint
To display security violations for a particular Web service endpoint, do the following:
-
In the Web Services Details section of the Web Service Summary page select the endpoint for which you want to display the statistics.
The Web Service Endpoint Summary page is displayed.
-
Click the Policies tab.
The following security violations are displayed:
-
Total Violations
-
Authentication violations
-
Authorization violations
-
Confidentiality violations
-
Integrity
