3 Monitoring Operational Metrics
This chapter contains the following topics:
3.1 Understanding PMD Components
JD Edwards EnterpriseOne PMD consists of these key areas for metric performance:
| Key Area | Description |
|---|---|
| Cash and Capital Management | Provides information about where the capital of the manufacturer is located and how well it is being managed. |
| Customer Shipment Performance | Provides information about the health of the order fulfillment process. |
| Inventory Management Effectiveness | Provides summary information about inventory turns. |
| Manufacturing Performance | Provides information about the reliability of the manufacturing process. |
| Revenue Management | Provides greater business insight related to future cash receipts and overall revenue performance. |
| Supplier Performance | Provides summary and detailed information about supplier performance. |
Each of the components tracks a number of operational metrics.
3.2 Managing Cash and Capital
This section provides an overview of cash and capital management and discusses how to:
-
Set processing options for the Cash to Cash program (R80D202).
-
Run the Cash to Cash program (R80D202).
-
Analyze cash to cash cycle time.
-
Set processing options for the Days Payable Outstanding Data Load program (R80D201).
-
Run the Days Payable Outstanding Data Load program (R80D201).
-
Analyze days payable outstanding.
-
Set processing options for the Inventory Data Load program (R80D220).
-
Run the Inventory Data Load program (R80D220).
-
Analyze days sales in inventory.
-
Set processing options for the Days Sales Outstanding Aggregate program (R80D200).
-
Run the Days Sales Outstanding Aggregate program (R80D200).
-
Analyze days sales outstanding.
3.2.1 Understanding Cash and Capital Management
Manufacturing companies invest much capital producing and shipping products, such as the cost of raw materials to make products, labor and machine time consumed in production, shipping charges, sales commissions, and so on.
Cash and capital management provides information about where the capital of the manufacturer is located and how well it is being managed. The metrics help determine the overall financial health of the manufacturer, the ability of the manufacturer to leverage inventory investments, and the overall value of the manufacturer.
Cash and capital management consists of these performance metrics:
| Metric | Description |
|---|---|
| Cash to Cash Cycle Time | Illustrates the overall financial health of a manufacturer. Cash to Cash Cycle Time is calculated as:
Cash to Cash Cycle Time = DSO + DSI – DPO |
| Days Payable Outstanding (DPO) | Measures how much a manufacturer owes creditors in terms of days of sales. DPO is calculated as:
=Total open accounts payable for an item/branchTotal cost of sales for the branch / 360 |
| Days Sales in Inventory (DSI) | Shows how much capital is tied up in the inventory of the manufacturer. DSI is calculated as:
=Total on-hand inventory cost for an item/branchTotal cost of sales for the branch / 360 |
| Days Sales Outstanding (DSO) | Measures how much capital is tied up in the outstanding accounts receivables of the manufacturer. DSO is calculated as:
=Total open accounts receivablesRunning 52 week sales calculation / 360 |
3.2.2 Setting Processing Options for the Cash to Cash Program (R80D202)
Processing options enable you to specify the default processing for the Cash to Cash program.
3.2.2.1 Display
This processing option controls the print output.
- Level of Detail to Print
-
Specify whether the system prints a detailed report or errors only.
Values are:
-
Blank: The system prints errors only.
-
1: The system prints a detailed report of the processed records and any errors that occurred.
-
3.2.3 Running the Cash to Cash Program (R80D202)
Enter BV in the Fast Path field, and then enter R80D202 in the Batch Application field.
The Cash to Cash program (R80D202) calculates the Cash to Cash Cycle Time as DSO plus DSI minus DPO. For example, a manufacturer has a DSO of 45 days, DSI of 60 days, and DPO of 40 days, resulting in a Cash to Cash Cycle Time of 65 days. Another manufacturer has DSO of 10 days, DSI of five days, and DPO of 20 days, resulting in a Cash to Cash Cycle Time of –5 days, which is a goal that every manufacturer wants to achieve. The system calculates the Cash to Cash Cycle Time at a point in time and moves forward; the system cannot determine previous Cash to Cash Cycle Time values.
The system stores the Cash to Cash Cycle Time value in the Cash to Cash Cycle Aggregate table (F80D202). The Cash to Cash Cycle Time is accurate as of the last date that you ran the Cash to Cash program. You should run the program weekly so that the trend can be displayed.
|
Note: You must run the Days Sales Outstanding, Days Payable Outstanding, and Inventory Data Load programs before the Cash to Cash program. |
3.2.4 Analyzing Cash to Cash Cycle Time
Access the appropriate metric group on the Plant Manager's Dashboard form.
The Cash to Cash Cycle Time metric is a powerful measure of the overall financial health of a manufacturer. The Cash to Cash Cycle Time metric reflects the difference between the capital that the manufacturer has tied up in accounts receivable and inventory, and the cash that the manufacturer owes to suppliers. The system expresses the Cash to Cash Cycle Time metric in number of days worth of sales.
A low cash-to-cash cycle time indicates that the manufacturer is managing capital well, not tying up too much cash in receivables and inventory, and not being overly eager to pay suppliers quickly. A high cash-to-cash cycle time indicates that the manufacturer may have too much capital tied up in accounts receivable and inventory, or that a significant delay occurs between the time that the manufacturer must pay suppliers and when it receives cash from customers. Companies strive to achieve the lowest cash-to cash-cycle time possible.
Studies confirm a high correlation between low cash-to-cash cycle days and high earnings per share. The trend over time enables managers to quickly determine whether recent actions are adding value to the manufacturer. Using the three components of the Cash to Cash Cycle Time metric—DSO, DSI, and DPO—can help managers understand the factors affecting changes in the metric.
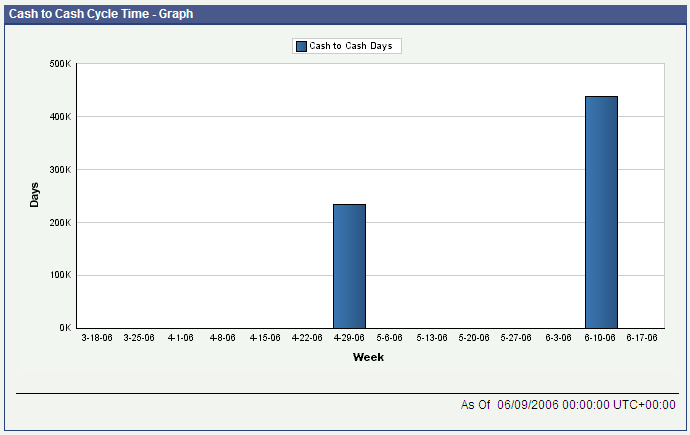
The system presents the Cash to Cash Cycle Time metric as a bar chart that depicts the number of days in the Cash to Cash Cycle Time (Y axis) for the date on which the system calculated the metric (X axis):
The system displays the values for all previous Cash to Cash Cycle Time calculations in the chart. If the Cash to Cash Cycle Time calculation was zero days, the system displays a zero value bar for the period. If no calculation was performed for a period, the system does not display a bar.
You can define a goal value for Cash to Cash Cycle Time. You enter the goal as a single number that represents the target Cash to Cash Cycle Time. If the Cash to Cash Cycle Time exceeds the goal value, the system considers the goal breached. The system displays the goal as a diamond marker for each bar on the chart.
3.2.5 Setting Processing Options for the Days Payable Outstanding Data Load Program (R80D201)
Processing options enable you to specify the default processing for the Days Payable Outstanding Data Load program.
3.2.5.1 Defaults
This processing option controls the print output.
- 1. Level of Detail to Print
-
Specify whether the system prints a detailed report or errors only.
Values are:
-
Blank: The system prints errors only.
-
1: The system prints a detailed report of the processed records and any errors generated.
-
3.2.6 Running the Days Payable Outstanding Data Load Program (R80D201)
Enter BV in the Fast Path field, and then enter R80D201 in the Batch Application field.
The Days Payable Outstanding program (R80D201) calculates DPO by determining the last 52-week total cost of sales for the branch divided by 360 and then dividing the number into the total open payables for the branch. The system calculates DPO at a point in time and moves forward; the system cannot determine previous DPO values.
The system stores the DPO value in the Days Payable Outstanding Aggregate table (F80D201). The DPO value is accurate as of the last date that you ran the Days Payable Outstanding program. You should run the program weekly so that the trend can be displayed.
|
Note: You must run the Sales Order Activity Data Load program (R80D221C) before the Days Payable Outstanding program.You must run the Days Payable Outstanding program before the Cash to Cash program (R80D202). |
3.2.7 Analyzing Days Payable Outstanding
Access the appropriate metric group on the Plant Manager's Dashboard form.
Days Payable Outstanding (DPO) is a widely used metric that measures how much a manufacturer currently owes to creditors, expressed in the number of days sales that are required to cover what is owed. The result of the DPO calculation informs managers how long, on average, the manufacturer takes to pay bills.
A high DPO number indicates that the manufacturer can wait a long time to pay bills, possibly longer than the time required to get money from customers, as calculated using DSO. Manufacturers must balance between maintaining good relationships with suppliers and acting as responsible, high-integrity members of the supply chain. Continuously being late in paying bills can damage important relationships with key suppliers. Companies strive to keep DPO as high as possible.
Keeping DPO as high as possible and DSO and DSI as low as possible indicates that the manufacturer has a healthy cash flow. A manufacturer that produces products to order, bills customers immediately upon order receipt, and pays suppliers only after materials are consumed and shipped has a DPO that is longer than the DSO. A DPO that is longer than the DSO indicates that the manufacturer receives money from customers before they must pay suppliers, which is an enviable business model. Most companies aspire to, but few achieve, the business model of DPO longer than DSO.
The system presents the DPO metric as a bar chart that depicts the number of days of payable outstanding (Y axis) for the date on which the system calculated the metric (X axis):
Figure 3-2 Days Payables Outstanding chart
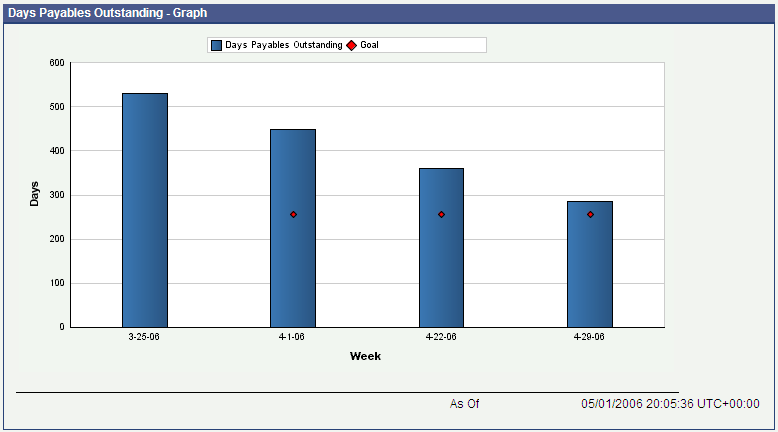
Description of "Figure 3-2 Days Payables Outstanding chart"
The system displays the values for all previous DPO calculations in the chart. If the DPO calculation was zero days, the system displays a zero value bar for the period. If no calculation was performed for a period, the system does not display a bar.
You can define a goal value for DPO. You enter the goal as a single number that represents the target DPO. If the DPO exceeds the goal value, the system considers the goal breached. The system displays the goal as a diamond marker for each bar on the chart.
3.2.8 Setting Processing Options for the Inventory Data Load Program (R80D220)
Processing options enable you to specify the default processing for the Inventory Data Load program.
3.2.8.1 Display
This processing option controls the print output.
- 1. Level of Detail to Print
-
Specify whether the system prints a detailed report or errors only.
Values are:
-
Blank: The system prints errors only.
-
1: The system prints a detailed report of the processed records and any errors that occurred.
-
3.2.9 Running the Inventory Data Load Program (R80D220)
Enter BV in the Fast Path field, and then enter R80D220 in the Batch Application field.
The Inventory Data Load program (R80D220) calculates both the DSI and the Inventory Turns. The DSI metric is the inverse of the Inventory Turns calculation.
The system calculates DSI by determining the total 52-week cost of sales for the branch divided by 360 and then dividing the number into the total on-hand inventory cost by item and branch. The system calculates DSI at a point in time and moves forward; the system cannot determine previous DSI values.
The system calculates Inventory Turns as the cost-of-goods sold in the last 52 weeks divided by the total current inventory value. The system calculates the Inventory Turn values at a point in time and moves forward; the system cannot determine previous Inventory Turn values.
The system stores the DSI and Inventory Turns values in the Inventory Aggregate table (F80D220). The values are accurate as of the last date on which you ran the Inventory Data Load program. You should run the program weekly to keep the date current.
|
Note: You must run the Sales Order Activity Data Load program (R80D221Cc) before the Inventory Data Load program.You must run the Inventory Data Load program before the Cash to Cash program (R80D202). |
3.2.10 Analyzing Days Sales in Inventory
Access the appropriate metric group on the Plant Manager's Dashboard form.
Days Sales in Inventory (DSI) measures how much capital a manufacturer has tied up in inventory. The result of the DSI calculation informs managers how many days worth of product sales, at cost, are required to pay for the investment in current inventory. When the cost of current inventory is high, the manufacturer has invested a lot of capital in acquiring inventory, and the DSI measure indicates how many days worth of sales need to be generated to cover that investment.
The higher the DSI number, the more capital the manufacturer has tied up in inventory. A high number of days can indicate that the inventory of the manufacturer is full of finished goods that are not selling, or raw materials that production is not consuming. When market tastes change and a previously popular product falls out of favor and becomes obsolete, a manufacturer can be stuck with raw materials. A low DSI number indicates that the manufacturer is effectively managing inventory. Companies strive to keep DSI as low as possible.
Many manufacturers work hard to improve on-time shipment performance while reducing inventory. Managers can review the DSI metric and the On-Time Shipment metrics to determine whether the measures are moving in the correct direction with DSI going down and On-Time Shipments going up. The manufacturer can effectively leverage inventory investments by holding enough inventory to fulfill customer expectations but not holding more than necessary.
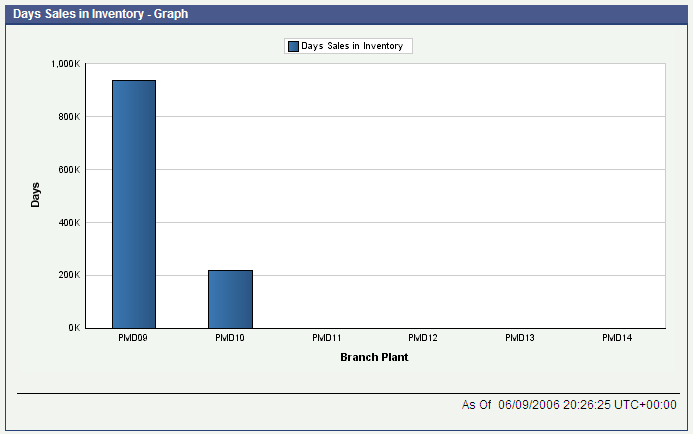
The system displays the DSI metric as a bar chart that depicts the number of days of sales in inventory (Y axis) for the date on which the system calculated the metric (X axis):
The system displays the values for all previous DSI calculations in the chart. If the DSI calculation was zero days, the system displays a zero value bar for the period. If no calculation was performed for a period, the system does not display a bar.
You can define a goal value for DSI. You enter the goal as a single number that represents the target DSI. If the DSI exceeds the goal value, the system considers the goal breached. The system displays the goal as a single diamond marker for each bar on the chart.
3.2.11 Setting Processing Options for the Days Sales Outstanding Aggregate Program (R80D200)
Processing options enable you to specify the default processing for the Days Sales Outstanding Aggregate program.
3.2.11.1 Display
This processing option controls the print output.
- 1. Level of Detail to Print
-
Specify whether the system prints a detailed report or errors only.
Values are:
-
Blank: The system prints errors only.
-
1: The system prints a detailed report of the processed records and any errors that occurred.
-
3.2.12 Running the Days Sales Outstanding Aggregate Program (R80D200)
Enter BV in the Fast Path field, and then enter R80D200 in the Batch Application field.
The Days Sales Outstanding Aggregate program (R80D200) calculates DSO by determining the running 52–week sales calculation divided by 360 and then dividing the number into the total open accounts receivable. The system captures the customer ledger information for a point in time while calculating the DSO using sales data for a rolling 12–month time frame. The system calculates DSO at a point in time and moves forward; the system cannot determine previous DSO values.
The system stores the DSO value in the Days Sales Outstanding Aggregate table (F80D200). The DSO value is accurate as of the last date on which you ran the Days Sales Outstanding Aggregate program. You should run the program weekly so that the trend can be displayed.
|
Note: You must run the Sales Order Fact Data Load program (R80D010) before the Days Sales Outstanding Aggregate program.You must run the Days Sales Outstanding Aggregate program before the Cash to Cash program (R80D202). |
The DSO value calculated in the dashboard can be different from the DSO value calculated in the JD Edwards EnterpriseOne Accounts Receivable system. The JD Edwards EnterpriseOne PMD system uses the data within the Sales Order Fact table (F80D010) to calculate the DSO for the dashboard. Depending on how you set processing options when loading the data into the table, the system can produce a different DSO number.
3.2.13 Analyzing Days Sales Outstanding
Access the appropriate metric group on the Plant Manager's Dashboard form.
Days Sales Outstanding (DSO) is a widely used metric that measures how much capital a manufacturer has tied up in outstanding receivables. The result of the DSO calculation informs managers how many days worth of product sales have been shipped to customers and are yet to be paid. When products are shipped on credit, companies must wait a certain number of days before receiving cash to recover the investments made in the shipped product.
The higher the DSO number, the more capital the manufacturer has tied up in accounts receivable. A high number of days can indicate that customers are slow in paying bills so the manufacturer has to wait a long time to collect cash. A low number indicates that customers pay quickly and as a result the manufacturer has a relatively small amount of capital tied up in receivables. A manufacturer that bills the customers' credit cards immediately upon receipt of an online order has a very low DSO number because they have very little money owed to them at any point in time. Companies strive to keep DSO as low as possible.
The DSO metric displays the trend over time and compares the trend to the DSO goal of the manufacturer. Increasing trends can indicate trouble collecting receivables from large customers and can result from surges in shipments, which increases the outstanding accounts receivables. DSO is considered important in accessing the overall financial health of a manufacturer, especially when combined with DSI and DPO to calculate the Cash to Cash Cycle Time.
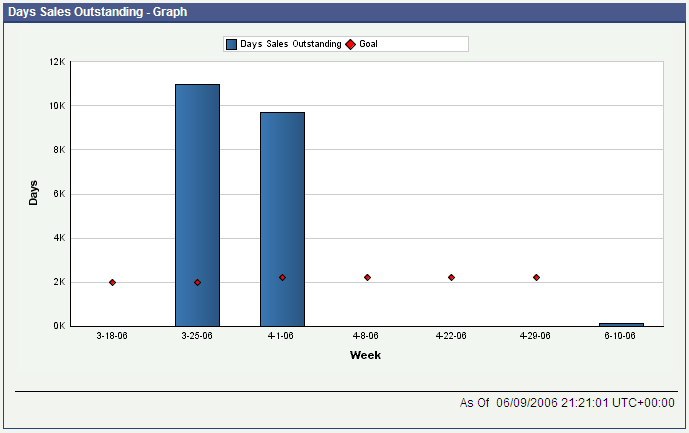
The system displays the DSO metric as a bar chart that depicts the number of days of sales outstanding (Y axis) for the date on which the system calculated the metric (X axis):
The system displays the values for all previous DSO calculations in the chart. If the DSO calculation was zero days, the system displays a zero value bar for the period. If no calculation was performed for a period, the system does not display a bar.
You can define a goal value for DSO. You enter the goal as a single number that represents the target DSO. If the DSO exceeds the goal value, the system considers the goal breached. The system displays the goal as a diamond marker for each bar on the chart.
3.3 Managing Customer Shipment Performance
This section provides an overview of customer shipment performance and discusses how to:
-
Set processing options for the Backorder Processing program (R80D213).
-
Run the Backorder Processing program (R80D213).
-
Analyze backorders.
-
Set processing options for the Book to Ship Days Processing program (R80D215).
-
Run the Book to Ship Days Processing program (R80D215).
-
Analyze book to ship days.
-
Set processing options for the On-Time Shipment Customer Request Date Data Load program (R80D210).
-
Run the On-Time Shipment Customer Request Date Data Load program (R80D210).
-
Analyze on-time shipments to customer request date.
-
Set processing options for the On-Time Shipment Promised Date Data Load program (R80D211).
-
Run the On-Time Shipment Promised Date Data Load program (R80D211).
-
Analyze on-time shipments to promise date.
-
Set processing options for the Past Due Processing program (R80D212).
-
Run the Past Due Processing program (R80D212).
-
Analyze past due order lines.
-
Set processing options for the Variance Processing program (R80D214).
-
Run the Variance Processing program (R80D214).
-
Analyze the promise to request date variance.
3.3.1 Understanding Customer Shipment Performance
Customer demands for exemplary service have escalated in recent years. The increasing popularity of management philosophies that emphasize minimal inventories has led manufacturers to order products for delivery on the exact date that the product is required. To ensure customer satisfaction and remain competitive in the marketplace, manufacturers must be able to ship products on the customer request date, not early and not late. Customer shipment performance metrics enable a manufacturer to analyze and track how frequently, and well, the manufacturer meets customer expectations.
Customer shipment performance provides information about the health of the order fulfillment process. The metrics highlight the factors involved in shipping a product, identify products with lead times that are too long for the market, highlight unpredictable manufacturing or supplier processes, illustrate the product lead time from the customer's perspective, and reveal the accuracy of production prioritization and scheduling decisions.
This table lists the customer shipment performance metrics:
| Metric | Description |
|---|---|
| Backorder Amount | Illustrates the sales amount in the specified currency of sales order lines on backorder. The Backorder Amount is calculated by summing the backorder amount from all sales order lines that have items on backorder. |
| Backorder Count | Illustrates the number of sales order lines on backorder. The Backorder Line Count is calculated by summing the backorder lines from all sales order lines that have items on backorder. |
| Book to Ship Days | Illustrates the number of days between the date that orders are taken and the actual ship date, by product family. The Book to Ship Days for a sales order line is calculated as:
Actual ship date – Date order was booked The average book to ship days for a date range is calculated as: =Sum of Book to Ship Days for all sales order lines shippedNumber of sales order lines shipped |
| On-Time Shipments to Customer Request Date | Shows the performance of the manufacturer in shipping orders on the date that the customer requested the product. The data is represented as percentages for on-time, early, and late. The on-time shipment percentage for a specified date range is calculated as:
=Number of order lines requested to ship that actually shipped on-timeTotal number of on time, early, and late orders for the date range For early and late calculations, the numerator changes accordingly. |
| On-Time Shipments to Promise Date Aggregate | Shows the performance of the manufacturer in shipping orders on the date promised to the customer. The data is represented as a percentage for on-time, early, and late aggregated over a time horizon. The on-time shipment percentage for a specified date range is calculated as:
=Number of order lines promised to ship that actually shipped on-timeTotal number of on time, early, and late orders for the date range For early and late calculations, the numerator changes accordingly. |
| On-Time Shipments to Promise Date Trend | Displays the trend over a time horizon for the performance of the manufacturer in shipping orders on the date promised to the customer. The data is represented as a percentage for on-time, early, and late. The on-time shipment percentage for a specified date range is calculated as:
Number of order lines promised to ship that actually shipped on-timeTotal number of on time, early, and late orders for the date range. For early and late calculations, the numerator changes accordingly. |
| Past Due Order Amount | Illustrates the sales amount in the specified currency of sales order lines that are past due. The Past Due Order Amount is calculated as the sum of the amount of sales order lines that have an amount remaining to be shipped and a promised ship date that is earlier than the current date. |
| Past Due Order Line Count | Illustrates the number of sales order lines that are past due. The Past Due Order Line Count is calculated as the number of sales order lines that have an amount remaining to be shipped and a promised ship date that is earlier than the current date. |
| Promise to Request Date Variance | Displays how often the manufacturer is unable to meet the date requested by the customer. The data is shown as a percentage for every day that data is available for the specified date range. The shipment variance is calculated as:
=Number of order lines for an item with promise date later than request dateTotal number of order lines for an item booked |
3.3.2 Setting Processing Options for the Backorder Processing Program (R80D213)
Processing options enable you to specify the default processing for the Backorder Processing program.
3.3.2.1 Display
This processing option controls the print output.
- 1. Level of Detail to Print
-
Specify whether the system prints a detailed report or errors only.
Values are:
-
Blank: The system prints errors only.
-
1: The system prints a detailed report of the processed records and any errors that occurred.
-
3.3.3 Running the Backorder Processing Program (R80D213)
Enter BV in the Fast Path field, and then enter R80D213 in the Batch Application field.
The Backorder Processing program (R80D213) calculates the backorder amount and line count for unfilled sales orders.
The system calculates the backorder amount for unfilled sales orders by adding the backorder amount from each line on the sales order. The system calculates total backorder amount by adding the backorder amounts for all sales orders that have any items on backorder.
The system calculates the backorder line count for unfilled sales orders by counting the backorder lines from each line on the sales order. The system calculates total backorder line count by counting the backorder lines for all sales orders that have any items on backorder.
The system stores the backorder amounts and line counts in the Back Order Aggregate table (F80D213). The backorder data is accurate only as of the last date that you ran the Backorder Processing program; the system cannot determine previous backorder data. You should run the Backorder Processing program daily to ensure accuracy of the Back Order Aggregate table. The system calculates daily backorder amounts and line counts by date, branch/plant, and item.
|
Note: You must run the Sales Order Fact Data Load program (R80D010) before the Backorder Processing program. |
3.3.4 Analyzing Backorders
Access the appropriate metric group on the Plant Manager's Dashboard form.
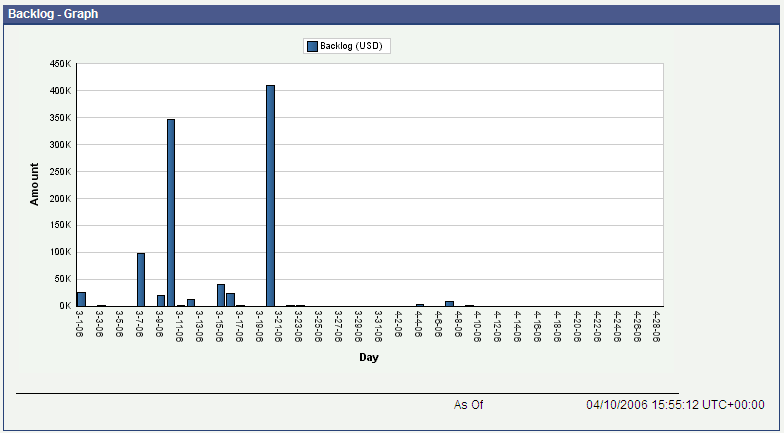
The system places sales order lines on backorder status when the manufacturer is unable to fill the order in the desired time frame. Typically, backorders are caused by a lack of available inventory. A high number of sales orders on backorder status may indicate that demand for a product is unexpectedly high and that the manufacturer cannot increase capacity to meet demands. High backorder numbers can also indicate that a manufacturer has problems completing finished goods on time or lacks the raw materials needed to produce products.
The Backorder metrics provides the manufacturer with a view of the backorder trend. Managers can aggressively respond to increasing backorder quantities. Backorders can be an indication of an impending falloff of on-time shipments. High backorder numbers can signal problems in production, available capacity, and supplier performance.
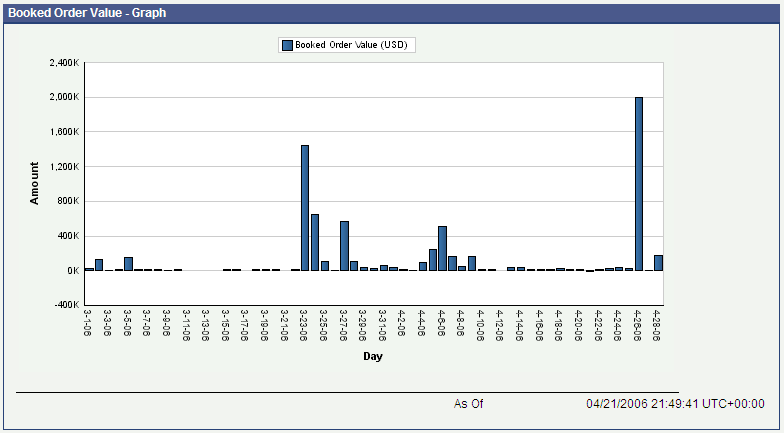
You should review backorders in conjunction with the On-Time Production Completions and On-Time Delivery metrics to determine the reason for excessive backorders. Analyzing the trends in the Booked Order Value metric can show spikes in demand for products, which can lead to backorders.
|
Note: In some manufacturing environments, such as make-to-order, configure-to-order, and assemble-to-order, finished goods inventory is not available when customers place a sales order, so the system places a majority of the sales orders lines on backorder status. The value of the Backorder metrics is diminished in these environments. |
The two Backorder metrics are:
-
Backorder Count.
-
Backorder Amount.
|
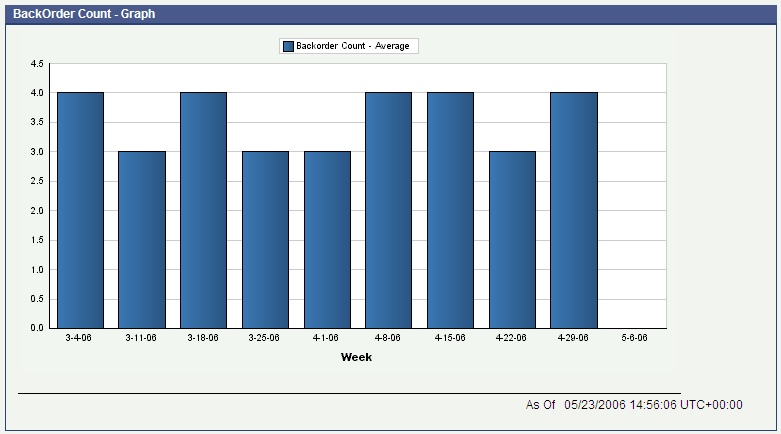
Note: You cannot define a goal value for the Backorder Count metric. |
The system presents the Backorder Count metric as a bar chart that shows the number of backorder lines (Y axis) for a specified date range (X axis):
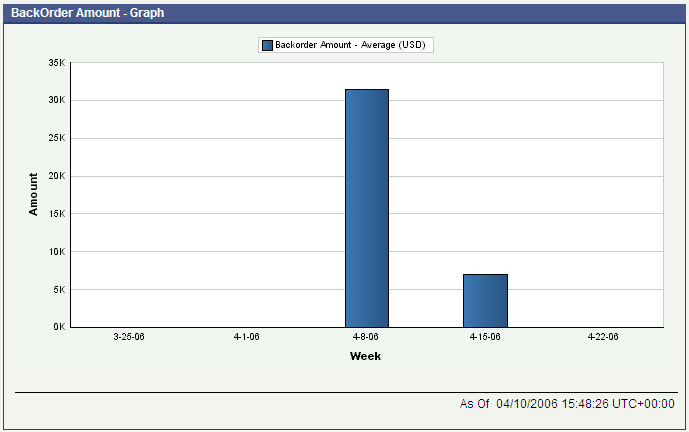
The system displays the Backorder Amount metric as a bar chart that shows the backorder amount value in the selected currency (Y axis) for a specified date range (X axis):
The Backorder Amount metric shows the sales amount of sales order lines on backorder and whether the trend is going up or going down.
The system displays a zero value bar for the periods for which no backorder amount is found. The system does not leave open spaces in the chart.
You can define a goal value for Backorder Amount. You enter the goal as a single number in the default currency that represents the maximum target backorder amount for the manufacturer. If the backorder amount exceeds the goal value, the system considers the goal breached. The system displays the goal as a diamond marker for each bar on the chart.
3.3.5 Setting Processing Options for the Book to Ship Days Processing Program (R80D215)
Processing options enable you to specify the default processing for the Book to Ship Days Processing program.
3.3.5.1 Display
This processing option controls the print output.
- 1. Level of Detail to Print
-
Specify whether the system prints a detailed report or errors only.
Values are:
-
Blank: The system prints errors only.
-
1: The system prints a detailed report of the processed records and any errors that occurred.
-
3.3.5.2 Process
This processing option controls the number of days that the system uses to load data.
- 1. Number of Days
-
Enter the number of days that the system uses to rebuild the data when running incremental loads. The system starts with the current date and counts back the number of days specified to load data.
3.3.6 Running the Book to Ship Days Processing Program (R80D215)
Enter BV in the Fast Path field, and then enter R80D215 in the Batch Application field.
The Book to Ship Days Processing program (R80D215) calculates the book to ship days value and the number of orders shipped for each sales order line in the Sales Order Fact table (F80D010). The system calculates the Book to Ship Days for each shipped sales order line by subtracting the value in the Order Date field from the value in the Actual Ship Date field. The system calculates average Book to Ship Days for all sales order lines for a date range by taking the sum of the Book to Ship Day value for all sales order lines shipped divided by the total number of sales order lines shipped.
The system stores the calculated data in the Book to Ship Aggregate table (F80D215). You should schedule the Book to Ship Days Processing program to run daily to ensure the accuracy of the Book to Ship Aggregate table. If you do not run the Book to Ship Days Processing program daily, the metric is accurate as of the last run.
The system uses the value in the PRP4 field in the Item Master table (F4101) to determine the product family for items.
|
Note: You must run the Sales Order Fact Data Load program (R80D010) before the Book to Ship Days Processing program. |
3.3.7 Analyzing Book to Ship Days
Access the appropriate metric group on the Plant Manager's Dashboard form.
Manufacturers continually strive to reduce book to ship days by improving the effectiveness of the order fulfillment process, from administrative tasks associated with order processing to production of the finished goods and inspection, packaging, and shipping. The Book to Ship Days metric illustrates the total lead time for a manufacturer from the point of view of a customer. Book to Ship Days measures the time between the date that a customer places an order and the date that the order ships.
You should review the Book to Ship Days metric for a single product or a group of like products, product families, for the most beneficial data. The metric appears by selected product family and then by items that make up the family. The only search by that is applicable to the Book to Ship Days metric is product family.
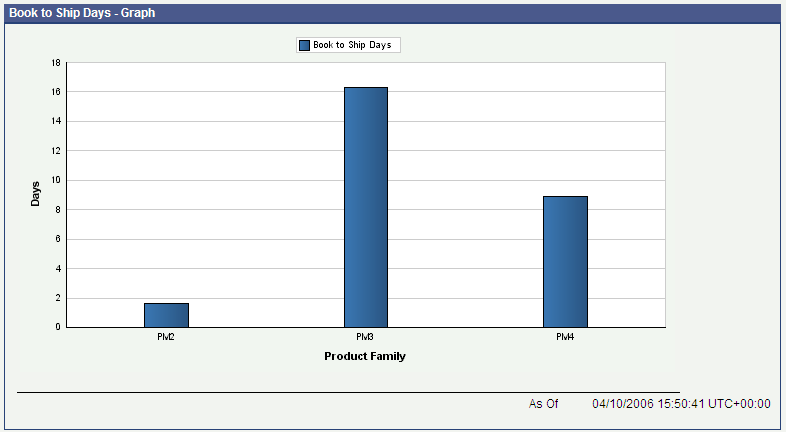
The system presents the Book to Ship Days metric as a bar chart that shows the number of days between book to ship dates (Y axis) by product family (X axis) for the month:
The system displays a bar on the chart for each product family selected. A zero value bar appears for each product family that had no shipment activity for the specified month. The system does not leave open spaces in the chart.
You can define a goal value for Book to Ship Days. You enter the goal as a single whole percentage and the goal represents the maximum average book to ship days for a product family. If the book to ship days are above the goal for a period, the system considers the goal breached. The system displays the goal as a diamond marker for each product family bar on the chart. The system does not support a single goal for all product families.
3.3.8 Setting Processing Options for the On-Time Shipment Customer Request Date Data Load Program (R80D210)
Processing options enable you to specify the default processing for the On-Time Shipment Customer Request Date Data Load program.
3.3.8.1 Defaults
These processing options control the print output, the threshold days, and the number of days that the system uses to load data.
- 1. Level of Detail to Print
-
Specify whether the system prints a detailed report or errors only. Values are:
-
Blank: The system prints errors only.
-
1: The system prints a detailed report of the processed records and any errors that occurred.
-
- 2. Threshold Days Prior
-
Enter a number that denotes the threshold for considering shipments on time. The system considers any order shipped within the threshold days before the customer request date as on time. The system considers any order shipped before the threshold days to be early.
- 3. Threshold Days After
-
Enter a number that denotes the threshold for considering shipments on time. The system considers any order shipped within the threshold days after the customer request date as on time. The system considers any order shipped after the threshold days to be late.
- 4. Number of Days for UBE Rebuild
-
Enter the number of days that the system uses to rebuild the data when running incremental loads. The system starts with the current date and counts back the number of days specified to load data.
If this processing option is left blank, the system runs a full build.
3.3.9 Running the On-Time Shipment Customer Request Date Data Load Program (R80D210)
Enter BV in the Fast Path field, and then enter R80D210 in the Batch Application field.
The On-Time Shipment Customer Request Date Data Load program (R80D210) calculates the on-time, early, and late shipments for the date on which the program is run based on the customer-requested ship date. The date range and thresholds to delineate on time are user-specified.
On-time shipments are sales order lines for which the value in the Actual Ship Date field is equal to the value in the Requested Ship Date field. The system calculates the on-time shipment percentage for a specified date range as the number of order lines requested to ship that actually shipped on the requested date divided by the total number of order lines requested to ship.
Early shipments are sales order lines for which the value in the Actual Ship Date field is less than the value in the Requested Ship Date field. The system calculates the early shipment percentage for a specified date range as the number of order lines requested to ship that actually shipped before the requested date divided by the total number of order lines requested to ship.
Late shipments are sales order lines for which the value in the Actual Ship Date field is greater than the value in the Requested Ship Date field. The system calculates the late shipment percentage for a specified date range as the number of order lines requested to ship that actually shipped after the requested date divided by the total number of order lines requested to ship. If the Actual Ship Date field contains no value and the value in the Requested Ship Date field is in the past, the system considers the sales order line late.
If you specify threshold days values in the processing options of the On-Time Shipment Customer Request Date Data Load program, the system adds or subtracts the value to the value in the Requested Ship Date field.
The system stores the calculated data in the On-Time Shipment Aggregate for Request Date table (F80D210). You should schedule the On-Time Shipment Customer Request Date Data Load program to run daily to ensure the accuracy of the On-Time Shipment Aggregate for Request Date table. If you do not run the program daily, the system calculates and stores records from the last date and time that you ran the program to the current date and time.
|
Note: You must run the Sales Order Fact Data Load program (R80D010) before the On-Time Shipment Customer Request Date Data Load program. |
3.3.10 Analyzing On-Time Shipments to Customer Request Date
Access the appropriate metric group on the Plant Manager's Dashboard form.
The On-Time Shipments to Customer Request Date metric measures the ability of a manufacturer to ship products upon customer request. If a manufacturer has poor performance in shipping on time to customers, the manufacturer is not satisfying the demands of the marketplace. Customers will switch to competitors of the manufacturer if the competitors have better performance. On-time performance below 95 percent can be disastrous in some industries, such as automotive.
In some cases, shipping early can be as bad as shipping late. Companies do not want to hold inventory any longer than necessary; receiving products early increases inventory levels and lengthens the amount of time that products are in inventory. Holding inventory longer affects the ability of the manufacturer to optimize performance and cash flow. Shipping early can indicate that a manufacturer is allocating production resources incorrectly, especially if the manufacturer has past-due sales orders. Shipping orders early while failing to allocate sufficient resources to ensure that already-late orders are shipped quickly may indicate that shop floor priorities are incorrect or not clearly identified. Management needs to take action to ensure that the shop floor has clear and correct priorities. Analysis of the Past Due Order Line Count and Amount metrics reveal whether a manufacturer is effectively dealing with past-due sales orders.
A high late-shipment percentage indicates that the manufacturer's lead time is no longer acceptable to the marketplace. If competitors can meet shorter lead times, the manufacturer's market share will erode as customers leave and do business with competitors. Many factors determine the lead time that a manufacturer can offer to customers. The aggregate On-Time Shipments to Customer Request Date metric evaluates those factors and helps identify ways to ship products more quickly. Using the supplier On-Time Delivery metric, in conjunction with the On-Time Shipments to Customer Request Date metric, can help identify situations in which the manufacturer is unable to ship on time due to late deliveries of critical raw materials. If suppliers are late, management must take action to ensure that suppliers meet the demands for on-time delivery of materials.
The system presents the On-Time Shipments to Customer Request Date metric as a stacked bar chart that shows the percentage (Y axis) for a specified date range (X axis):
Figure 3-8 OnTime Shipment Cust Request chart
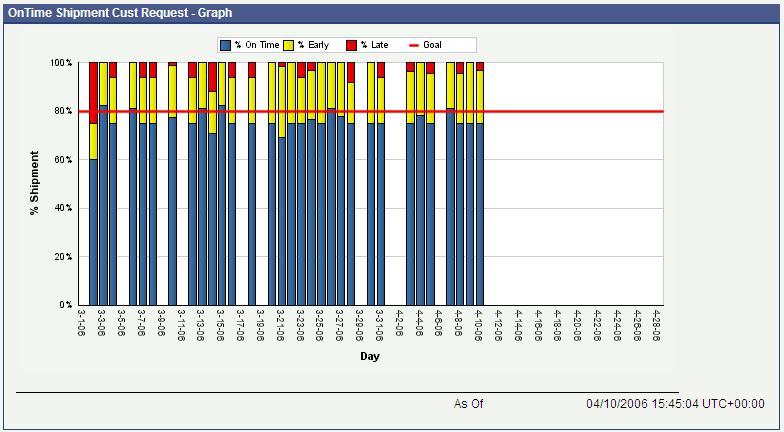
Description of "Figure 3-8 OnTime Shipment Cust Request chart"
The stacked bar chart appears with the on-time shipment percentage as the bottom segment, the early shipment percentage as the middle segment, and the late shipment percentage as the top segment. The system rounds the percentages to the nearest whole number, and the total of the three percentages must equal 100.
You can define a goal value for On-Time Shipments to Customer Request Date. You enter the goal as a single whole percentage, and it represents the target on-time percentage for the manufacturer. If the on-time percentage is not at or above the goal for a period, the system considers the goal breached. The system displays the goal as a single horizontal line on the chart.
3.3.11 Setting Processing Options for the On-Time Shipment Promised Date Data Load Program (R80D211)
Processing options enable you to specify the default processing for the On-Time Shipment Promised Date Data Load program.
3.3.11.1 Defaults
These processing options control the print output, the threshold days, and the number of days that the system uses to load data.
- 1. Level of Detail to Print
-
Specify whether the system prints a detailed report or errors only. Values are:
-
Blank: The system prints errors only.
-
1: The system prints a detailed report of the processed records and any errors that occurred.
-
- 2. Threshold Days Prior
-
Enter a number that denotes the threshold for considering shipments on time. The system considers any order that was shipped within the threshold days before the customer-promised date to be on time. The system considers any order that was shipped before the threshold days to be early.
- 3. Threshold Days After
-
Enter a number that denotes the threshold for considering shipments on time. The system considers any order that was shipped within the threshold days after the customer-promised date to be on time. The system considers any order that was shipped after the threshold days to be late.
- 4. Number of Days for UBE Rebuild
-
Enter the number of days that the system uses to rebuild the data when running incremental loads. The system starts with the current date and counts back the number of days specified to load data.
If this processing option is left blank, the system runs a full build.
3.3.12 Running the On-Time Shipment Promised Date Data Load Program (R80D211)
Enter BV in the Fast Path field, and then enter R80D211 in the Batch Application field.
The On-Time Shipment Promised Date Data Load program (R80D211) calculates the on-time, early, and late shipments for the date on which you run the program based on the customer-promised ship date. The system presents the metrics as percentages of the total order lines promised to ship during the date range. The date range and thresholds to delineate on-time are user-specified.
On-time shipments are sales-order lines for which the value in the Actual Ship Date field is equal to the value in the Promised Ship Date field. The system calculates the on-time shipment percentage for a specified date range as the number of order lines promised to ship that actually shipped on the promised date divided by the total number of order lines promised to ship.
Early shipments are sales-order lines for which the value in the Actual Ship Date field is less than the value in the Promised Ship Date field. The system calculates the early shipment percentage for a specified date range as the number of order lines promised to ship that actually shipped prior to the promised date divided by the total number of order lines promised to ship.
Late shipments are sales order lines for which the value in the Actual Ship Date field is greater than the value in the Promised Ship Date field. The system calculates the late shipment percentage for a specified date range as the number of order lines promised to ship that actually shipped after the promised date divided by the total number of order lines promised to ship. If the Actual Ship Date field contains no value and the value in the Promised Ship Date field is in the past, the system considers the sales order line to be late.
If you specify threshold days values in the processing options of the On-Time Shipment Promised Date Data Load program, the system adds or subtracts the value to the value in the Requested Ship Date field.
The system stores the calculated data in the On-Time Shipment Aggregate for Promise Date table (F80D211). You should schedule the On-Time Shipment Promised Date Data Load program to run daily to ensure the accuracy of the On-Time Shipment Aggregate for Promise Date table. If you do not run the program daily, the system calculates and stores records from the last date and time that you ran the program to the current date and time.
|
Note: You must run the Sales Order Fact Data Load program (R80D010) before the On-Time Shipment Promised Date Data Load program. |
3.3.13 Analyzing On-Time Shipments to Promise Date
Access the appropriate metric group on the Plant Manager's Dashboard form.
Customers expect suppliers to be reliable and predictable, and to consistently meet the commitments of product quality, price, and delivery. Committing to a shipment date is a key part of processing a customer sales order. The customer must agree to the promised ship date before an order is accepted. After that time, a manufacturer is responsible for shipping on the promised date. Because the manufacturer is suggesting the ship date to the customer, the On-Time Shipment to Promise Date should be extremely high, approaching 100 percent.
The On-Time Shipments to Promise Date metric reports on the actual performance against the commitments to customers. The On-Time Shipments to Promise Date metric is useful when you are reviewing the trend for a particular product family because the on-time shipment problems can be concentrated to one line of products that are experiencing production difficulties or other problems.
Poor performance indicates that the processes within the manufacturer are not predictable or well controlled, so the manufacturer has difficulty determining when products will ship. Poor on-time performance can drive customers to competitors as quickly as poor quality, so having consistently high on-time performance is critical.
The two On-Time Shipments to Promise Date metrics are:
-
On-Time Shipments to Promise Date Aggregate (sum).
-
On-Time Shipments to Promise Date Trend.
|
Note: You cannot define a goal value for On-Time Shipments to Promise Date Aggregate. |
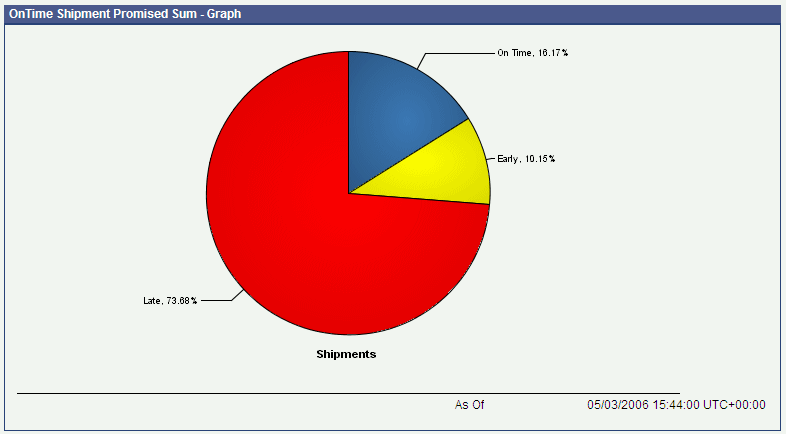
The system presents the On-Time Shipments to Promise Date Aggregate metric as a pie chart showing the shipment percentages for on-time, early, and late:
Figure 3-9 OnTime Shipment Promised Sum chart
Description of "Figure 3-9 OnTime Shipment Promised Sum chart"
The pie chart appears with the on-time shipment percentage, the early shipment percentage, and the late shipment percentage in different colors. Percentages are rounded based on the data, and the three percentages may not be equal to 100.
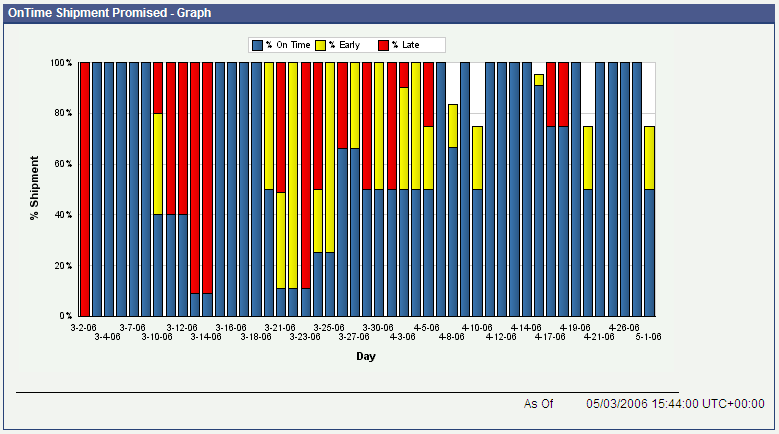
The system presents the On-Time Shipments to Promise Date Trend metric as a stacked bar chart that shows the shipment percentages (Y axis) for a specified date range (X axis):
Figure 3-10 OnTime Shipment Promised chart
Description of "Figure 3-10 OnTime Shipment Promised chart"
The stacked bar chart appears with the on-time shipment percentage as the bottom segment, the early shipment percentage as the middle segment, and the late shipment percentage as the top segment. Percentages are rounded to the nearest whole number, and the three percentages must total 100.
The system does not display the periods for which no shipment activity occurred. The system does not leave open spaces in the chart.
You can define a goal value for On-Time Shipments to Promise Date Trend. You enter the goal as a single whole percentage that represents the target on-time percentage for the manufacturer. If the on-time percentage is not at or above the goal for a period, the system considers the goal breached. The system displays the goal as a single horizontal line on the chart.
3.3.14 Setting Processing Options for the Past Due Processing Program (R80D212)
Processing options enable you to specify the default processing for the Past Due Processing program.
3.3.14.1 Defaults
These processing options control the print output, the threshold days, and the number of days that the system uses to load data.
- 1. Level of Detail to Print
-
Specify whether the system prints a detailed report or errors only. Values are:
-
Blank: The system prints errors only.
-
1: The system prints a detailed report of the processed records and any errors that occurred.
-
- 2. Number of Threshold Days
-
Enter a number that denotes the threshold for considering orders past due. The system considers any order not shipped within the threshold days after the promised shipped date to be past due. The system considers any order shipped before the threshold days to be on time.
- 3. Number of Days to Rebuild UBE
-
Enter the number of days that the system uses to rebuild the data when running incremental loads. The system starts with the current date and counts back the number of days specified to load data.
If this processing option is left blank, the system runs a full build, which enables previous data to be captured for the Past Due Order line metrics.
3.3.15 Running the Past Due Processing Program (R80D212)
Enter BV in the Fast Path field, and then enter R80D212 in the Batch Application field.
The Past Due Processing program (R80D212) calculates the past-due sales order line amount and the number of past-due sales order lines. The date range and thresholds to delineate on-time are user-specified. The system stores the Past Due Order Line metric calculations in the Past Due Aggregate table (F80D212).
The system calculates the Past Due Order Line Count by counting the number of sales order lines that have a quantity remaining to be shipped and a promised ship date that is earlier than the current date.
The system calculates the Past Due Order Line Amount by summing the number of sales order lines that have an amount remaining to be shipped and a promised date that is earlier than the current date. The system calculates the Past Due Order Line Amounts for the day that the program is run. You should schedule the Past Due Processing program to run daily to ensure the accuracy of the Past Due Aggregate table.
If you specify the number of threshold days in the processing option of the Past Due Processing program, the system adds the value to the promised date.
|
Note: You must run the Sales Order Fact Data Load program (R80D010) before the Past Due Processing program. |
3.3.16 Analyzing Past Due Order Lines
Access the appropriate metric group on the Plant Manager's Dashboard form.
Past-due sales order lines are defined as those lines with a quantity remaining to be shipped with a promised shipped date before the current date. A past-due order represents a failure to meet the shipping commitment that was made to the customer. The effect of past-due orders is far ranging, such as customer satisfaction, timing of revenue recognition, and the time required to receive cash from the customer to recoup the investment of producing and shipping products. A manufacturer must be aware of the number of past-due orders, as well as the trend in how much of the backlog is past due.
Many factors can contribute to an increase in the number of past-due sales order lines. The manufacturer can have more sales orders than capacity can accommodate. A shortage of critical raw materials may limit the ability to produce the volume of products required to meet shipping commitments. Quality problems on the shop floor can reduce the quantity of goods or products that are available to ship or increase the amount of rework time, which delays the production of finished products.
The Past Due Order Lines metrics can direct the attention to areas within a manufacturer that are contributing to the increase in past dues. You should use the Past Due Order Lines metrics in conjunction with the On-Time Shipment metrics to locate prioritization issues on the shop floor. For example, if the On-Time Shipment metrics show a high number of early shipments while the Past Due Order Lines number is increasing, production managers may be selecting which orders to produce and are unaware of the past-due orders.
Consistently achieving 100 percent on-time shipment without shipping orders that are past due is possible. When this occurs, the Past Due Order Line trends are flat, while the On-Time Shipment metrics show 100 percent on-time. Therefore, the number of past due order lines are not getting reduced even though on-time shipments are 100 percent. Viewing the metrics together is critical to get an accurate picture of how the manufacturer is performing and how prioritization and scheduling decisions are made.
The two Past Due Order Line metrics are:
-
Past Due Order Line Count.
-
Past Due Order Line Amount.
The charts display whether the trend is going up or down for past-due orders.
|
Note: You cannot define a goal value for the Past Due Order Line Count metric. |
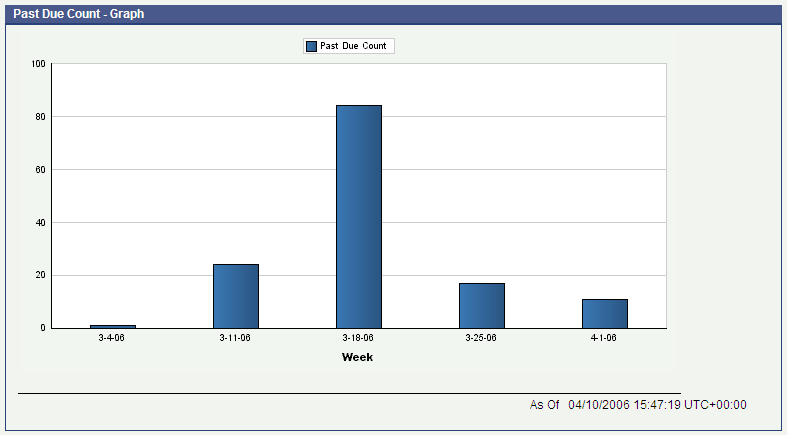
The system displays the Past Due Order Line Count metric as a bar chart that shows the number of sales order lines past due (Y axis) for a specified date range (X axis):
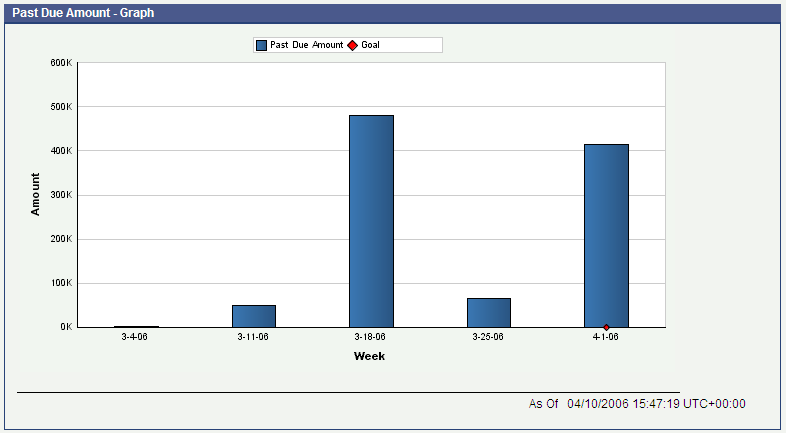
The system presents the Past Due Order Line Amount metric as a bar chart that shows the past-due sales-order amount value in the selected currency (Y axis) for a specified date range (X axis):
The system displays a zero value bar for the periods for which no past-due order line amount was found. The system does not leave open spaces in the chart.
You can define a goal value for the Past Due Order Line Amount. You enter the goal as a single number in the default currency that represents the maximum target sales value of past-due order lines for the manufacturer. If the Past Due Order Line Amount exceeds the goal value, the system considers the goal breached. The system displays the goal as a diamond marker for each bar on the chart.
3.3.17 Setting Processing Options for the Variance Processing Program (R80D214)
Processing options enable you to specify the default processing for the Variance Processing program.
3.3.17.1 Defaults
These processing options control the print output, the load type, the threshold percentage, and the number of sales order lines that the system requires to load data.
- 1. Level of Detail to Print
-
Specify whether the system prints a detailed report or errors only. Values are:
-
Blank: The system prints errors only.
-
1: The system prints a detailed report of the processed records and any errors that occurred.
-
- 2. Load Type
-
Specify whether the system runs an initial full load or an incremental load.
Values are:
-
Blank: Incremental load
The incremental load enables you to load records from the Sales Order Fact table (F80D010) that were added or changed since the last load to the Variance Aggregate table (F80D214).
-
1: Full load
The full load enables you to load all records from the Sales Order Fact table (F80D010) into the Variance Aggregate table (F80D214).
-
- 3. Variance Threshold Percentage
-
Specify the variance threshold percentage that the system uses to determine the promised date to request date variance. The system does not write the promise date to request date variances to the aggregate table when the values are less than the specified threshold percentage.
- 4. Minimum Number of Sales Order Lines
-
Specify the minimum number of sales-order detail lines that are required for the system to calculate the promise to request date variance. The system does not write records with less than the specified number of sales order lines to the aggregate table.
3.3.18 Running the Variance Processing Program (R80D214)
Enter BV in the Fast Path field, and then enter R80D214 in the Batch Application field.
The Variance Processing program (R80D214) calculates the variance between the promised ship date and the requested ship date by item for a specified date range. The system calculates the Promise to Request Date Variance percentage for a specified date range as the number of order lines for a product booked with a promised ship date that is later than the customer request date divided by the total number of order lines for a product booked. The system stores the calculated data in the Variance Aggregate table (F80D214).
You should schedule the Variance Processing program to run daily to ensure the accuracy of the Variance Aggregate table.
|
Note: You must run the Sales Order Fact Data Load program (R80D010) before the Variance Processing program. |
3.3.19 Analyzing the Promise to Request Date Variance
Access the appropriate metric group on the Plant Manager's Dashboard form.
The Promise to Request Date Variance metric records how often a manufacturer is unable to promise the shipment of a product on the customer request date. The inability to meet customer request dates indicates that the lead times of the manufacturer are too long for the market. The manufacturer can lose market share to competitors who can deliver products faster.
You should use the Promise to Request Date Variance metric along with the On-Time Shipment to Customer Request Date metric to determine the specific products that have lead times that are longer than required by the marketplace. If a manufacturer has a high late-shipment percentage, the metrics can help identify the affected products and undertake process improvement efforts to reduce lead times and align the products with marketplace expectations.
|
Note: The Promise to Request Date Variance metric does not allow you to define a goal. |
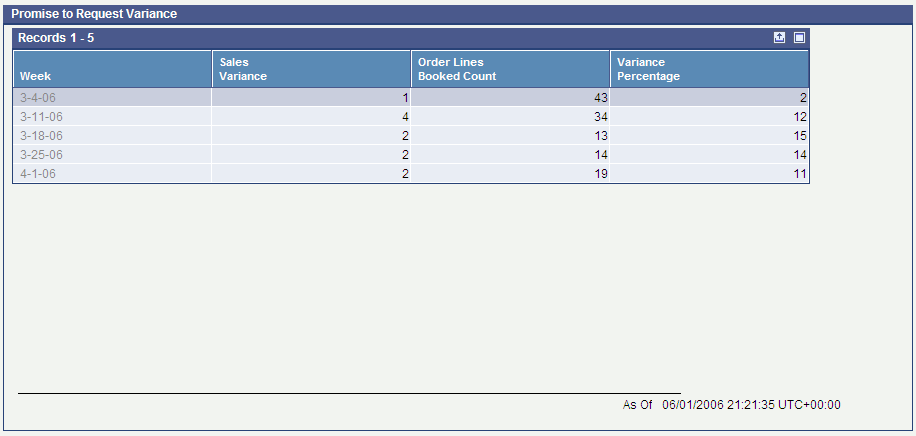
The system presents the Promise to Request Date Variance metric as a grid with a line for each item that has a variance that exceeds the threshold:
Figure 3-13 Promise to Request Variance grid
Description of "Figure 3-13 Promise to Request Variance grid"
3.4 Managing Inventory Effectiveness
This section provides an overview of inventory management effectiveness and discusses how to determine inventory turns.
3.4.1 Understanding Inventory Management Effectiveness
Most manufacturers recognize that excessive inventory is a liability, despite the fact that inventory is shown as an asset on the balance sheet. High inventories inhibit the performance of a manufacturer, so most manufacturers focus on keeping inventories as low as possible. The goal of many manufacturing companies is to drive more sales while maintaining lower levels of inventory to increase inventory turns.
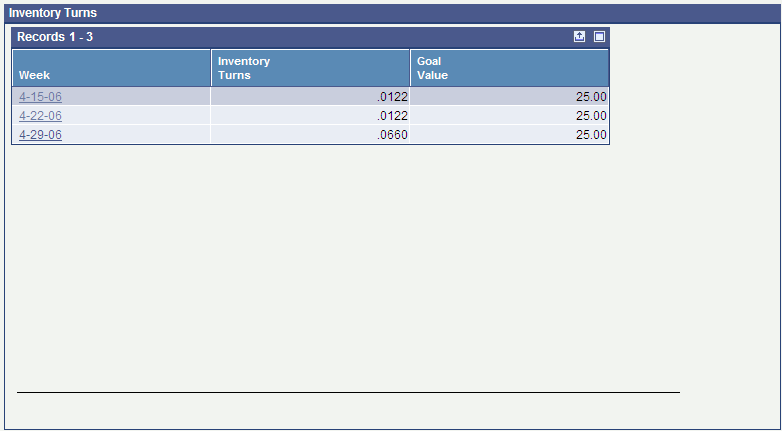
Inventory management effectiveness provides summary information about inventory turns. The system calculates the Inventory Turns value as:
=Last 52 weeks cost of goods soldTotal current inventory value
3.4.2 Determining Inventory Turns
Access the appropriate metric group on the Plant Manager's Dashboard form.
The Inventory Turns metric indicates how effectively the manufacturer is leveraging the investment in inventory to generate sales and profits. Typical manufacturing companies have six inventory turns per year whereas high volume, low margin manufacturers, such as grocery stores and computer assemblers, have 12 or more inventory turns per year.
One inventory turn indicates that the manufacturer is able to sell the current level of inventory once per year. If the current level of inventory is one million USD and the manufacturer has one turn per year, sales equals one million USD. If a manufacturer has 12 turns on one million USD of inventory, sales equals 12 million USD per year. The annual profit of a manufacturer is a multiple of the number of inventory turns per year and the net margin per inventory monetary unit.
The higher the inventory turns per year, the higher the return on inventory investment. Low inventory turns indicate that a large amount of capital is tied up in slow-moving inventory, while high inventory turns indicate that capital investments are providing a return in a short amount of time.
The system presents the Inventory Turns metric as a grid with a line for the current inventory turns, the inventory turns goal, and the difference between actual and goal:
You can define a goal value for Inventory Turns. You enter the goal as a number with one decimal place that represents the target number of inventory turns for the manufacturer. If the actual number of inventory turns exceeds the goal value, the system considers the goal breached. The system displays the goal as a single number in the Goal Value column.
3.5 Managing Manufacturing Performance
This section provides an overview of manufacturing performance and discusses how to:
-
Set processing options for the Manufacturing Planned versus Actual Cost Variance program (R80D231).
-
Run the Manufacturing Planned versus Actual Cost Variance program (R80D231).
-
Evaluate actual to planned production costs.
-
Set processing options for the Manufacturing On Time Completions program (R80D230).
-
Run the Manufacturing On Time Completions program (R80D230).
-
Calculate on-time production completions.
3.5.1 Understanding Manufacturing Performance
Manufacturing companies invest much time and energy developing and communicating production plans. Manufacturers need to understand the effect of not carrying out the production plans. Manufacturing performance provides information about the reliability of the manufacturing process. The metrics highlight poor production performance and internal production constraints.
This table describes the manufacturing performance metrics:
| Metric | Description |
|---|---|
| Actual to Planned Production Costs | Shows the ability of the manufacturer to produce according to the production plan in terms of cost. The actual production costs are calculated by adding the costs of all work orders for the specified date range. The planned production costs are calculated by adding the planned costs from all finished work orders that are scheduled for completion for the specified date range. |
| On-Time Production Completions | Measures the ability of the manufacturer to produce according to the production plan. The on-time production completion percentage for a specified date range is calculated as:
=Number of work orders planned to complete that actually completedTotal number of on time, early, and late work orders For early and late calculations, the numerator changes accordingly. |
3.5.2 Setting Processing Options for the Manufacturing Planned Versus Actual Cost Variance Program (R80D231)
Processing options enable you to specify the default processing for the Manufacturing Planned Versus Actual Cost Variance program.
3.5.2.1 Default
These processing options control the work order status and type.
- 1. Closed Work Order Status
-
Enter the closed manufacturing status code. The system will exclude the closed manufacturing work orders when processing on-time completions.
- 2. Enter Work Order Type
-
Enter the order type for manufacturing work orders that the system includes when processing planned versus actual completions.
You should not include rate schedules.
3.5.2.2 Process
These processing options control the load type and the number of days that the system uses to load data.
- 1. Build Level
-
Specify whether the system runs an initial full build or an incremental build. Values are:
-
Blank: Incremental build.
The incremental build enables you to load records from the Production Cost table (F3102) that were added or changed since the last build to the Manufacturing Production Costing table (F80D231).
-
1: Full build.
The full build enables you to build all records from the Production Cost table (F3102) into the Manufacturing Production Costing table (F80D231).
-
- 2. Enter Number of Days to Back Build
-
Enter the number of days that the system uses to rebuild the data when running an incremental load. The system starts with the current date and counts back the number of days specified to load data.
3.5.2.3 Display
This processing option controls the print output.
- 1. Level of Detail to Print
-
Specify whether the system prints a detailed report or errors only. Values are:
-
Blank: The system prints errors only.
-
1: The system prints a detailed report of the processed records and any errors that occurred.
-
3.5.3 Running the Manufacturing Planned Versus Actual Cost Variance Program (R80D231)
Enter BV in the Fast Path field, and then enter R80D231 in the Batch Application field.
The Manufacturing Planned vs. Actual Cost Variance program (R80D231) calculates the actual production costs by adding the costs of all work orders for the specified date range. The system calculates the planned production costs by adding the planned costs from all finished work orders that are scheduled for completion for the specified date range. The system stores the calculated data in the Manufacturing Production Costing table (F80D231).
|
Note: You must run manufacturing accounting to properly determine the production costs for an item. |
The system can update past metrics when running the Manufacturing Planned vs. Actual Cost Variance program. For example, if a purchase order was received at an incorrect price and later updated, the system would update the actual costs on the work order. The system updates the metric information when running the Manufacturing Planned vs. Actual Cost Variance program.
3.5.4 Evaluating Actual to Planned Production Costs
Access the appropriate metric group on the Plant Manager's Dashboard form.
The Actual to Planned Production Costs metric enables you to review the variance cost per unit between planned and actual. The Actual to Planned Production Costs metric indicates how well a manufacturer is doing in producing the volume of goods that are planned for production over a period of time. Plans for goods typically support the shipping requirements of the manufacturer, and the inability to consistently produce the required volume of goods can lead to various problems.
The Actual to Planned Production Costs metric focuses on the ability of the manufacturer to produce the required volumes of goods rather than performance to the production schedule. Most likely, the Actual to Planned Production Costs and On-Time Production Completions metrics will move in parallel; a decrease in on-time completions will likely be reflected in a decrease in goods production to plan.
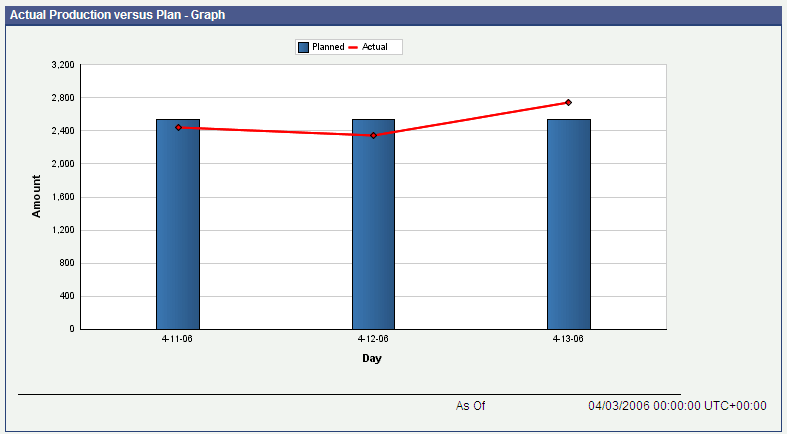
The system presents the Actual to Planned Production Costs metric as a combo chart with actual production in a bar chart format and planned production in line graph format. The chart depicts the cost of production in the selected currency (Y axis) for the specified date range (X axis):
Figure 3-15 Actual Production versus Plan chart
Description of "Figure 3-15 Actual Production versus Plan chart"
3.5.5 Setting Processing Options for the Manufacturing On Time Completions Program (R80D230)
Processing options enable you to specify the default processing for the Manufacturing On Time Completions program.
3.5.5.1 Default
These processing options control the threshold days.
- 1. Prior Threshold Days
-
Enter a number that denotes the threshold for considering work order completions on time. The system considers any order completed within the threshold days before the request date to be on time. The system considers any order completed before the threshold days to be early.
- 2. After Threshold Days
-
Enter a number that denotes the threshold for considering work order completions on time. The system considers any order completed within the threshold days after the request date to be on time. The system considers any order completed after the threshold days to be late.
3.5.5.2 Process
These processing options control the load type and work order type and status.
- 1. Build Level
-
Specify whether the system runs an initial full load or an incremental load. Values are:
-
Blank: Incremental load.
The incremental load enables you to load records from the F80D010 table that were added or changed since the last load to the On Time Manufacturing Production Completions table (F80D230).
-
1: Full load.
The full load enables you to load all records into the On Time Manufacturing Production Completions table (F80D230) table.
-
- 2. Manufacturing Work Order Type
-
Enter the order type for manufacturing work orders that the system includes when processing on-time completions.
You should not include rate schedules.
- 3. Cancelled Manufacturing Work Order Status
-
Enter the canceled manufacturing status code. The system excludes the canceled manufacturing work orders when processing on-time completions.
3.5.5.3 Display
This processing option controls the print output.
- 1. Level of Detail to Print
-
Specify whether the system prints a detailed report or errors only. Values are:
-
Blank: The system prints errors only.
-
1: The system prints a detailed report of the processed records and any errors that occurred.
-
3.5.6 Running the Manufacturing On Time Completions Program (R80D230)
Enter BV in the Fast Path field, and then enter R80D230 in the Batch Application field.
The Manufacturing On Time Completions program (R80D230) calculates on-time, early, and late completion counts for a user-specified date range. The date range and thresholds to delineate on-time are user-specified. The system calculates the on-time completions from the last date that you ran the program to the current date. The system stores the calculated data in the On Time Manufacturing Production Completions table (F80D230). You should schedule the program to run daily to keep the On Time Manufacturing Production Completions table accurate.
On-time completions are those work orders for which the value in the Actual Completion Date field is equal to the value in the Planned Completion Date field. The system calculates the On-Time Production Completions percentage for a specified date range as the number of work orders that were planned to finish that actually finished between the prior and after threshold days of the planned date divided by the total number of work orders planned.
Early completions are those work orders for which the value in the Actual Completion Date field is less than the value in the Planned Completion Date field. The system calculates the early production completion percentage for a specified date range as the number of work orders that were planned to finish that actually finished before the prior threshold days of the planned date divided by the total number of work orders planned.
Late completions are those work orders for which the value in the Actual Completion Date field is greater than the value in the Planned Completion Date field. The system calculates the late production completion percentage for a specified date range as the number of work orders that were planned to finish that actually finished later than the after threshold days of the planned date divided by the total number of work orders planned. If no value in the Actual Completion Date field and the value in the Planned Completion Date field is in the past, the system considers the work order late.
If you specify threshold days values in the processing options of the Manufacturing On Time Completions program, the system adds or subtracts the value to the value in the Planned Completion Date field.
|
Note: The system excludes workorderless completions from the On-Time Production Completions metric.You should not include rate schedules. |
3.5.7 Calculating On-Time Production Completions
Access the appropriate metric group on the Plant Manager's Dashboard form.
A manufacturer cannot ship what has not yet been produced. The ability to produce according to plan directly affects the ability to ship on-time and keep customers satisfied. A manufacturer must be able to determine how frequently planned production is completed on-time, early, and late. Consistently missing the production plan goals interferes with satisfying customers without maintaining high inventory amounts to protect against poor production performance. Poor on-time production performance can be a root cause for poor shipment performance and excessive finished goods inventories. The On-Time Production Completions metric measures the ability of the manufacturer to produce according to the production plan and satisfy market demands.
Poor On-Time Production Completions performance can indicate that the manufacturer is internally constrained, and that not enough capacity is available to meet market demand. A review of the Booked Order Value and Shipped Revenue trends for product families can point out increasing demand for products that is pushing the capacity limit for the manufacturer. If On-Time Production Completions are poor, but On-Time Shipments are acceptable, the manufacturer should review the Inventory Turns metric. A review of the Inventory Turns metric can indicate that turns are well below goal levels, indicating that the manufacturer is holding too much finished-goods inventory to cover the poor production performance.
Late and early production completions can indicate that the production managers are grouping orders for similar products together to minimize shop-floor setup times, or production can be focusing on completing easy orders first to meet production quantity targets.
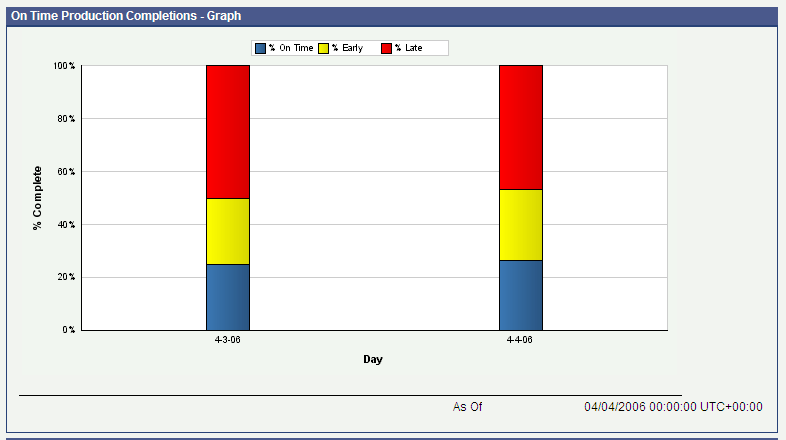
The system presents the On-Time Production Completions metric as a stacked bar chart that depicts the percentages (Y axis) for a specified date range (X axis):
Figure 3-16 On Time Production Completions chart
Description of "Figure 3-16 On Time Production Completions chart"
The stacked bar chart appears with the on-time completion percentage as the bottom segment, the early completion percentage as the middle segment, and the late completion percentage as the top segment. The system rounds percentages to the nearest whole number, and the total of the three percentages must equal 100.
The system does not display the periods for which no production activity occurred.
You can define a goal value for On-Time Production Completions. You enter the goal as a single whole percentage that represents the target on-time completion percentage for the manufacturer. If the on-time completion percentage exceeds the goal value, the system considers the goal breached. The system displays the goal as a single horizontal line on the chart.
3.6 Managing Revenue
This section provides an overview of revenue management and discusses how to:
-
Set processing options for the Booked Orders Aggregate Data Load program (R80D240).
-
Run the Booked Orders Aggregate Data Load program (R80D240).
-
Analyze booked order value.
-
Set processing options for the Backlog Processing program (R80D243).
-
Run the Backlog Processing program (R80D243).
-
Analyze backlog.
-
Set processing options for the Projected Revenue Processing program (R80D242).
-
Run the Projected Revenue Processing program (R80D242).
-
Analyze projected revenue.
-
Set processing options for the Shipped Orders Processing program (R80D241).
-
Run the Shipped Orders Processing program (R80D241).
-
Analyze shipped revenue.
3.6.1 Understanding Revenue Management
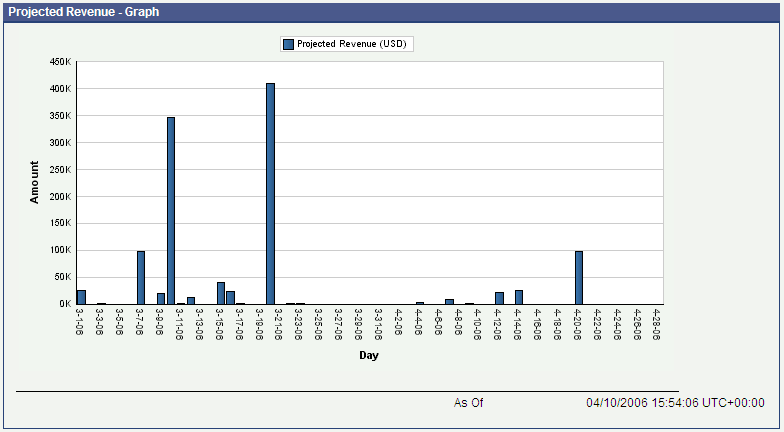
Revenue management provides greater business insight related to future cash receipts and overall revenue performance. Revenue management is important to the overall health of a manufacturer.
The revenue management metrics are rough predictors of cash flow, showing which product families contribute the most to overall revenue and determining the possible strains in production or shipping capacity.
This table describes the revenue management performance metrics:
| Metric | Description |
|---|---|
| Booked Order Value | Reveals the amount of revenue being brought into the manufacturer through new sales orders. The Booked Order Value for a specific sales order is calculated by summing the extended sales amount from each line on the sales order. |
| Backlog | Shows the total sales value of all open sales orders yet to be shipped. The Backlog value for a specific sales order is calculated by summing the extended sales value from each open, unshipped line on the sales order. |
| Projected Revenue | Estimates the revenue expected to be recognized over the period defined by the manufacturer and provides a rolling periodic view of revenue projections. Shows the amount of revenue associated with past due sales orders that have yet to ship. The Projected Revenue value for a specific date is calculated by adding the total sales value of all sales orders promised to ship on that date. |
| Shipped Revenue | Illustrates the value of recognized revenue. The Shipped Revenue value for a specific date is calculated by adding the total shipped revenue for all sales orders that are shipped on that date |
3.6.2 Setting Processing Options for the Booked Orders Aggregate Data Load Program (R80D240)
Processing options enable you to specify the default processing for the Booked Orders Aggregate Data Load program.
3.6.2.1 Defaults
These processing options control the print output and load type.
- 1. Level of Detail to Print
-
Specify whether the system prints a detailed report or errors only. Values are:
-
Blank: The system prints errors only.
-
1: The system prints a detailed report of the processed records and any errors that occurred.
-
- 2. Load Type
-
Specify whether the system runs an initial full load or an incremental load. Values are:
-
Blank: Incremental load.
The incremental load enables you to load records from the Sales Order Fact table (F80D010) that were added or changed since the last load to the Booked Orders Aggregate table (F80D240).
-
1: Full load.
The full load enables you to load all records from the Sales Order Fact table (F80D010) into the Booked Orders Aggregate table (F80D240).
-
3.6.3 Running the Booked Orders Aggregate Data Load Program (R80D240)
Enter BV in the Fast Path field, and then enter R80D240 in the Batch Application field.
The Booked Orders Aggregate Data Load program (R80D240) calculates the booked order value for each day by adding the extended prices of each open sales order line. The system calculates the booked order value for a specific sales order by adding the extended sales amount from each line on the sales order, including all adjustments and other charges. The system populates the Booked Orders Aggregate table (F80D240) using the creation date of the sales order as the booked date.
You should schedule the Booked Orders Aggregate Data program to run daily to ensure the accuracy of the Booked Orders Aggregate table. If you do not run the Booked Orders Aggregate Data program daily, the metric is accurate as of the last run.
|
Note: You must run the Sales Order Fact Data Load program (R80D010) before the Booked Orders Aggregate Data program. |
3.6.4 Analyzing Booked Order Value
Access the appropriate metric group on the Plant Manager's Dashboard form.
A booked sales order is any sales order created in JD Edwards EnterpriseOne and not canceled or deleted. The Booked Order Value metric is useful when you are reviewing the trend for a particular product family or when determining which products are contributing the most to recent sales for a business unit by grouping orders by product family. Booked Order Value results from creating sales orders; therefore, the Booked Order Value also serves as a predictor of cash flow into the manufacturer. The length of time that the manufacturer takes to receive cash payment for a new sales order depends on how long the manufacturer takes to ship the product plus any payment term days. On a given day, the total backlog for the manufacturer increases by the value of booked orders for that day.
The Booked Order Value metric trend reveals the amount of revenue being brought into the manufacturer from new sales orders over a period of time. An increasing trend may result from the introduction of a successful new product or the effect of a new sales campaign. A decreasing trend may reflect a shift in market tastes away from the manufacturer's products or the effect of seasonal cycles.
|
Note: You cannot define a goal for the Booked Order Value metric. |
The system presents the Booked Order Value metric as a bar chart showing the booked order sales value in the selected currency (Y axis) for a specified date range (X axis):
3.6.5 Setting Processing Options for the Backlog Processing Program (R80D243)
Processing options enable you to specify the default processing for the Backlog Processing program.
3.6.5.1 Defaults
These processing options control the print output and load type.
- 1. Level of Detail to Print
-
Specify whether the system prints a detailed report or errors only. Values are:
-
Blank: The system prints errors only.
-
1: The system prints a detailed report of the processed records and any errors that occurred.
-
- 2. Load Type
-
Specify whether the system runs an initial full load or an incremental load. Values are:
-
Blank: Incremental load.
The incremental load enables you to load records from the Sales Order Fact table (F80D010) that were added or changed since the last load to the Backlog Aggregate table (F80D243).
-
1: Full load.
The full load enables you to load all records from the Sales Order Fact table (F80D010) into the Backlog Aggregate table (F80D243).
-
3.6.6 Running the Backlog Processing Program (R80D243)
Enter BV in the Fast Path field, and then enter R80D243 in the Batch Application field.
The Backlog Processing program (R80D243) calculates the backlog value for each day by adding the extended prices of each order that is yet to be shipped. The system calculates the backlog value for a specific sales order by adding the extended sales amount from each unshipped line on the sales order, including all adjustments and other charges. The system calculates the total backlog by adding the backlog value of all open, unshipped sales orders for the specified date range.
You should schedule the Backlog Processing program to run daily to ensure the accuracy of the Backlog Aggregate table. If you do not run the Backlog Processing program daily, the metric is accurate as of the last run. The system calculates and stores the total backlog by company, branch/plant, and product family in the Backlog Aggregate table (F80D243).
|
Note: You must run the Sales Order Fact Data Load program (R80D010) before the Backlog Processing program. |
3.6.7 Analyzing Backlog
Access the appropriate metric group on the Plant Manager's Dashboard form.
Backlog is defined as the total sales value of all open sales orders yet to be shipped. The backlog represents total revenue that will be generated from existing unfilled sales orders.
Understanding the status of the backlog is of critical importance to manufacturers. The backlog shows the total potential revenue represented by all the unfilled sales orders currently on the books. While revenue forecasts show the manufacturer's expected revenue, the backlog records the manufacturer's actual revenue because the orders have already been placed. The value of the backlog is one factor that analysts track to measure overall health of a manufacturer.
The Backlog metric can provide value when viewed in isolation. Reviewing the Backlog metric along with the Booked Orders, Shipped Revenue, and On-Time Shipment metrics provides a more complete picture of the dynamic effect of sales and shipping activities on the manufacturer.
The backlog changes daily; it increases by the value of new sales orders booked on that day, and it decreases by the value of sales orders shipped on that day.
A growing backlog may cause problems that prevent the timely shipment of products to customers. Using the Backlog metric along with the On-Time Shipment to Promise Date metric can help identify the reasons for a growing backlog. A sharp increase in backlog can be an early warning signal to a manufacturer that new orders are not shipping on time. Managers can actively plan for additional shifts during a high shipping period, or they can outsource production work to a contract manufacturer. Analyzing the current Backlog metric can identify periods of unusually high shipping requirements.
Significant decreases in the backlog can occur if sales order bookings fall off sharply or if an effort is made to ship all possible orders at the end of a financial reporting period to maximize recognized revenue in that period.
|
Note: You cannot define a goal for the Backlog metric. |
The system displays the Backlog metric as a bar chart that shows the total revenue amount in the selected currency (Y axis) for a specified date range (X axis):
3.6.8 Setting Processing Options for the Projected Revenue Processing Program (R80D242)
Processing options enable you to specify the default processing for the Projected Revenue Processing program.
3.6.8.1 Defaults
These processing options control the print output and load type.
- 1. Level of Detail to Print
-
Specify whether the system prints a detailed report or errors only. Values are:
-
Blank: The system prints errors only.
-
1: The system prints a detailed report of the processed records and any errors that occurred.
-
- 2. Load Type
-
Specify whether the system runs an initial full load or an incremental load. Values are:
-
Blank: Incremental load.
The incremental load enables you to load records from the Sales Order Fact table (F80D010) that were added or changed since the last load to the Projected Revenue Value Aggregate table (F80D242).
-
1: Full load.
The full load enables you to load all records from the Sales Order Fact table (F80D010) into the Projected Revenue Value Aggregate table (F80D242).
-
3.6.8.2 Process
This processing option controls the number of days that the system uses to display data.
- 1. Number of Days in Projection
-
Enter the number of days into the future that the system displays the projected revenue. The default value is 30 days.
3.6.9 Running the Projected Revenue Processing Program (R80D242)
Enter BV in the Fast Path field, and then enter R80D242 in the Batch Application field.
The Projected Revenue Processing program (R80D242) calculates the projected revenue for each day by adding the extended prices of each sales order line that is promised to be shipped that day. The system calculates the projected revenue for a single sales order by adding the extended sales amount from each line, including all adjustments and other charges, on the sales order. The system calculates the projected revenue for a specific date by adding the total sales value of all sales orders promised to ship on that date. The system calculates the past-due revenue by adding the total sales value of all sales orders promised to ship on a date previous to the generation date of the metric.
The system uses the promised ship date for each sales order detail line as the projected revenue recognition date. The system stores the calculated data in the Projected Revenue Value Aggregate table (F80D242). You should schedule the Projected Revenue Processing program to run daily to ensure the accuracy of the Projected Revenue Value Aggregate table.
|
Note: You must run the Sales Order Fact Data Load program (R80D010) before the Projected Revenue Processing program. |
3.6.10 Analyzing Projected Revenue
Access the appropriate metric group on the Plant Manager's Dashboard form.
Projected revenue estimates the revenue that is expected to be recognized over a specified time frame. Typically, a manufacturer uses a rolling quarterly view of revenue projections. Projected revenue includes the amount of revenue associated with past-due sales orders that have yet to be shipped.
The attention of the manufacturer should first focus on the past-due revenue amount. If past-due revenue amounts are high, the manufacturer is failing to meet the commitments to ship orders on time to customers. Past-due sales orders not only lead to unsatisfied customers, they also delay revenue recognition and receipt of cash, which can jeopardize the cash flow health of the manufacturer. The analysis of On-Time Shipment metrics can enable a manufacturer to pinpoint problems shipping products to customers.
The Backlog metric shows the total revenue potential of all sales orders that are currently recorded on the books. The Projected Revenue metric spreads the expected revenue over the user-specified time period. The metric shows when revenue is recognized for orders that ship in the time period.
The Projected Revenue metric displays spikes in projected revenue for certain weeks and dips in projected revenue for other weeks. The spikes and dips correlate to higher and lower levels of shipping activity. Spikes can indicate weeks during which production and shipping capacity are strained, which enables the manufacturer to plan ahead for the production of orders in weeks during which activity appears to be lower.
|
Note: You cannot define a goal for the Projected Revenue metric. |
The system presents the Projected Revenue metric as a bar chart that shows the projected revenue value in the selected currency (Y axis) for a specified date range (X axis). The first bar in the chart represents past-due revenue:
3.6.11 Setting Processing Options for the Shipped Orders Processing Program (R80D241)
Processing options enable you to specify the default processing for the Shipped Orders Processing program.
3.6.11.1 Defaults
These processing options control the print output and load type.
- 1. Level of Detail to Print
-
Specify whether the system prints a detailed report or errors only. Values are:
-
Blank: The system prints errors only.
-
1: The system prints a detailed report of the processed records and any errors that occurred.
-
- 2. Load Type
-
Specify whether the system runs an initial full load or an incremental load. Values are:
-
Blank: Incremental load.
The incremental load enables you to load records from the Sales Order Fact table (F80D010) that were added or changed since the last load to the Shipped Order Value Aggregate table (F80D241).
-
1: Full load.
The full load enables you to load all records from the Sales Order Fact table (F80D010) into the Shipped Order Value Aggregate table (F80D241).
-
3.6.12 Running the Shipped Orders Processing Program (R80D241)
Enter BV in the Fast Path field, and then enter R80D241 in the Batch Application field.
The Shipped Orders Processing program (R80D241) calculates the shipped revenue for a specific sales order by adding the extended sales value from each line on the sales order that has an actual ship date. The system calculates the shipped revenue for a specific date by adding the total shipped revenue for all sales orders that were shipped on that date and stores the value in the Shipped Order Value Aggregate table (F80D241). You should schedule the Shipped Orders Processing program to run daily to ensure the accuracy of the Shipped Order Value Aggregate table.
|
Note: You must run the Sales Order Fact Data Load program (R80D010) before the Shipped Orders Processing program. |
3.6.13 Analyzing Shipped Revenue
Access the appropriate metric group on the Plant Manager's Dashboard form.
Shipped revenue should trail booked order values by roughly the length of time that the manufacturer takes to ship products after the order date. The longer a manufacturer takes to ship, the longer the period between order receipt and revenue recognition; therefore, the manufacturer receives payment later. The longer the period of time between order receipt and shipment, the more capital a manufacturer ties up in inventory and accounts receivable.
The Shipped Revenue metric is useful when you are reviewing the trend for a particular product family or determining which products are contributing the most to the overall revenue for a business unit by grouping shipped revenue by product family. For manufacturers that recognize revenue when products are shipped, the Shipped Revenue metric illustrates the recognized revenue over a period of time.
On a given day, a manufacturer's total backlog decreases by the value of Shipped Revenue for that day.
The system includes all shipped sales order lines with an actual ship date in the shipped order revenue calculation.
|
Note: You cannot define a goal for the Shipped Revenue metric. |
The system presents the Shipped Revenue metric as a bar chart that shows the shipped order revenue in the selected currency (Y axis) for a specified date range (X axis):
3.7 Managing Supplier Performance
This section provides an overview of supplier performance and discusses how to:
-
Set processing options for the Material Lead Time Exception program (R80D251).
-
Run the Material Lead Time Exception program (R80D251).
-
Analyze material lead time exceptions.
-
Set processing options for the Supplier On-Time Delivery program (R80D250).
-
Run the Supplier On-Time Delivery program (R80D250).
-
Analyze on-time delivery.
-
Set processing options for the Supplier Pass Quality Performance program (R80D252).
-
Run the Supplier Pass Quality Performance program (R80D252).
-
Analyze pass quality.
3.7.1 Understanding Supplier Performance
Just as customers demand reliability and quality products from the manufacturer, a manufacturer must demand the same from suppliers. If a manufacturer wants to improve service to customers, the same expectations should be applied to suppliers. Supplier performance metrics can directly affect customer shipment performance.
The supplier performance metrics provide summary and detailed information about supplier performance. The metrics draw attention to suppliers whose quality performance is in question, identify suppliers who frequently fail to deliver material on time, and indicate whether supplier lead times are increasing.
Supplier performance consists of these performance metrics:
| Metric | Description |
|---|---|
| Material Lead Time Exception | Compares the stored lead time with the actual lead time experienced for items over a time period. The actual lead time for a specified date range for items is calculated by subtracting the date that the purchase order was entered for the supplier from the actual receipt date. The actual lead time is then summed over the user-specified date range to get an average. |
| On Time Delivery | Measures the reliability of the delivery schedules and order quantities of the supplier. The on time delivery percentage for a specified date range is calculated as:
= Number of receipts planned to receive that were actually receivedTotal number of on time, early, and late receipts For early and late calculations, the numerator changes accordingly. |
| Pass Quality Trend | Shows how well suppliers are meeting quality requirements. The quality pass percentage is calculated as:
= Quantity received into inventoryTotal quantity received from supplier |
|
Note: You should exclude blanket purchase orders and requisitions from the supplier performance metrics. |
3.7.2 Setting Processing Options for the Material Lead Time Exception Program (R80D251)
Processing options enable you to specify the default processing for the Material Lead Time Exception program.
3.7.2.1 Defaults
These processing options control the print output, the threshold days and display, the number of receipts that the system requires to display data, and the number of days that the system uses to load data.
- 1. Level of Detail to Print
-
Specify whether the system prints a detailed report or errors only. Values are:
-
Blank: The system prints errors only.
-
1: The system prints a detailed report of the processed records and any errors that occurred.
-
- 2. Lead Time Tolerance Days Before
-
Enter a number that denotes the threshold for considering supplier lead time exceptions. The system considers any supplier shipment with an actual calculated lead time smaller than the system lead time minus the tolerance days to be an exception.
- 3. Lead Time Tolerance Days After
-
Enter a number that denotes the threshold for considering supplier lead time exceptions. The system considers any supplier shipment with an actual calculated lead time greater than the system lead time plus the tolerance days to be an exception.
- 4. Exception Threshold
-
Specify the threshold level for lead time exceptions that the system displays. The system displays items when the number of material lead time exceptions exceeds the threshold.
- 5. Minimum Number of Receipts
-
Specify the minimum number of receipts that are required for the system to calculate the lead time exceptions for an item. The system does not create records for items with less than the specified number of receipts.
- 6. Number of Days for UBE Rebuild
-
Enter the number of days that the system uses to rebuild the data when running incremental loads. The system starts with the current date and counts back the number of days specified to load data.
If this processing option is left blank, the system runs a full build.
3.7.3 Running the Material Lead Time Exception Program (R80D251)
Enter BV in the Fast Path field, and then enter R80D251 in the Batch Application field.
The Material Lead Time Exception program (R80D251) evaluates data from the Purchase Order Detail File table (F4311) and calculates the actual lead time for a specified date range for items by subtracting the purchase order entry date from the actual receipt date. The system then sums the actual lead time over the user-specified date range to get an average. The system stores the calculated data in the Material Lead Time Exception Aggregate table (F80D251). The system calculates material lead time exceptions for fully received purchase orders only; therefore, a value must be entered in the Actual Receipt Date field.
3.7.4 Analyzing Material Lead Time Exceptions
Access the appropriate metric group on the Plant Manager's Dashboard form.
The Material Lead Time Exceptions metric compares the system-defined lead time with the actual lead time experienced over a period of time. The system determines the actual lead time for each purchased material by counting the days between the placement of a purchase order and receipt of materials. The system determines how frequently the actual lead time varies from the system lead time by more than a certain number of days. Results are shown by supplier, with suppliers having the greatest number of variances listed first.
Material planning systems help manufacturers define the materials to purchase, quantities required, and order placement with suppliers. One of the factors in material planning is lead time for acquiring products from suppliers. The system stores the number of lead time days as part of the item master information for purchased materials.
If the system lead time varies significantly from the actual lead time, the planning system recommends invalid purchase order dates. If the system lead time is shorter than the actual lead time, the manufacturer runs the risk of receiving materials late and experiencing material shortages. If the system lead time is longer than the actual lead time, the manufacturer orders materials early and increases inventory levels.
Using the information provided by the Material Lead Time Exceptions metric, managers can adjust system lead times to accurately reflect the actual lead times from suppliers. The metric can indicate the suppliers whose lead times are getting longer due to lack of capacity, quality problems, or other issues. The system cannot answer why lead times are growing, but the manager can focus on potential problems and search for the underlying reasons.
|
Note: You cannot define a goal for the Material Lead Time Exceptions metric. |
The system presents the Material Lead Time Exceptions metric as a grid with a line for each item for which the material lead time exception variance exceeds the specified threshold:
Figure 3-21 Material Lead Time Exceptions grid
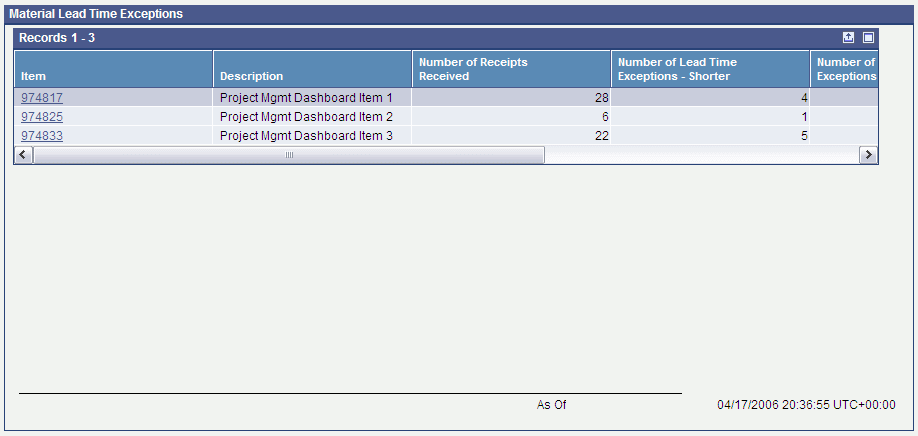
Description of "Figure 3-21 Material Lead Time Exceptions grid"
3.7.5 Setting Processing Options for the Supplier On-Time Delivery Program (R80D250)
Processing options enable you to specify the default processing for the Supplier On-Time Delivery program.
3.7.5.1 Defaults
These processing options control the threshold days and the number of days that the system uses to load data.
- 1. Threshold Days Prior
-
Enter a number that denotes the threshold for considering supplier deliveries to be on time. The system considers any order delivered within the threshold days before the request date to be on time. The system considers any order delivered before the threshold days to be early.
The system does not allow threshold days prior to be set up for individual suppliers and items. The threshold days apply to all purchase order records that the system processes.
- 2. Threshold Days After
-
Enter a number that denotes the threshold for considering supplier deliveries on time. The system considers any order delivered within the threshold days after the request date to be on time. The system considers any order delivered after the threshold days to be late.
The system does not allow threshold days after to be set up for individual suppliers and items. The threshold days apply to all purchase order records that the system processes.
- 3. Number of Days to Rebuild
-
Enter the number of days that the system uses to rebuild the data when running incremental loads. The system starts with the current date and counts back the number of days specified to load data.
If this processing option is left blank, the system runs a full build.
3.7.5.2 Display
This processing option controls the print output.
- 1. Level of Detail to Print
-
Specify whether the system prints a detailed report or errors only. Values are:
-
Blank: The system prints errors only.
-
1: The system prints a detailed report of the processed records and any errors that occurred.
-
3.7.6 Running the Supplier On-Time Delivery Program (R80D250)
Enter BV in the Fast Path field, then enter R80D250 in the Batch Application field.
The Supplier On-Time Delivery program (R80D250) evaluates records in the Purchase Order Detail File table (F4311), calculates the on-time, early, and late delivery counts for a user-specified date range, and stores the values in the Supplier On-Time Delivery Aggregate table (F80D250). The date range and thresholds to delineate on-time are user-specified. The Dashboard program (P80D350) uses the data from the Supplier On-Time Delivery Aggregate table instead of accessing the data directly from the Purchase Order Detail File table for performance reasons; therefore, you should run the Supplier On-Time Delivery program daily.
On-time deliveries are those shipments for which the value in the Actual Receipt Date field is equal to the value in the Requested Receipt Date field. The system calculates the on-time delivery percentage for a specified date range as the number of receipts planned that were actually received on the planned date divided by the total number of receipts.
Early deliveries are shipments for which the value in the Actual Receipt Date field is less than the value in the Requested Receipt Date field. The system calculates the early delivery percentage for a specified date range as the number of receipts planned that were actually received before the planned date divided by the total number of receipts.
Late deliveries are shipments for which the value in the Actual Receipt Date field is greater than the value in the Requested Receipt Date field. The system calculates the late delivery percentage for a specified date range as the number of receipts planned that were actually received later than the planned date divided by the total number of receipts. If no value is in the Actual Receipt Date field and the value in the Requested Receipt Date field is in the past, the system considers the delivery late.
If you specify threshold days values in the processing options of the Supplier On-Time Delivery program, the system adds or subtracts the value to the value in the Requested Receipt Date field.
3.7.7 Analyzing On-Time Delivery
Access the appropriate metric group on the Plant Manager's Dashboard form.
Manufacturers plan acquisitions of materials to coincide with production schedules. Manufacturers do not want to hold extra raw materials in inventory or run short of critical materials. A key part of effective supply chain management is the relationship between manufacturer and supplier. If a supplier is unable to live up to delivery commitments, the manufacturer will be forced to seek alternative sources for raw materials. Suppliers must be reliable in terms of delivering materials on schedule; early deliveries are not desirable because they increase the average inventory levels. Some manufacturers penalize suppliers for failure to deliver on time.
The On-Time Delivery metric focuses on suppliers who frequently fail to deliver materials on time. The system provides supplier delivery performance for a user-specified range of dates.
|
Note: You cannot define a goal for the On-Time Delivery metric. |
The system displays the On-Time Delivery metric as a grid with a line for each supplier whose delivery performance falls below the specified percentage:
Figure 3-22 Supplier On Time Delivery grid
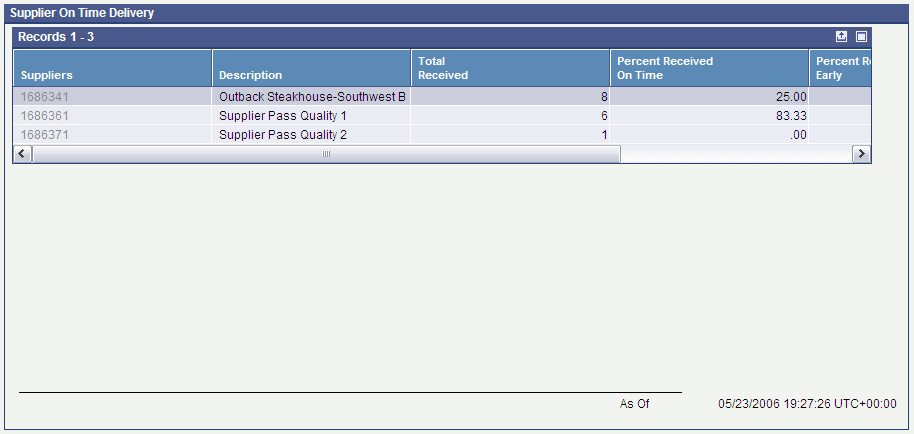
Description of "Figure 3-22 Supplier On Time Delivery grid"
3.7.8 Setting Processing Options for the Supplier Pass Quality Performance Program (R80D252)
Processing options enable you to specify the default processing for the Supplier Pass Quality Performance program.
3.7.8.1 Process
These processing options control the threshold level and number of days that the system uses to load data.
- 1. Pass Quality Threshold
-
Enter a number that denotes the threshold for considering supplier quality acceptable. The system considers any supplier quality within the threshold range acceptable.
- 2. Number of Days to Rebuild
-
Enter the number of days the system uses to rebuild the data when running incremental loads. The system starts with the current date and counts back the number of days specified to load data.
If this processing option is left blank, the system runs a full build.
3.7.8.2 Display
This processing option controls the print output.
- 1. Level of Detail to Print
-
Specify whether the system prints a detailed report or errors only. Values are:
-
Blank: The system prints errors only.
-
1: The system prints a detailed report of the processed records and any errors that occurred.
-
3.7.9 Running the Supplier Pass Quality Performance Program (R80D252)
Enter BV in the Fast Path field, and then enter R80D252 in the Batch Application field.
The Supplier Pass Quality Performance program (R80D252) calculates the pass percentage for each purchase order receipt by taking the quantity put into inventory divided by the quantity received from the supplier. The system then counts the number of receipts for each supplier whose pass percentage falls below the user-defined threshold. The system stores the count in the Supplier Pass Quality Aggregate table (F80D252). The system calculates the pass percentage only for all receipts that result in material going into inventory. The system calculates Pass Quality for fully received purchase orders only; therefore, a value must be entered in the Actual Receipt Date field.
|
Note: The system uses receipt routing functionality when analyzing the quality performance of a supplier. |
3.7.10 Analyzing Pass Quality
Access the appropriate metric group on the Plant Manager's Dashboard form.
The Pass Quality metric trend enables manufacturers to analyze the materials received from suppliers and determine where the suppliers fail to meet quality requirements. Manufacturers order sufficient quantities of material to support production plans. Shortages of materials can disrupt production plans and put the ability to ship on-time to customers at risk.
Pass Quality measures how frequently the manufacturer must reject a significant percentage of the materials received from a supplier. For example, if the manufacturer orders 100 units and receives 100 units, of which 10 are rejected for quality purposes, the pass quality percentage on the receipt is 90. Consistent supplier performance at the 90–percent level can be devastating to a manufacturer, especially if the supplier is the source of key raw materials. The pass percentage is the percentage of acceptable product received on a purchase order.
Inspecting material received from suppliers is very expensive for manufacturers, so consistent high quality is essential to reduce inspection time. The Pass Quality metric trend draws attention to suppliers whose quality performance is questionable. Managers can analyze which materials the supplier has the most problems with and take directed actions to solve the problems. If a supplier cannot improve quality problem areas, the manufacturer can change suppliers to get the desired quality.
|
Note: You cannot define a goal for the Pass Quality metric. |
The system presents the Pass Quality metric as a grid with a line for each supplier whose pass percentage has fallen below the threshold:
