4 Monitoring Financial Metrics
This chapter contains the following topics:
4.1 Understanding the JD Edwards EnterpriseOne Financial Management and Compliance Console Components
JD Edwards EnterpriseOne FMCC consists of metric groupings to measure financial performance:
| Metric Grouping | Metrics Within Grouping |
|---|---|
| Accounts Payable (AP) Activities | Counts and Amounts: The system displays the number and amount of the vouchers and payments entered each day.
Count and Amount of Open Liabilities: The system displays the number and amount of open vouchers and vouchers that are past due. Vouchers Paid Late Discount Information: The system displays the amount of discounts available, taken, and not taken on paid vouchers. The system also displays the percentage of discounts not taken compared to the gross amount vouchered. |
| Accounts Receivable (AR) and Collection Activities | Counts and Amounts: The system displays the number and amount of the invoices and receipts entered each day.
Count and Amount of Open Invoices: The system displays the number and amount of open invoices. Delinquency Information: The system displays the number and amount of past due invoices, as well as the amount of all delinquency fees and number of past-due invoices. Chargeback Information: The system displays the number and amount of all chargebacks and chargebacks by reason code. Discount Information: The system displays the amount and percentage of discounts not taken, earned discounts taken, and unearned discounts taken. Days Sales Outstanding (DSO): The system displays DSO by customer and company. |
| Activity Ratios | The system displays these activity ratios:
|
| Leverage and Liquidity Ratios | The system displays these leverage ratios:
The system displays these liquidity ratios:
|
| Profit | The system displays the actual and planned income, expense, and profit based on the actual and budget ledger types that you specify.
The system displays the expected cash flow according to the information that you provide from the JD Edwards EnterpriseOne Cash Forecasting system. |
| Profitability Ratios | The system displays these profitability ratios:
|
| Profitability Management | The system displays the most profitable customers, brands, and products in separate graphs. You must be using the JD Edwards EnterpriseOne Advanced Cost Accounting system (16) to display these metrics. |
| Revenue Trends | The system displays the revenue trends by customer, product, and brand. You must be using the JD Edwards EnterpriseOne Sales Order Management system (42) to display these metrics. |
| Unposted Transactions | The system displays the amount of vouchers and invoices not posted. Unposted transactions affect the cash flow. |
4.2 Understanding Automatic Accounting Instructions
JD Edwards EnterpriseOne FMCC uses the financial AAIs to determine the account ranges to use for the financial ratios. The system stores the AAIs in the Automatic Accounting Instruction Master table (F0012).
You must set up AAI items according to your chart of accounts before you run the batch programs to load the G/L Balances Fact table (F80D020). This table lists the AAI information that is shipped with the JD Edwards EnterpriseOne FMCC system:
| Item Number | Description | Company | Object Account |
|---|---|---|---|
| F01 | Beginning Assets | 00000 | 1000 |
| F02 | Beginning Accounts Receivable | 00000 | 1200 |
| F03 | Ending Accounts Receivable | 00000 | 1299 |
| F04 | Beginning Inventory | 00000 | 1400 |
| F05 | Ending Inventory | 00000 | 1499 |
| F06 | Ending Current Assets | 00000 | 1999 |
| F07 | Beginning Fixed Assets | 00000 | 2000 |
| F08 | Ending Fixed Assets | 00000 | 2999 |
| F09 | Ending Assets | 00000 | 3999 |
| F10 | Beginning Liabilities | 00000 | 4000 |
| F11 | Ending Current Liabilities | 00000 | 4599 |
| F12 | Beginning Long Term Debt | 00000 | 4600 |
| F13 | Ending Long Term Debt | 00000 | 4699 |
| F14 | Ending Liabilities | 00000 | 4899 |
| F15 | Beginning Revenues / Sales | 00000 | 5000 |
| F16 | Ending Revenue / Sales | 00000 | 5999 |
| F17 | Beginning Cost of Goods (COG) Sold | 00000 | 6000 |
| F18 | Ending COG Sold / Direct Expenses | 00000 | 6999 |
| F19 | Ending COG Sold | 00000 | 7999 |
| F20 | Beginning Interest | 00000 | 8900 |
| F21 | Ending Interest | 00000 | 8999 |
| F22 | Beginning Other Income | 00000 | 9000 |
| F23 | Ending Other Income | 00000 | 9199 |
| F24 | Beginning Other Expense | 00000 | 9200 |
| F25 | Ending Other Expense | 00000 | 9699 |
| F26 | Beginning Tax Expense | 00000 | 9700 |
| F27 | Ending Tax Expense | 00000 | 9799 |
| F28 | Ending Profit and Loss Accounts | 00000 | 9999 |
|
Note: Only AAIs for company 00000 are set up without a business unit. |
4.3 Prerequisites
Before using the Dashboard program, complete these tasks:
-
Set up the console.
-
Run the Date Dimension program (R80D100).
-
Run the appropriate data load batch programs.
4.4 Managing Accounts Payable
This section provides an overview of AP metrics and discusses how to:
-
Set processing options for the AP Discount Information Data Load program (R80D254).
-
Run the AP Discount Information Data Load program.
-
Analyze AP discounts.
-
Set processing options for the AP Daily Counts and Amounts program (R80D253).
-
Run the AP Daily Counts and Amounts program.
-
Analyze AP daily counts and amounts.
-
Set processing options for the AP Open Payables Data Load program (R80D255).
-
Run the AP Open Payables Data Load program.
-
Analyze AP open payables.
-
Set processing options for the AP Vouchers Paid Late Data Load program (R80D256).
-
Run the AP Vouchers Paid Late Data Load program.
-
Analyze AP vouchers paid late.
4.4.1 Understanding AP Metrics
To manage cash flow and profits, companies need to understand the volume and flow of their accounts payable. The JD Edwards EnterpriseOne FMCC AP metrics provide information about:
-
Discounts available and taken from suppliers.
AP discount information enables you to determine whether you are taking all available discounts from your suppliers and, if not, how much you are overpaying.
-
Amount and volume of vouchers and payments entered daily.
-
Outstanding liabilities, which are the amounts vouchered for payment in the near future.
-
Volume and amount of vouchers that were paid after the due date.
If late payments are subject to delinquency fees by your suppliers, you can better manage avoidable expense by understanding the amount that is potentially subject to a fee.
These AP metrics help in determining the overall financial health of the company and how well the capital of the company is managed:
| Metric | Metric Segment | Description |
|---|---|---|
| Amount of Discounts | Available | Shows the total amount of discounts that are available for all paid vouchers by general ledger date by business unit. |
| Amount of Discounts | Taken | Shows the total amount of discounts taken by each general ledger date by business unit. |
| Amount of Discounts | Not Taken | Shows the total amount of discounts not taken by general ledger date by business unit. The system calculates the Amount of Discounts Not Taken as:
Amount of Discounts Available – Amount of Discounts Taken |
| Percentage of Discounts Not Taken | N/A | Calculates the percentage of discounts not taken for the period. The system calculates the Percentage of Discounts Not Taken as:
=Total discount not taken Total gross amount of paid vouchersÃ100 |
| Daily Amounts | Vouchered for the Day | Shows the total amount of vouchers that are generated for each day. The system calculates the Amount Vouchered for the Day by summing the gross amount of the vouchers retrieved from the Accounts Payable Ledger table (F0411) for each general ledger date by business unit. |
| Daily Amounts | Paid for the Day | Shows the total amount of vouchers paid for each day. The system calculates the Amount Paid for the Day by summing the amount of the payments retrieved from the Accounts Payable - Matching Document table (F0413) for each general ledger date by business unit. |
| Daily Counts | Number of Vouchers Entered for the Day | Shows the number of vouchers that are generated for each general ledger date by business unit. The system counts each record in the F0411 table where the combination of document number, document type, and document company is unique. |
| Daily Counts | Number of Payments Entered for the Day | Shows the number of payments processed from the F0413 table for each general ledger date by business unit. |
| Voucher Amounts | Open Vouchers | Shows the total amount of open vouchers by business unit. |
| Voucher Amounts | Open Vouchers That are Past Due | Shows the amount of open vouchers by business unit for which the voucher due date is before the run date of the batch program. |
| Voucher Counts | Number of Open Vouchers | Shows the number of open vouchers for which the combination of document number, document type, and document company is unique by business unit. |
| Voucher Counts | Number of Open Vouchers That are Past Due | Shows the number of open vouchers that are past-due by business unit. The system counts each record in the F0411 table for which the combination of document number, document type, and document company is unique. The system determines whether the voucher is past due by comparing the due date to the run date of the batch program. |
| Amount of Vouchers Paid Late | N/A | Shows the total amount of vouchers paid late for each general ledger date by business unit. |
| Number of Vouchers Paid Late | N/A | Shows the number of vouchers paid late for each general ledger date by business unit. The system counts each past-due voucher for which the document number, document type, and document company combination is unique. |
4.4.2 Setting Processing Options for the AP Discount Information Data Load Program (R80D254)
Processing options enable you to specify the default processing for the AP Discount Information Data Load program.
4.4.2.1 Defaults
This processing option controls the number of days the system uses to load data.
- 1. Number of Days to Rebuild
-
Enter the number of days that the system uses to rebuild the data.
If you leave this processing option blank, the system retrieves records for which the general ledger date is greater than or equal to the last processing date in the AP Discount Information Aggregate table (F80D254) and less than or equal to the current date. If no processing date is in the table, the system runs an initial full load of data.
For incremental loads that specify to rebuild the table for a specific number of days, the system subtracts the number of days entered in the processing option from the current date. The system retrieves only records with a general ledger date that is on or after the calculated rebuild date.
If you run the program twice in the same day, the system replaces the existing records for the day in the F80D254 table with new records.
4.4.2.2 Display
This processing option controls the print output.
- 1. Level of Detail to Print
-
Specify whether the system prints a detailed report or errors only. Values are:
-
Blank: The system prints errors only.
-
1: The system prints a detailed report of the processed records and any errors generated.
-
4.4.3 Running the AP Discount Information Data Load Program
Enter BV in the Fast Path field, and then enter R80D254 in the Batch Application field.
The AP Discount Information Data Load program (R80D254) calculates the Amount of Discounts Available, the Amount of Discounts Taken, the Amount of Discounts Not Taken, and the Percentage of Discounts Not Taken metrics.
The system retrieves transactions from the Accounts Payable Ledger table (F0411) based on these criteria:
-
Pay Status (PST) is set to P.
-
Document Type (DCT) is not equal to P1.
-
Adjustment Document Type (DCTA) is not equal to PE.
-
Discount Available (ADSC) is not equal to zero.
-
Void (VOD) is blank.
-
G/L Date (DGJ) is equal to the starting date specified in the processing option.
The system uses the value in the Number of Days to Rebuild processing option to determine the general ledger date to retrieve transactions.
The system also retrieves the business unit from the F0411 table and the company from the Business Unit Master table (F0006) based on the business unit in the AP Discount Information Aggregate table (F80D254).
The system performs these calculations to derive the AP discounts metrics:
-
Amount of Discounts Available: Sums the Discounts Available field (ADSC) for all transactions retrieved for each general ledger date by business unit.
(Amount of Discounts Available = Sum of all available discounts)
-
Amount of Discounts Taken: Sums the Discount Taken field (ADSA) for all transactions retrieved for each general ledger date by business unit.
(Amount of Discounts Taken = Sum of all discounts taken)
-
Amount of Discounts Not Taken: Subtracts the Amount of Discounts Taken from the Amount of Discounts Available for each general ledger date by business unit.
(Amount of Discounts Not Taken = Amount of Discounts Available − Amount of Discounts Taken)
-
Percentage of Discounts Not Taken: Percentage of the total paid vouchered amount. For the records on which a discount not taken is calculated, the system sums the Gross Amount field (AG) and then divides the total discount not taken amount by the total gross amount of paid vouchers and multiplies the result by 100.
(Percentage of Discounts Not Taken = (Discount not taken amount ÷ Total gross amount of paid vouchers) à 100)
The system stores the Amount of Discounts Available, the Amount of Discounts Taken, and the Amount of Discounts Not Taken values in the F80D254 table. The AP discount metrics are accurate as of the last date you ran the R80D254 program. Oracle recommends that you run the program weekly for trending purposes.
|
Note: If you change the data store currency, modify the business units associated with accounts, or update the company associated with the business unit, you must run a full load of data to the F80D254 table. To do this, either clear the table or set the Number of Days to Rebuild processing option beyond the general ledger date of the first eligible record. |
4.4.3.1 AP Discounts Calculation Example
This table shows the vouchers, discounts available, discounts taken, and voucher general ledger dates:
| Voucher Number | Gross Amount | Discounts Available | Discounts Taken | General Ledger Date |
|---|---|---|---|---|
| 100 | 100 USD | 100 USD | 100 USD | February 13 |
| 101 | 200 USD | 200 USD | 200 USD | February 13 |
| 102 | 200 USD | 200 USD | 200 USD | February 13 |
| 103 | 200 USD | 200 USD | 0 USD | February 13 |
| 104 | 100 USD | 100 USD | 0 USD | February 13 |
If you run the R80D254 program on February 13, the system performs these calculations:
-
Amount of Discounts Available = (100 + 200 + 200 + 200 + 100) = 800 USD.
-
Amount of Discounts Taken = (100 + 200 + 200) = 500 USD.
-
Amount of Discounts Not Taken = (800 − 500) = 300 USD.
-
Total Gross Amount Paid = (100 + 200 + 200 + 200 + 100) = 800 USD.
-
Percentage of Discounts Not Taken = (300 ÷ 800) à 100 = 37.5 percent.
4.4.4 Analyzing AP Discounts
Access the appropriate metric group on the Fin Mgmt & Compliance Console form.
The system presents the three AP discount metrics (Amount of Discounts Available, Amount of Discounts Taken, and Amount of Discounts Not Taken) in a cluster bar chart that shows the amount of discounts (Y axis) for the date the system calculated the metric (X axis):
Day is the default value for the date range. You can also review the chart by week, month, quarter, or year date ranges. The system displays the values for all previous AP discounts in the chart. If an AP discount calculation is zero, the system displays a zero value bar for the date. If no calculation was performed for a period, the system does not display a bar.
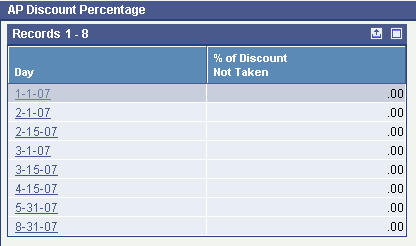
The system presents the Percentage of Discounts Not Taken metric as a grid with a line for each date period that the metric was calculated:
4.4.5 Setting Processing Options for the AP Daily Counts and Amounts Program (R80D253)
Processing options enable you to specify the default processing for the AP Daily Counts and Amounts program.
4.4.5.1 Defaults
This processing option controls the number of days the system uses to load data.
- 1. Number of Days to Rebuild
-
Enter the number of days the system uses to rebuild the data.
If you leave this processing option blank, the system retrieves records where the general ledger date is greater than or equal to the last processing date in the AP Daily Counts and Amounts Aggregate table (F80D253) and less than or equal to the current date. If no processing date is in the table, the system runs an initial full load of data.
For incremental loads that specify to rebuild the table for specific number of days, the system subtracts the number of days entered in the processing option from the current date. The system retrieves only records with a general ledger or payment date that is on or after the calculated rebuild date.
If you run the program twice in the same day, the system replaces the existing records for the day in the F80D253 table with new records.
4.4.5.2 Display
This processing option controls the print output.
- 1. Level of Detail to Print
-
Specify whether the system prints a detailed report or errors only. Values are:
-
Blank: The system prints errors only.
-
1: The system prints a detailed report of the processed records and any errors generated.
-
4.4.6 Running the AP Daily Counts and Amounts Program
Enter BV in the Fast Path field, and then enter R80D253 in the Batch Application field.
The AP Daily Counts and Amounts program (R80D253) calculates the Amount Vouchered for the Day, the Amount Paid for the Day, the Number of Vouchers Entered for the Day, and the Number of Payments Entered for the Day metrics.
For the voucher metrics, the system retrieves transactions from the F0411 table based on these criteria:
-
Document Type (DCT) is not equal to P1.
-
Adjustment Document Type (DCTA) is not equal to PE.
-
Void (VOD) is blank.
-
G/L Date (DGJ) is equal to the starting date specified in the processing option.
The system uses the value in the Number of Days to Rebuild processing option to determine the general ledger date to retrieve transactions.
For the payment metrics, the system retrieves transactions from the Accounts Payable – Matching Document table (F0413) based on these criteria:
-
Void Date (VDGJ) is blank.
-
Payment Date (DMTJ) is equal to the starting date specified in the processing option.
The system uses the value in the Number of Days to Rebuild processing option to determine the general ledger date to retrieve transactions.
The system retrieves transactions from the Account Master table (F0901) based on the value of the G/L Bank Account (GLBA) from the F0413 table being equal to the value of the Account ID (AID) in the F0901 table.
The system also retrieves the business unit from the F0411 table and the company from the F0006 table based on the business unit in the AP Daily Counts and Amounts Aggregate table (F80D253).
The system performs these calculations to derive the AP daily counts and amounts metrics:
-
Amount Vouchered for the Day: Sums the Gross Amount field (AG) of the vouchers retrieved for each general ledger date by business unit.
(Amount Vouchered for the Day = Sum of the amounts for all vouchers entered for the day)
-
Amount Paid for the Day: Sums the Payment Amount field (PAAP) of the payments for each general ledger date by business unit.
(Amount Paid for the Day = Sum of the amounts for all payments entered for the day)
-
Number of Vouchers Entered for the Day: Counts the number of vouchers retrieved for each general ledger date by business unit. The system counts each record in the F0411 table where the combination of document number, document type, and document company is unique.
-
Number of Payments Entered for the Day: Counts the number of payments retrieved for each general ledger date by business unit.
The system stores the calculated metric values in the F80D253 table. The system records data to the F80D253 table only when the R80D253 program runs successfully. If any errors appear on the report, the system does not create any records in the F80D253 table. The AP daily counts and amounts metrics are accurate as of the last date you ran the R80D253 program. Oracle recommends that you run the program daily for trending purposes.
|
Note: If you change the data store currency, modify the business units associated with accounts, or update the company associated with the business unit, you must run a full load of data to the F80D253 table. To do this, either clear the table or set the Number of Days to Rebuild processing option beyond the general ledger date of the first eligible record. |
|
Note: The system does not use data selection criteria for the R80D253 program. The system processes all data from the source tables regardless of the values you enter in the data selection categories. |
4.4.7 Analyzing AP Daily Counts and Amounts
Access the appropriate metric group on the Fin Mgmt & Compliance Console form.
The system presents the AP daily amount metrics, Amount Vouchered for the Day and Amount Paid for the Day in a cluster bar chart that shows the amount vouchered and paid (Y axis) for the date that the system calculated the metric (X axis):
Figure 4-3 AP Voucher and Payment Amounts chart
Description of "Figure 4-3 AP Voucher and Payment Amounts chart"
Day is the default value for the date range, you can also review the chart by week, month, quarter, or year date ranges. The system displays the values for all previous AP daily amounts in the chart. If an AP daily amount calculation is zero, the system displays a zero value bar for the date. If no calculation was performed for a period, the system does not display a bar.
The system presents the AP daily count metrics, Number of Vouchers Entered for the Day, and Number of Payments Entered for the Day in a cluster bar chart that shows the number of vouchers and payments (Y axis) for the date that the system calculated the metric (X axis):
Figure 4-4 AP Voucher and Payment Counts chart
Description of "Figure 4-4 AP Voucher and Payment Counts chart"
Day is the default value for the date range. You can also review the chart by month, quarter, or year date ranges. The system displays the values for all previous AP daily counts in the chart. If an AP daily count calculation is zero, the system displays a zero value bar for the date. If no calculation was performed for a period, the system does not display a bar.
4.4.8 Setting Processing Options for the AP Open Payables Data Load Program (R80D255)
Processing options enable you to specify the default processing for the AP Open Payables Data Load program.
4.4.8.1 Display
This processing option controls the print output.
- 1. Level of Details to Print
-
Specify whether the system prints a detailed report or errors only. Values are:
-
Blank: The system prints errors only.
-
1: The system prints a detailed report of the processed records and any errors generated.
-
4.4.9 Running the AP Open Payables Data Load Program
Enter BV in the Fast Path field, and then enter R80D255 in the Batch Application field.
The AP Open Payables Data Load program (R80D255) calculates the Amount of Open Vouchers, the Amount of Open Vouchers That are Past Due, the Number of Open Vouchers, and the Number of Open Vouchers That are Past Due metrics.
The system retrieves transactions from the F0411 table based on these criteria:
-
Open Amount (AAP) is not equal to zero.
-
G/L Date (DGJ) is less than or equal to the run date of the R80D255 program plus one month.
The system does not include open vouchers that have a general ledger date that is more than one month into the future from the date that you run the R80D255 program. For example, if the current date is August 15, the system considers only the open vouchers that have a general ledger date of September 15 or less. This enables the system to exclude recurring vouchers that are open further in the future.
The system also retrieves the business unit from the F0411 table and the company from the F0006 table based on the business unit in the AP Open Payables Aggregate table (F80D255).
The system performs these calculations to derive the AP open payables metrics:
-
Amount of Open Vouchers: Sums the value of the Open Amount field (AAP) for all records retrieved by business unit.
(Amount of Open Vouchers = Sum of open amounts)
-
Amount of Open Vouchers That are Past Due: Sum the Open Amount field (AAP) of the vouchers by business unit where the voucher due date is before the run date of the R80D255 program.
(Amount of Open Vouchers Past Due = Sum of open amounts)
-
Number of Open Vouchers: Counts the number of vouchers retrieved by business unit. The system counts each record in the F0411 table where the combination of document number, document type, and document company is unique.
-
Number of Open Vouchers That are Past Due: Counts the number of vouchers retrieved by business unit where the value in the Voucher Due Date field (DDNJ) is before the run date of the R80D255 program. The system counts each record in the F0411 table where the combination of document number, document type, and document company is unique.
The system calculates the open payables information only on the date that you run the R80D255 program and stores the values in the F80D255 table. You cannot review information based on whether vouchers were open or past due as of a specific date. The AP open payables metrics are accurate as of the last date that you ran the R80D255 program. Oracle recommends that you run the program daily for trending purposes.
|
Note: If you change the data store currency, modify the business units associated with accounts, or update the company associated with the business unit, you must run a full load of data to the F80D255 table. |
4.4.9.1 Open Payables Amount Example
You have this information in the F0411 table:
| Voucher Number | Voucher Due Date | Open Amount | GL Date | Business Unit |
|---|---|---|---|---|
| 100 | February 09 | 100 | February 10 | 001 |
| 101 | February 10 | 200 | February 11 | 001 |
| 102 | February 11 | 200 | February 12 | 001 |
| 103 | February 16 | 200 | February 16 | 002 |
| 104 | April 16 | 200 | March 17 | 001 |
| 105 | April 17 | 200 | March 18 | 001 |
If you run the R80D255 program on February 16, the system sums the open amount from the run date of the program plus one month, or March 16. The system calculates:
-
Amount of Open Vouchers as 700 using vouchers 100, 101, 102, and 103.
-
Amount of Open Vouchers That are Past Due as 500 using vouchers 100, 101, and 102.
The total does not include voucher 103 because it is not past due until February 17.
4.4.9.2 Open Payables Count Example
You have this information in the F0411 table:
| Voucher Number | Line Number | Business Unit | Voucher Due Date | GL Date | Document Number | Document Type | Company |
|---|---|---|---|---|---|---|---|
| 1 | 1 | 001 | February 09 | February 10 | 2000 | RI | 00001 |
| 2 | 2 | 001 | February 10 | February 11 | 2000 | RI | 00001 |
| 3 | 1 | 001 | February 11 | February 12 | 2000 | RF | 00001 |
| 4 | 1 | 002 | February 15 | February 16 | 2001 | RI | 00001 |
| 5 | 1 | 001 | February 16 | February 16 | 2002 | RI | 00002 |
| 6 | 1 | 001 | April 17 | March 18 | 2003 | RI | 00002 |
The first voucher has two pay items; however, the document number, document type, and company are the same, so the system counts it as one voucher. The system does not include voucher number 6 because it is outside of the date range (February 16 plus one month). The rest of the vouchers are unique. The system calculations are:
-
Number of Open Vouchers metric as 4.
-
Number of Open Vouchers That are Past Due metric as 3.
The total does not include voucher 103 because it is not past due until February 17.
4.4.10 Analyzing AP Open Payables
Access the appropriate metric group on the Fin Mgmt & Compliance Console form.
The system presents the AP open payables amount metrics (Amount of Open Vouchers and Amount of Open Vouchers That are Past Due) in a cluster bar chart that shows the open voucher amounts (Y axis) for the date that the system calculated the metric (X axis):
Day is the value for the date range. The system displays the values for all previous AP open payables amounts in the chart. If an AP open payables amount calculation is zero, the system displays a zero value bar for the date. If no calculation was performed for a period, the system does not display a bar.
The system presents the AP open payables count metrics (Number of Open Vouchers and Number of Open Vouchers That are Past Due) in a cluster bar chart that shows the number of vouchers (Y axis) for the date that the system calculated the metric (X axis):
Day is the value for the date range. You can also review the chart by week, month, quarter, or year date ranges. The system displays the values for all previous AP open payables counts in the chart. If an AP open payables count calculation is zero, the system displays a zero value bar for the date. If no calculation was performed for a period, the system does not display a bar.
4.4.11 Setting Processing Options for the AP Vouchers Paid Late Data Load Program (R80D256)
Processing options enable you to specify the default processing for the AP Vouchers Paid Late Data Load program.
4.4.11.1 Defaults
This processing option controls the number of days the system uses to load data.
- 1. Number of Days to Rebuild
-
Enter the number of days the system uses to rebuild the data.
If you leave this processing option blank, the system retrieves records for which the general ledger date is greater than or equal to the last processing date in the AP Voucher Paid Late Aggregate table (F80D256) and less than or equal to the current date. If no processing date is in the table, the system runs an initial full load of data.
For incremental loads that specify to rebuild the table for a specific number of days, the system subtracts the number of days entered in the processing option from the current date. The system retrieves only records with a payment date that is on or after the calculated rebuild date.
If you run the program twice in the same day, the system replaces the existing records for the day in the F80D256 table with new records.
4.4.11.2 Display
This processing option controls the print output.
- 1. Level of Detail to Print
-
Specify whether the system prints a detailed report or errors only. Values are:
-
Blank: The system prints errors only.
-
1: The system prints a detailed report of the processed records and any errors generated.
-
4.4.12 Running the AP Vouchers Paid Late Data Load Program
Enter BV in the Fast Path field, and then enter R80D256 in the Batch Application field.
The AP Vouchers Paid Late Data Load program (R80D256) calculates the Amount of Vouchers Paid Late and the Number of Vouchers Paid Late metrics.
The system retrieves transactions from the F0413 table based on these criteria:
-
Void Date (VDGJ) is blank.
-
Payment Date (DMTJ) is equal to the starting date specified in the processing option.
The system uses the value in the Number of Days to Rebuild processing option to determine the general ledger date to retrieve transactions. The payment date is the general ledger date of the payment.
To determine whether the voucher was paid late, the system retrieves transactions from the Accounts Payable Matching Document Details table (F0414) that the system uses to locate corresponding records in the F0411 table. The system retrieves transactions based on the value of the Payment ID (PYID) from the F0413 table being equal to the value of the Payment ID (AID) in the F0414 table.
The system retrieves transactions from the F0411 table based on these criteria:
-
Document Number (DOC) from F0414 table is equal to the DOC from the F0411 table.
-
Document Type (DCT) from F0414 table is equal to the DCT from the F0411 table.
-
Document Company (KCO) from F0414 table is equal to the KCO from the F0411 table.
-
Adjusting Document Type (ADCT) is not equal to PE.
The system does not retrieve or consider P1 draft documents for the metrics.
The system also retrieves the business unit from the F0411 table and the company from the F0006 table based on the business unit in the AP Voucher Paid Late Aggregate table (F80D256).
The system performs these calculations to derive the AP voucher paid late metrics:
-
Amount of Vouchers Paid Late: Retrieves the value from the Payment Amount field (AAP) for each voucher that is paid late and then sums the amounts for each general ledger date by business unit.
(Amount of Vouchers Paid Late = Sum of payment amounts)
-
Number of Vouchers Paid Late: Compares the Due Date (DDNJ) in the F0411 table against the Payment Date (DMTJ) of the corresponding record in the F0413 table and then counts the records in the F0411 table where the due date is before the payment date and the document number, document type, and document company combination is unique for each payment date by business unit.
The system stores the Amount of Vouchers Paid Late and the Number of Vouchers Paid Late values in the F80D256 table. The AP vouchers paid late metrics are accurate as of the last date that you ran the R80D256 program. Oracle recommends that you run the program daily for trending purposes.
|
Note: If you change the data store currency, modify the business units associated with accounts, or update the company associated with the business unit, you must run a full load of data to the F80D256 table. To do this, either clear the table or set the Number of Days to Rebuild processing option beyond the general ledger date of the first eligible record. |
4.4.12.1 Amount of Vouchers Paid Late Example
This table shows the vouchers, due dates, payment amounts, and payment dates:
| Voucher Number | Due Date | Payment Amount | Payment Date |
|---|---|---|---|
| 100 | February 14 | 100 USD | February 16 |
| 101 | February 15 | 200 USD | February 16 |
| 102 | February 1 | 200 USD | February 10 |
| 103 | February 9 | 200 USD | February 8 |
If you run the R80D256 program on February 16, the system considers only the vouchers with payment dates greater than the due date, in this case 100 and 101. Therefore, the amount of vouchers paid late for February 16 is 300 USD and 200 USD for February 10.
4.4.12.2 Number of Vouchers Paid Late Example
You have this data in the F0411 table:
| Document Number | Document Type | Document Company | Line ID | Due Date | Payment Amount | Payment Date | Business Unit |
|---|---|---|---|---|---|---|---|
| 2000 | PV | 00001 | 001 | February 14 | 100 USD | February 16 | 001 |
| 2000 | PV | 00001 | 002 | February 14 | 100 USD | February 12 | 001 |
| 2000 | PV | 00001 | 003 | February 14 | 100 USD | February 16 | 001 |
| 2001 | PL | 00001 | 001 | February 14 | 100 USD | February 16 | 001 |
| 2001 | PV | 00001 | 001 | February 15 | 200 USD | February 16 | 002 |
| 2002 | PV | 00002 | 001 | February 1 | 200 USD | February 10 | 001 |
| 2004 | PV | 00001 | 001 | February 9 | 200 USD | February 8 | 002 |
If you run the R80D256 program on February 16, the system:
-
Counts document number 2000 as one voucher for the given payment date, even though it has three pay items.
-
Does not consider voucher 2004 because it was paid before the due date.
-
Counts the remainder of the vouchers because they have unique document number, document type, and document company combinations.
Therefore, the number of vouchers paid late for February 16 is 3 and the number of vouchers paid late for February 10 is 1.
4.4.13 Analyzing AP Vouchers Paid Late
Access the appropriate metric group on the Fin Mgmt & Compliance Console form.
The system presents the Amount of Vouchers Paid Late metric in a bar chart that shows the voucher amounts (Y axis) for the date that the system calculated the metric (X axis):
Figure 4-7 AP Vouchers Paid Late Amount chart
Description of "Figure 4-7 AP Vouchers Paid Late Amount chart"
Day is the default value for the date range. You can also review the chart by week, month, quarter, or year date ranges. The system displays the values for all previous Amount of Vouchers Paid Late amounts in the chart. If an Amount of Vouchers Paid Late calculation is zero, the system displays a zero value bar for the date. If no calculation was performed for a period, the system does not display a bar.
The system presents the Number of Vouchers Paid Late metric in a bar chart that shows the number of vouchers (Y axis) for the date that the system calculated the metric (X axis):
Figure 4-8 AP Vouchers Paid Late Count chart
Description of "Figure 4-8 AP Vouchers Paid Late Count chart"
Day is the default value for the date range. You can also review the chart by week, month, quarter, or year date ranges. The system displays the values for all previous Number of Vouchers Paid Late counts in the chart. If a Number of Vouchers Paid Late calculation is zero, the system displays a zero value bar for the date. If no calculation was performed for a period, the system does not display a bar.
4.5 Managing Accounts Receivable
This section provides overviews of accounts receivable (AR) metrics and days sales outstanding (DSO), and discusses how to:
-
Analyze days sales outstanding.
-
Set processing options for the AR Discount Information Data Load program (R80D282).
-
Run the AR Discount Information Data Load program.
-
Analyze AR discounts.
-
Set processing options for the AR Daily Counts and Amounts program (R80D280).
-
Run the AR Daily Counts and Amounts program.
-
Analyze AR daily counts and amounts.
-
Set processing options for the AR Open Receivables Data Load program (R80D284).
-
Run the AR Open Receivables Data Load program.
-
Analyze AR open receivables.
-
Set processing options for the AR Delinquency Data Load program (R80D281).
-
Run the AR Delinquency Data Load program.
-
Analyze AR delinquency information.
-
Set processing options for the AR Open Chargeback Information Data Load program (R80D283).
-
Run the AR Open Chargeback Information Data Load program.
-
Analyze AR open chargebacks.
-
Set processing options for the AR Total Chargeback Information Data Load program (R80D285).
-
Run the AR Total Chargeback Information Data Load program.
-
Analyze AR total chargebacks.
4.5.1 Understanding Accounts Receivable Metrics
To manage cash flow and profits, companies need to understand the volume and flow of their accounts receivable. The JD Edwards EnterpriseOne FMCC AR metrics provide information about:
-
Days Sales Outstanding (DSO), which is a widely used metric that measures how much capital a manufacturer has tied up in outstanding receivables.
The result of the DSO calculation informs managers how many days worth of product sales have been shipped to customers and are yet to be paid. When products are shipped on credit, companies must wait a certain number of days before receiving cash to recover the investments that were made in the shipped product.
-
Discount offered and taken by customers.
AR discount information enables you to view how your customers pay. Discount information can help in determining whether the discounts that are offered provide enough customer incentive to make early payments. Discounts also enable you to understand how much revenue is being lost by discounting goods.
-
Amount and volume of invoices and receipts entered daily.
Daily amounts and counts represents both daily revenue and future revenue.
-
Amount and volume of past due invoices in relation to the customers who are delinquent.
By tracking the volume and amount of past-due invoices in relation to the customers who are delinquent, a company can determine whether to increase or decrease a customer's credit, increase delinquency fees, or terminate the relationship.
-
Open and total chargeback amounts, which are the invoice amounts that are charged back to customers due to failure to pay.
A chargeback is an invoice record generated in a receipt batch that replaces an invoice that has purposefully not been paid. When you enter a chargeback, the system generates a receipt record to close the original invoice and creates a new invoice in the Customer Ledger table (F03B11) with an RB document type. You should associate all chargebacks with a chargeback reason code that describes why the original invoice was not paid.
-
Open and total chargeback amounts by reason code.
By tracking the chargeback reason codes, you can better understand and address the issues and concerns of your customers.
These AR metrics help in determining the overall financial health of the company and how well the capital of the company is managed:
| Metric | Metric Segment | Description |
|---|---|---|
| Days Sales Outstanding (DSO) | N/A | Calculates how much capital is tied up in the outstanding accounts receivables of the manufacturer. |
| Amount of Discounts | Taken | Shows the total amount of discounts taken by each general ledger date by business unit. |
| Amount of Discounts | Unearned Taken | Shows the total amount of discounts taken that were not earned by general ledger date by business unit. |
| Amount of Discounts | Not Taken | Shows the total amount of discounts that were not taken for each general ledger date by business unit. The system calculates the amount of Discounts Not Taken as: Amount of Discounts Available – Amount of Discounts Taken |
| Percentage of Invoices | Which a Discount was Taken | Calculates the percentage of discounts taken for the period. The system calculates the Percentage of Invoices for Which a Discount was Taken as:
=Number of invoices with an earned discount taken Number of invoices with a discount availableÃ100 |
| Percentage of Invoices | Which an Unearned Discount was Taken | Calculates the percentage of discounts taken that were not earned for the period. The system calculates the Percentage of Invoices for Which an Unearned Discount was Taken as:
=Number of invoices for which a discount was not taken Number of invoices with a discount availableÃ100 |
| Percentage of Invoices | Which a Discount was Available but Not Taken | Calculates the percentage of discounts that were available but not taken for the period. The system calculates the Percentage of Invoices for Which a Discount was Available but Not Taken as:
Shows the amount of revenue that is open for collection. |
| Amount of Open Invoices | N/A | Shows the amount of revenue that is open for collection. |
| Number of Open Invoices | N/A | Shows the number of invoices that are open for collection. |
| Daily Amounts | Invoiced for the Day | Shows the total amount of invoices generated for each day. |
| Daily Amounts | Received for the Day | Shows the average amount of payments received for each day. |
| Average Amount Invoiced for the Day | N/A | Shows the average amount of invoices generated for each day. |
| Daily Counts | Number of Invoices Entered for the Day | Shows the number of invoices generated for each general ledger date by business unit. The system counts each record in the F03B11 table where the combination of document number, document type, and document company is unique. |
| Daily Counts | Number of Receipts Entered for the Day | Shows the number of receipts retrieved from the Receipts Header table (F03B13) for each general ledger date by business unit. |
| Past Due Amounts | Open Amount of Past Due Invoices | Shows the open amount for all invoices with an invoice due date in the past. |
| Past Due Amounts | Amount of Open Delinquency Fees | Shows the open amount of delinquency fees that have been applied from past due invoices. |
| Past Due Counts | Number of Past Due Invoices | Shows the number of invoices with a due date in the past. |
| Past Due Counts | Number of Customers with Past Due Invoices | Shows the number of customers with invoice due dates in the past. |
| Open Chargeback Amount | N/A | Shows the open amount that has been charged back to customers for failure to pay invoices. |
| Open Chargeback Amount by Reason Code | N/A | Shows the open amount that has been charged back to customers by reason code for the nonpayment of invoices. |
| Total Chargeback Amount | N/A | Shows the total amount that has been charged back to customers for failure to pay for each general ledger date. |
| Total Chargeback Amount by Reason Code | N/A | Shows the total amount that has been charged back to customers by reason code for each general ledger date for the nonpayment of invoices. |
4.5.2 Understanding Days Sales Outstanding
DSO measures how much capital a company has tied up in outstanding receivables. Companies use DSO to estimate the length of time credit customers take to settle their balances:
-
A high number can indicate that customers are slow in paying bills, so the company has to wait a long time to collect cash.
The higher the DSO number, the more capital the company has tied up in AR.
-
A low number indicates that customers pay quickly and, as a result, the company has a relatively small amount of capital tied up in receivables.
A company that bills the customer's credit cards immediately upon receipt of an online order has a very low DSO number because they have very little money owed to them at any time.
Although companies strive to keep DSO as low as possible, an extremely low DSO can indicate a very restrictive credit and collection policy, which may curtail sales and hence adversely affect profit.
-
The shorter the collection period, the better the quality of debtors, because a short collection period implies the prompt payment by debtors.
You should compare the average collection period against your companies credit terms and policies to judge your credit and collection efficiency.
-
An excessively long collection period implies a very liberal and inefficient credit and collection performance.
The delay in collection of cash impairs a company's liquidity.
The DSO metric displays the trend over time and compares the trend to the DSO goal of the company. Increasing trends can indicate trouble collecting receivables from large customers and can result from surges in shipments, which increases the outstanding AR. DSO is considered an important aspect in accessing the overall financial health of a company.
The system displays the DSO metric information in two different bar charts, DSO by company and DSO by customer. When you review the DSO charts on the console summary page, they appear the same. The difference between the two charts is not apparent until you drill down on the console detail page. For DSO by company, you drill down using date, company, and then customer. For DSO by customer, you drill down using date, customer, and then company. Because date is the first drill-down level for both charts, the summary page appears the same for both charts. No business unit drilldown is available for the DSO metric.
For the DSO metric, you cannot search for a specific company. If you enter a specific company in the Search By Company field, the system displays a blank console. You can review information by company using the drilldown and view by features. For example, if you view by date, the system displays the information by date and then you can drill into a date and see the information by company. You can also view by company to see information for all companies displayed on the console.
JD Edwards EnterpriseOne FMCC does not have a batch program that generates the DSO values. The system uses the date in the AR Statistical History table (F03B16) and then performs the DSO calculations at runtime of the Dashboard program (P80D350). For example, if you inquire on DSO by quarter date ranges, the system:
-
Adds the DSO values for the periods that make up the quarter.
-
Divides the total by 3.
-
Displays the value in the chart on the console.
|
Note: You must run the A/R Statistical History Refresh (A) program (R03B16A) to populate the F03B16 table. |
The DSO value that is calculated in JD Edwards EnterpriseOne FMCC can be different from the DSO value that is calculated in the JD Edwards Plant Manager's Dashboard (PMD). JD Edwards EnterpriseOne FMCC uses the data that is calculated based on the processing option settings of the R03B16A program. Depending on how you set the processing options when loading the data into the table, the system can produce different DSO numbers.
4.5.3 Analyzing Days Sales Outstanding
Access the appropriate metric group on the Fin Mgmt & Compliance Console form.
The system retrieves transactions from the AR Statistical History table (F03B16) and the Credit/Collection Date Pattern table (F03B08) based on the company, fiscal year, and period number.
The system presents the DSO metric in two bar charts, DSO by customer and DSO by company.
The first chart shows the number of days of sales outstanding (Y axis) for the date that the system calculated the metric (X axis) by customer:
The second chart shows the number of days of sales outstanding (Y axis) for the date that the system calculated the metric (X axis) by company:

Month is the default value for the date range. You can also review the chart by quarter or year date ranges. The system displays the values for all previous DSO calculations in the chart. If the DSO calculation was zero days, the system displays a zero value bar for the date. If no calculation was performed for a period, the system does not display a bar.
You can define goals for DSO at the customer and company levels. Goals are numerical values that represent a target for the customers. If the metric exceeds the goal, the system considers the goal breached. The system displays the goal value as a diamond marker for each bar on the chart.
4.5.4 Setting Processing Options for the AR Discount Information Data Load Program (R80D282)
Processing options enable you to specify the default processing for the AR Discount Information Data Load program.
4.5.4.1 Defaults
This processing option controls the number of days that the system uses to load data.
- 1. Number of Days to Rebuild
-
Enter the number of days that the system uses to rebuild the data.
If you leave this processing option blank, the system retrieves records where the general ledger date is greater than or equal to the last processing date in the AR Discount Information Aggregate table (F80D282) and less than or equal to the current date. If no processing date is in the table, the system runs an initial full load of data.
For incremental loads that specify to rebuild the table for specific number of days, the system subtracts the number of days entered in the processing option from the current date. The system retrieves only records with a general ledger date that is on or after the calculated rebuild date.
If you run the program twice in the same day, the system replaces the existing records for the day in the F80D282 table with new records.
4.5.4.2 Display
This processing option controls the print output.
- 1. Level of Detail to Print
-
Specify whether the system prints a detailed report or errors only. Values are:
-
Blank: The system prints errors only.
-
1: The system prints a detailed report of the processed records and any errors generated.
-
4.5.5 Running the AR Discount Information Data Load Program
Enter BV in the Fast Path field, and then enter R80D282 in the Batch Application field.
The AR Discount Information Data Load program (R80D282) calculates these metrics:
-
Earned Discounts Taken
-
Unearned Discounts Taken
-
Discounts Not Taken
-
Percentage of Invoices for Which an Earned Discount was Taken
-
Percentage of Invoices for Which an Unearned Discount was Taken
-
Percentage of Invoices for Which a Discount was Available but Not Taken
The system retrieves transactions from the Receipts Detail table (F03B14) table based on these criteria:
-
Discount Available (ADSC) is not equal to zero.
-
Voided Flag (VDGJ) is blank.
-
Receipt G/L Date (GDJ) is equal to the starting date specified in the processing option.
The system uses the value in the Number of Days to Rebuild processing option to determine the general ledger date to retrieve transactions.
The system also retrieves the business unit from the F03B14 table and the company from the F0006 table based on the business unit in the AR Discount Information Aggregate table (F80D282).
|
Note: The system considers discounts on paid invoices only when you run the R80D282 program. |
The system performs these calculations to derive the AR discount metrics:
-
Earned Discounts Taken: Sums the earned discount taken for all transactions retrieved for each general ledger date by business unit.
To determine whether the discount taken was earned, the system compares the general ledger date of the receipt against the discount due date of the invoice. If the receipt general ledger date is on or before the discount due date of the invoice, the discount is earned. The only time that the discounts not taken will be different from the discounts available is when a partial discount is taken.
(Earned Discounts Taken = Sum earned discounts taken)
-
Unearned Discounts Taken: Sums the unearned discount taken for all transactions retrieved for each general ledger date by business unit.
To determine whether the discount taken was unearned, the system compares the general ledger date of the receipt against the discount due date of the invoice. If the receipt general ledger date is on or after the discount due date of the invoice, the discount is unearned.
(Unearned Discounts Taken = Sum unearned discounts taken)
-
Discounts Not Taken: Sum the Discount Available (ADSC) for all transactions retrieved and subtracts the discounts taken, both earned and unearned, for each general ledger date by business unit.
(Discounts Not Taken = Sum discounts available – Earned Discounts taken)
-
Percentage of Invoices for Which a Discount was Taken: Divides the number of invoices with an earned discount taken by the number of invoices with a discount available and then multiples by 100.
=Number of invoices with an earned discount taken Number of invoices with a discount availableÃ100
-
Number of invoices with an earned discount taken: Counts the number of invoices for which an earned discount was taken (ADSA is not equal to zero) and the receipt date is on or before the invoice due date for each general ledger date by business unit.
-
Number of invoices with a discount available: Counts the number of paid invoices for which a discount was available (ADSC is not equal to zero) for each general ledger date by business unit.
-
Percentage of Invoices for Which an Unearned Discount was Taken: Divides the number of invoices with an unearned discount taken by the number of invoices with a discount available and then multiples by 100.
=Number of invoices with an unearned discount taken Number of invoices with a discount availableÃ100
-
Number of invoices with an unearned discount taken: Counts the number of invoices for which an unearned discount was taken (ADSA is not equal to zero) and the receipt date is after the discount due date on the invoice for each general ledger date by business unit.
-
Percentage of Invoices for Which a Discount was Available but Not Taken: Divides the number of invoices for which a discount was not taken by the number of invoices with a discount available and then multiples by 100.
P=Number of invoices for which a discount was not taken Number of invoices with a discount availableÃ100
-
Number of invoices for which a discount was not taken: Counts the number of invoices for which a discount was not taken (the difference between ADSC and ADSA is not equal to zero) for each general ledger date by business unit.
The system stores the AR discounts information values in the F80D282 table. The AR discount metrics are accurate as of the last date that you ran the AR Discounts program. Oracle recommends that you run the program daily for trending purposes.
|
Note: If you change the data store currency, modify the business units associated with accounts, or update the company associated with the business unit, you must run a full load of data to the F80D282 table. To do this, either clear the table or set the Number of Days to Rebuild processing option beyond the general ledger date of the first eligible record. |
4.5.5.1 Discount Information Example
You have this discount information in the F03B14 table:
| Invoice Number | Discount Due Date | Discount Available | Discount Taken | Receipt General Ledger Date |
|---|---|---|---|---|
| 100 | February 14 | 100 USD | 100 USD (earned) | February 13 |
| 101 | February 15 | 200 USD | 200 USD (earned) | February 13 |
| 102 | February 1 | 200 USD | 200 USD (unearned) | February 10 |
| 103 | February 9 | 200 USD | 200 USD (earned) | February 8 |
| 104 | February 9 | 200 USD | 0 USD | February 11 |
If you run the R80D282 program on February 13, the system calculates:
- Earned Discount Taken
-
The system considers only invoices that have a receipt general ledger date on or before the discount due date, invoices 100, 101, and 103. The earned discount taken amount is 500 USD.
- Unearned Discount Taken
-
The system considers only invoices that have a receipt general ledger date after the discount due date, invoice 102. The unearned discount taken is 200 USD.
- Discount Not Taken
-
The system considers only invoices for which a discount was available but has not been taken, invoice 104. The discount not taken is 200 USD.
4.5.5.2 Discount Percentage Calculation Example
Using the data in the discount information example, if you run the R80D282 program on February 13, the system calculates:
- Percentage of Invoices for Which an Earned Discount was Taken
-
The number of paid invoices for which a discount was available is 5. The number of paid invoices for which an earned discount was taken is 3. Therefore, the percentage of invoices for which an earned discount was taken = (3 ÷ 5) à 100 or 60 percent.
- Percentage of Invoices for Which an Unearned Discount was Taken
-
The number of paid invoices for which a discount was available is 5. The number of paid invoices for which an unearned discount was taken is 1.Therefore, the percentage of invoices for which an unearned discount was taken = (1 ÷ 5) à 100 or 20 percent.
- Percentage of Invoices for Which a Discount was Available but Not Taken
-
The number of paid invoices for which a discount was available is 5. The number of paid invoices for which a discount was not taken is 1. Therefore, the percentage of invoices for which a discount was available but not taken = (1 ÷ 5) à 100 or 20 percent.
4.5.6 Analyzing AR Discounts
Access the appropriate metric group on the Fin Mgmt & Compliance Console form.
The system presents the AR discount information metrics (Earned Discounts Taken, Unearned Discounts Taken, and Discounts not Taken) in a cluster bar chart that shows the discount amount (Y axis) for the date that the system calculated the metric (X axis):
Day is the default value for the date range. You can also review the chart by week, month, quarter, or year date ranges. The system displays the values for all previous AR discount amounts in the chart. If an AR discount information amount calculation is zero, the system displays a zero value bar for the date. If no calculation was performed for a period, the system does not display a bar.
The system presents the AR discount percentage metrics (Percentage of Invoices for Which an Earned Discount was Taken, Percentage of Invoices for Which an Unearned Discount was Taken, and Percentage of Invoices for Which a Discount was Available but Not Taken) in a pie chart that shows the percentage of discounts (Y axis) for the date that the system calculated the metric (X axis):
Pie charts do not have a variant; therefore, you cannot drill into detail data for the metric.
4.5.7 Setting Processing Options for the AR Daily Counts and Amounts Program (R80D280)
Processing options enable you to specify the default processing for the AR Daily Counts and Amounts program.
4.5.7.1 Defaults
This processing option controls the print output and the number of days that the system uses to load data.
- 1. Number of Days to Rebuild
-
Enter the number of days that the system uses to rebuild the data.
If you leave this processing option blank, the system retrieves records where the general ledger date is greater than or equal to the last processing date in the AR Daily Counts and Amounts Aggregate table (F80D280) and less than or equal to the current date. If no processing date is in the table, the system runs an initial full load of data.
For incremental loads that specify to rebuild the table for a specific number of days, the system subtracts the number of days entered in the processing option from the current date. The system retrieves only records with a general ledger date that is on or after the calculated rebuild date.
If you run the program twice in the same day, the system replaces the existing records for the day in the F80D280 table with new records.
4.5.7.2 Display
This processing option controls the print output.
- 1. Level of Detail to Print
-
Specify whether the system prints a detailed report or errors only. Values are:
-
Blank: The system prints errors only.
-
1: The system prints a detailed report of the processed records and any errors generated.
-
4.5.8 Running the AR Daily Counts and Amounts Program
Enter BV in the Fast Path field, and then enter R80D280 in the Batch Application field.
The AR Daily Counts and Amounts program (R80D280) calculates the Amount Invoiced for the Day, the Amount Received for the Day, the Number of Invoices Entered for the Day, the Number of Receipts Entered for the Day, and the Average Amount Invoiced for the Day metrics.
The system retrieves transactions from the F03B11 table based on theses criteria:
-
Void Date (VDGJ) is blank.
-
Document Type (DCT) is not equal to RU, R1, or R5.
-
G/L Date (DGJ) is equal to the starting date specified in the processing option.
The system uses the value in the Number of Days to Rebuild processing option to determine the general ledger date to retrieve transactions.
The system retrieves transactions from the F03B13 table based on these criteria:
-
Void Date (VDGJ) is blank.
-
Receipt G/L Date (DGJ) is equal to the starting date specified in the processing option.
The system uses the value in the Number of Days to Rebuild processing option to determine the general ledger date to retrieve transactions.
The system also retrieves the business unit from the F0901 table and the company from the Business Unit Master table (F0006) based on the business unit in the AR Daily Counts and Amounts Aggregate table (F80D280).
The system performs these calculations to derive the AR daily counts and amounts metrics:
-
Amount Invoiced for the Day: Sums the value of the Gross Amount field (AG) for the invoices retrieved for each day by business unit.
(Amount Invoiced for the Day = Sum gross amount of invoices)
-
Amount Received for the Day: Sums the value of the Receipt Amount field (CKAM) for the receipts retrieved for each day by business unit.
(Amount Received for the Day = Sum receipt amounts)
-
Average Amount Invoiced for the Day: Divides the total invoice amount by the number of invoices entered for the day by business unit.
(Average Amount Invoiced for the Day = Total invoice amount ÷ Number of invoices)
-
Number of Invoices Entered for the Day: Counts the number of invoices retrieved for the day by business unit where the document number, document type, and document company combination is unique.
-
Number of Receipts Entered for the Day: Counts the number of records retrieved for the day by business unit.
The system stores the AR daily counts and amounts values in the F80D280 table. The system records data to the F80D280 table only when the R80D280 program runs successfully. If any errors appear on the report, the system does not create any records in the F80D280 table. The AR daily counts and amounts metrics are accurate as of the last date that you ran the R80D280 program. Oracle recommends that you run the program daily for trending purposes.
|
Note: If you change the data store currency, modify the business units associated with accounts, or update the company associated with the business unit, you must run a full load of data to the F80D280 table. To do this, either clear the table or set the Number of Days to Rebuild processing option beyond the general ledger date of the first eligible record. |
|
Note: The system does not use data selection criteria for the R80D280 program. The system processes all data from the source tables regardless of the data selection criteria. |
4.5.9 Analyzing AR Daily Counts and Amounts
Access the appropriate metric group on the Fin Mgmt & Compliance Console form.
The system presents the AR daily amount metrics (Amount Invoiced for the Day and Amount Received for the Day) in a cluster bar chart that shows the amount invoiced and received (Y axis) for the date that the system calculated the metric (X axis):
Figure 4-13 AR Invoice and Receipts Amounts chart
Description of "Figure 4-13 AR Invoice and Receipts Amounts chart"
Day is the default value for the date range. You can also review the chart by week, month, quarter, or year date ranges. The system displays the values for all previous AR daily amounts in the chart. If an AR daily amount calculation is zero, the system displays a zero value bar for the date. If no calculation was performed for a period, the system does not display a bar.
The system presents the AR daily count metrics (Number of Invoices Entered for the Day and Number of Receipts Entered for the Day) in a cluster bar chart that shows the number of invoices and receipts (Y axis) for the date that the system calculated the metric (X axis):
Figure 4-14 AR Invoice and Receipt Counts chart
Description of "Figure 4-14 AR Invoice and Receipt Counts chart"
Day is the default value for the date range. You can also review the chart by week, month, quarter, or year date ranges. The system displays the values for all previous AR daily counts in the chart. If an AR daily count calculation is zero, the system displays a zero value bar for the date. If no calculation was performed for a period, the system does not display a bar.
The system displays the Average Amount Invoiced for the Day in a bar chart that shows the average amount (Y axis) for the date that the system calculated the metric (X axis):
Figure 4-15 AR Average Invoice Amounts chart
Description of "Figure 4-15 AR Average Invoice Amounts chart"
Day is the default value for the date range. You can also review the chart by week, month, quarter, or year date ranges. The system displays the values for all previous averages in the chart. If the average is zero, the system displays a zero value bar for the period. If no calculation was performed for a date, the system does not display a bar.
4.5.10 Setting Processing Options for the AR Open Receivables Data Load Program (R80D284)
Processing options enable you to specify the default processing for the AR Open Receivables program.
4.5.10.1 Display
This processing option controls the print output.
- 1. Level of Details to Print
-
Specify whether the system prints a detailed report or errors only. Values are:
-
Blank: The system prints errors only.
-
1: The system prints a detailed report of the processed records and any errors that were generated.
-
4.5.11 Running the AR Open Receivables Data Load Program
Enter BV in the Fast Path field, and then enter R80D284 in the Batch Application field.
The AR Open Receivables Data Load program (R80D284) calculates the Amount of Open Invoices and Number of Open Invoices metrics.
The system retrieves transactions from the F03B11 table based on these criteria:
-
Void Date (VDGJ) is blank.
-
Open Amount (AAP) is not equal to zero.
-
Document Type (DCT) is not equal to RU, R1, or R5.
-
G/L Date (DGJ) is less than the date that you run the program plus one month.
The system does not include open invoices that have a general ledger date that is more than one month in the future from the run date of the R80D284 program.
The system also retrieves the business unit from the F03B11 table and the company from the F0006 table based on the business unit in the AR Open Receivables Aggregate table (F80D284).
The system performs these calculations to derive the open receivables metrics:
-
Amount of Open Invoices: Sums the value of the Open Amount field (AAP) for all records retrieved.
(Amount of Open Invoices = Sum of open amounts)
-
Number of Open Invoices: Counts the number of invoices retrieved where the document number, document type, and document company combination is unique.
The system stores the Amount of Open Invoices and the Number of Open Invoices values in the F80D284 table. The AR open receivables metrics are accurate as of the last date that you ran the R80D284 program. Oracle recommends that you run the program weekly for trending purposes.
|
Note: If you change the data store currency, modify the business units associated with accounts, or update the company associated with the business unit, you must run a full load of data to the F80D284 table. |
4.5.11.1 Amount of Open Invoices Example
You have invoices with these open amounts and dates in the F03B11 table:
| Invoice Number | General Ledger Date | Open Amount |
|---|---|---|
| 101 | February 15 | 200 USD |
| 102 | February 20 | 300 USD |
| 103 | March 1 | 200 USD |
If you run the R80D284 program on February 15, the system considers the open amount from the run date of the program plus one month, in this case March 15. Therefore, the amount of open invoices is equal to 700 USD.
4.5.11.2 Number of Open Invoices Example
This table shows the data in the F03B11 table:
| Invoice Number | Line Number | Business Unit | General Ledger Date | Document Number | Document Type | Company |
|---|---|---|---|---|---|---|
| 101 | 1 | 001 | February 15 | 2000 | RI | 00001 |
| 102 | 2 | 001 | February 16 | 2000 | RI | 00001 |
| 103 | 1 | 001 | February 17 | 2000 | RF | 00001 |
| 104 | 1 | 002 | February 18 | 2001 | RI | 00001 |
| 105 | 1 | 001 | February 19 | 2002 | RI | 00002 |
| 106 | 1 | 001 | March 19 | 2003 | RI | 00002 |
If you run the R80D284 program on February 15, the system:
-
Counts document number 2000 as 1, even though two pay items are on the invoice.
-
Does not include invoice 106 because the general ledger date is later than February 15 plus 30 days.
-
Counts the other items as one each, because they have unique document number, document type, and document company combinations.
4.5.12 Analyzing AR Open Receivables
Access the appropriate metric group on the Fin Mgmt & Compliance Console form.
The system presents the Amount of Open Invoices metric as a bar chart that shows the amount (Y axis) for the date that the system calculated the metric (X axis):
Day is the default value for the date range. The system displays the values for all previous Amount of Open Invoices in the chart. If an Amount of Open Invoices calculation is zero, the system displays a zero value bar for the date. If no calculation was performed for a period, the system does not display a bar.
The system presents the Number of Open Invoices metric as a bar chart that shows the count (Y axis) for the date that the system calculated the metric (X axis):
Day is the default value for the date range. The system displays the values for all previous Number of Open Invoices in the chart. If a Number of Open Invoices calculation is zero, the system displays a zero value bar for the date. If no calculation was performed for a period, the system does not display a bar.
4.5.13 Setting Processing Options for the AR Delinquency Data Load Program (R80D281)
Processing options enable you to specify the default processing for the AR Delinquency Data Load program.
4.5.13.1 Display
This processing option controls the print output.
- 1. Level of Detail to Print
-
Specify whether the system prints a detailed report or errors only. Values are:
-
Blank: The system prints errors only.
-
1: The system prints a detailed report of the processed records and any errors that were generated.
-
4.5.14 Running the AR Delinquency Data Load Program
Enter BV in the Fast Path field, and then enter R80D281 in the Batch Application field.
The AR Delinquency Data Load program (R80D281) calculates the Open Amount of Past Due Invoices, the Amount of Open Delinquency Fees, the Number of Past Due Invoices, and the Number of Customers with Past Due Invoices metrics.
The system retrieves transactions from the F03B11 table based on these criteria:
-
Voided Flag (VDGJ) is blank.
-
Open Amount (AAP) is not equal to zero.
-
Document Type (DCT) is not equal to RU, R1, or R5.
The system also retrieves the business unit from the F03B11 table and the company from the F0006 table based on the business unit in the AR Delinquency Aggregate table (F80D281).
The system performs these calculations to derive the AR delinquency metrics:
-
Open Amount of Past Due Invoices: Sums the value of the Open Amount field (AAP) for all invoices where the invoice due date is before the run date of the R80D281 program.
(Open Amount of Past Due Invoices = Sum of the open amounts)
-
Amount of Open Delinquency Fees: Sums the value of the Open Amount field (AAP) for all invoices retrieved that have a RF document type.
(Amount of Open Delinquency Fees = Sum of open amounts with RF document type)
-
Number of Past Due Invoices: Counts the invoice records retrieved where the invoice due date is before the run date of the R80D281 program, and the document number, document type, and document company combination is unique.
-
Number of Customers with Past Due Invoices: Counts the records retrieved where the invoice due date is before the run date of the R80D281 program and the address book number (AN8) is unique.
The system stores the Open Amount of Past Due Invoices, Amount of Open Delinquency Fees, Number of Past Due Invoices, and Number of Customers with Past Due Invoices values in the F80D281 table. The AR delinquency information metrics are accurate as of the last date that you ran the AR Delinquency Information program. Oracle recommends that you run the program weekly for trending purposes.
|
Note: If you change the console data store currency, modify the business units associated with accounts, or update the company associated with the business unit, you must run a full load of data to the F80D281 table. |
4.5.14.1 Delinquency Amounts Example
You have invoices with these due dates and open amounts:
| Invoice Number | Due Date | Open Amount | Document Type |
|---|---|---|---|
| 100 | February 14 | 100 USD | RI |
| 101 | February 15 | 200 USD | RI |
| 102 | April 01 | 200 USD | RI |
| 103 | February 09 | 200 USD | RI |
| 104 | March 10 | 200 USD | RF |
| 105 | March 12 | 200 USD | RF |
If you run the R80D281 program on February 16, the system considers only the invoices with a due date prior to February 16, invoices 100, 101, and 103.
4.5.14.2 Delinquency Counts Example
You have invoices with these due dates and open amounts:
| Invoice Number | Due Date | Open Amount | Customer |
|---|---|---|---|
| 100 | February 14 | 100 USD | 4242 |
| 101 | February 15 | 200 USD | 4242 |
| 102 | April 01 | 200 USD | 6262 |
| 103 | February 09 | 200 USD | 8282 |
| 104 | February 09 | 200 USD | 9898 |
| 105 | June 09 | 200 USD | 9898 |
If you run the R80D281 program on February 16, the system considers only the invoices with a due date prior to February 16, invoices 100, 101, 103, and 104.
4.5.15 Analyzing AR Delinquency Information
Access the appropriate metric group on the Fin Mgmt & Compliance Console form.
The system presents the AR delinquency information amount metrics (Open Amount of Past Due Invoices and Amount of Open Delinquency Fees) in a cluster bar chart that shows the amount past due and delinquency fees (Y axis) for the date that the system calculated the metric (X axis):
Day is the default value for the date range. The system displays the values for all previous AR delinquency amounts in the chart. If an AR delinquency amount calculation is zero, the system displays a zero value bar for the date. If no calculation was performed for a period, the system does not display a bar.
The system presents the AR delinquency count metrics (Number of Past Due Invoices and Number of Customers with Past Due Invoices) in a cluster bar chart that shows the number of past due invoices and customers with past due invoices (Y axis) for the date that the system calculated the metric (X axis):
Day is the default value for the date range. The system displays the values for all previous AR delinquency counts in the chart. If an AR delinquency count calculation is zero, the system displays a zero value bar for the date. If no calculation was performed for a period, the system does not display a bar.
You can define goal values for the Number of Past Due Invoices and the Number of Customers with Past Due Invoices metrics. The goal value is a single numerical value that represents the target number of past-due invoices or customers with past-due invoices. If the metric exceeds the goal value, the system considers the goal breached. The system displays the goal value as a diamond marker for each bar on the chart.
4.5.16 Setting Processing Options for the AR Open Chargeback Information Data Load Program (R80D283)
Processing options enable you to specify the default processing for the AR Open Chargeback Information Data Load program.
4.5.16.1 Display
This processing option controls the print output.
- 1. Level of Details to Print
-
Specify whether the system prints a detailed report or errors only. Values are:
-
Blank: The system prints errors only.
-
1: The system prints a detailed report of the processed records and any errors that were generated.
-
4.5.17 Running the AR Open Chargeback Information Data Load Program
Enter BV in the Fast Path field, and then enter R80D283 in the Batch Application field.
The AR Open Chargeback Information Data Load program (R80D283) calculates the Open Chargeback Amount and Open Chargeback Amount by Reason Code metrics.
The system retrieves transactions from the Customer Ledger table (F03B11) based on these criteria:
-
Void Date (VDGJ) is blank.
-
Document Type (DCT) is equal to RB.
-
Open Amount (AAP) is not equal to zero.
The system retrieves transactions from the Receipts Detail table (F03B14) based on these criterion:
-
Original Document Number (ODOC) in the F03B14 table is equal to the Document Number (DOC) from the F03B11 table.
-
Original Document Type (ODCT) in the F03B14 table is equal to the Document Type (DCT) from the F03B11 table.
-
Original Document Company (OKCO) in the F03B14 table is equal to the Document Company (KCO) from the F03B11 table.
The system also retrieves the business unit from the F03B11 table and the company from the Business Unit Master table (F0006) based on the business unit in the AR Open Chargeback Aggregate table (F80D283).
The system performs these calculations to derive the AR open chargeback metrics:
-
Open Chargeback Amount: Sums the Open Amount (AAP) for all records retrieved by business unit. (Open Chargeback Amount = Sum of open amounts)
-
Open Chargeback Amount by Reason Code: Sums the Open Amount (AAP) for all records retrieved by business unit and reason code.
(Open Chargeback Amount = Sum of open amounts for each reason code)
The system stores the open chargeback amount values and reason codes in the F80D283 table. The AR open chargebacks metrics are accurate as of the last date that you ran the R80D283 program. Oracle recommends that you run the program weekly for trending purposes.
|
Note: If you change the data store currency, modify the business units associated with accounts, or update the company associated with the business unit, you must run a full load of data to the F80D283 table. |
4.5.17.1 Open Chargebacks Example
This table shows the records in the F03B11 table:
| Business Unit | General Ledger Date | Payment ID | Document Number | Document Type | Document Company | Open Amount |
|---|---|---|---|---|---|---|
| 0010 | April 30 | 6863 | 101 | RB | 0010 | 950 EUR |
| 0010 | April 30 | 6863 | 102 | RB | 0010 | 50 EUR |
| 0010 | April 30 | 6863 | 103 | RB | 0010 | 1000 EUR |
| 0011 | May 30 | 6864 | 104 | RB | 0010 | 2450 EUR |
| 0011 | May 30 | 6864 | 105 | RB | 0010 | 0 EUR |
| 0011 | May 30 | 6864 | 106 | RB | 0010 | 5000 EUR |
Using the data in the previous table, if you run the R80D283 program on May 30, the system sums the open amount by business unit:
-
Business unit 0010 has an open chargeback amount of 2000 EUR.
-
Business unit 0011 has an open chargeback amount of 7450 EUR.
4.5.17.2 Open Chargebacks by Reason Code Example
Reason codes can include damaged goods (DG) and disputed amount (DA). You have these records in the F03B11 table:
| Business Unit | General Ledger Date | Document Number | Chargeback Reason Code | Chargeback Amount |
|---|---|---|---|---|
| 0010 | January 1 | 101 | DG | 950 EUR |
| 0010 | January 17 | 102 | DA | 0 EUR |
| 0010 | February 10 | 103 | DA | 1000 EUR |
| 0010 | February 15 | 104 | DG | 3450 EUR |
| 0011 | March 10 | 105 | DG | 0 EUR |
| 0011 | March 12 | 106 | DA | 6000 EUR |
Using the data in the previous table, if you run the R80D283 program on March 14, the system sums the open amount by business unit by reason code:
-
Business unit 0010 has an open chargeback amount of 950 EUR for damaged goods and 1000 EUR for disputed amounts.
-
Business unit 0011 has an open chargeback amount of 3450 EUR for damaged goods and 6000 EUR for disputed amounts
4.5.18 Analyzing AR Open Chargebacks
Access the appropriate metric group on the Fin Mgmt & Compliance Console form.
The system presents the AR Open Chargeback Amount metric as a bar chart that shows the amount (Y axis) for the date that the system calculated the metric (X axis):
Figure 4-20 AR Open Chargeback Amount chart
Description of "Figure 4-20 AR Open Chargeback Amount chart"
The system presents the AR Open Chargeback Amount by Reason Code metric as a bar chart that shows the amount (Y axis) for the date that the system calculated the metric (X axis):
Figure 4-21 AR Open Chargeback by Reason Code chart
Description of "Figure 4-21 AR Open Chargeback by Reason Code chart"
Day is the default value for the date range. The system displays the values for all previous AR Open Chargebacks Amounts and AR Open Chargebacks Amounts by Reason Code in the chart. If an AR Open Chargebacks Amount calculation is zero, the system displays a zero value bar for the date. If no calculation was performed for a period, the system does not display a bar.
4.5.19 Setting Processing Options for the AR Total Chargeback Information Data Load Program (R80D285)
Processing options enable you to specify the default processing for the AR Total Chargeback Information Data Load program.
4.5.19.1 Defaults
This processing option controls the number of days that the system uses to load data.
- 1. Number of Days to Rebuild
-
Enter the number of days that the system uses to rebuild the data.
If you leave this processing option blank, the system retrieves records for which the general ledger date is greater than or equal to the last processing date in the AR Total Chargebacks table (F80D285) and less than or equal to the current date. If no processing date is in the table, the system runs an initial full load of data.
For incremental loads that specify to rebuild the table for a specific number of days, the system subtracts the number of days entered in the processing option from the current date. The system retrieves only records with a general ledger date that is on or after the calculated rebuild date.
If you run the program twice in the same day, the system replaces the existing records for the day in the F80D285 table with new records.
4.5.19.2 Display
This processing option controls the print output.
- 1. Level of Detail to Print
-
Specify whether the system prints a detailed report or errors only. Values are:
-
Blank: The system prints errors only.
-
1: The system prints a detailed report of the processed records and any errors that were generated.
-
4.5.20 Running the AR Total Chargeback Information Data Load Program
Enter BV in the Fast Path field, and then enter R80D283 in the Batch Application field.
The AR Total Chargeback Information Data Load program (R80D285) calculates the Total Chargeback Amount and Total Chargeback Amount by Reason Code metrics.
The system retrieves transactions from the F03B14 table based on these criteria:
-
Void Date (VDGJ) is blank.
-
Chargeback Amount (ECBA) is not equal to zero.
-
Receipt G/L Date (DGJ) is equal to the starting date specified in the processing option.
The system uses the value in the Number of Days to Rebuild processing option to determine the general ledger date to use to retrieve transactions.
The system also retrieves the business unit from the F03B14 table and the company from the F0006 table based on the business unit in the F80D285 table.
The system performs these calculations to derive the AR total chargeback metrics:
-
Total Chargeback Amount: Sums the chargeback amount value for all records retrieved for each general ledger date by business unit and reason code.
(Total Chargeback Amount = Sum of chargeback amounts)
-
Total Chargeback Amount by Reason Code: Sums the total amount for all records retrieved by business unit and reason code.
Reason codes can include damaged goods and disputed amount.
(Total Chargeback Amount = Sum of total amounts for each reason code)
The system stores the total chargeback amount values and reason codes in the AR Total Chargeback Aggregate table (F80D285) table. The AR total chargeback metrics are accurate as of the last date that you ran the R80D285 program. Oracle recommends that you run the program weekly for trending purposes.
|
Note: If you change the console data store currency, modify the business units associated with accounts or update the company associated with the business unit. You must run a full load of data to the F80D285 table. |
4.5.20.1 Total Chargebacks Example
This table shows the data in the F03B14 table:
| Business Unit | General Ledger Date | Document Number | Chargeback Reason Code | Chargeback Amount |
|---|---|---|---|---|
| 0010 | January 1 | 101 | DA | 950 EUR |
| 0010 | January 17 | 102 | DG | 0 EUR |
| 0010 | February 10 | 103 | GR | 1000 EUR |
| 0011 | February 15 | 104 | PD | 3450 EUR |
| 0011 | March 10 | 105 | DA | 0 EUR |
| 0011 | March 12 | 106 | DA | 6000 EUR |
Using the data in the previous table, if you run the R80D285 program on March 14 and have the Number of Days to Rebuild processing option set to 60, the system sums the total amount by business unit for January 13 to March 14:
-
Business unit 0010 has a total chargeback amount of 1000 EUR on February 10.
-
Business unit 0011 has a total chargeback amount of 3450 EUR on February 15 and 6000 EUR on March 12.
4.5.21 Analyzing AR Total Chargebacks
Access the appropriate metric group on the Fin Mgmt & Compliance Console form.
The system presents the Total Chargeback Amount metric as a bar chart that shows the amount (Y axis) for the date that the system calculated the metric (X axis):
The system presents the Total Chargeback Amount by Reason Code metric as a bar chart that shows the amount (Y axis) for the date that the system calculated the metric (X axis):
Figure 4-23 AR Total Chargeback by Reason Code chart
Description of "Figure 4-23 AR Total Chargeback by Reason Code chart"
Day is the default value for the date range. You can also review the chart by week, month, quarter, or year date ranges. The system displays the values for all previous Total Chargebacks Amounts and Total Chargebacks Amounts by Reason Code in the chart. If a Total Chargebacks Amount calculation is zero, the system displays a zero value bar for the date. If no calculation was performed for a date, the system does not display a bar.
4.6 Managing Account Balance Information
This section provides overviews of the general ledger balance fact load programs, activity ratios, leverage ratios, liquidity ratios, actual versus planned operating income, operating expense, and operating profit, and profitability ratios, lists prerequisites, and discusses how to:
-
Set processing options for the G/L Balances Fact Full Load UBE program (R80D0201).
-
Set processing options for the G/L Balances Fact Rebuild UBE program (R80D0202).
-
Run the general ledger balances fact load programs.
-
Analyze fixed asset turnover.
-
Analyze inventory turnover.
-
Analyze total asset turnover.
-
Analyze debt to total assets.
-
Analyze times interest earned.
-
Analyze current ratio.
-
Analyze quick acid test.
-
Analyze actual versus planned operating income, expense, and profit.
-
Analyze profit margin on sales.
-
Analyze return on net worth.
-
Analyze return on total assets.
|
Note: If you set up separate balance sheet and income statement business units, the system does not display a ratio when you drill down or view by business unit if the ratio uses both business units. For example, for the Fixed Asset Turnover ratio, the system divides the sales amount (income statement accounts) by the fixed asset amount (balance sheet accounts); therefore, if you set up these accounts in separate business units, the system does not calculate the ratio when you view by or drill down to a specific business unit because it requires both business units. If you set up balance sheet and income statement accounts in the same business unit, the view by and drill down features display the ratio appropriately. |
4.6.1 Understanding the General Ledger Balances Fact Load Programs
Before you can display the financial ratios metrics and the actual versus planned operational metrics, you must run the G/L Balances Fact Full Load UBE program (R80D0201). After you run the R80D0201 program to load the initial data, you use the G/L Balances Fact Rebuild UBE program (R80D0202) for incremental loads.
When you run the R80D0201 program or the R80D0202 program, the system:
-
Retrieves account balance information from the Account Balances table (F0902) based on the ledger types specified in the processing options.
-
Translates the period number to the appropriate period ending date using the fiscal date pattern that is assigned to the company of the account.
For example, if company 00001 uses a fiscal date pattern of June 1 through May 31, then period 1 would be translated to a period ending date of June 30. This translation allows the console to display amounts based on a date such as month, quarter, or year, instead of a period number.
-
Converts actual amounts, if necessary, to the analytics data store currency.
-
Assigns an AAI code to the account according to the AAI range used.
-
Adds the values from the AN13 and AN14 fields to the value for AN12 before performing additional calculations.
-
Adds the values from the APYC field with the value from the AN01 field and stores the value for cumulative accounts.
The system retrieves this information from the F0902 table:
-
Ledger Type (LT).
-
Fiscal Year (FY).
-
Business Unit (MCU).
-
Beginning Balance (APYC).
-
Currency Code (CRCX).
-
Net Posting fields (AN01 through AN14).
The R80D0201 program creates records in the G/L Balances Fact table (F80D020) for all transactions in the F0902 table based on date data selection. The R80D0202 program refreshes the records in the F80D020 table for the current fiscal year. If the current period is 1, the system refreshes the current fiscal year and the prior fiscal year. The period definition in the Company Master table (F0010) determines the beginning period of each company.
4.6.1.1 Object Accounts
The system retrieves data from the F0902 table based on the object accounts and ranges specified by the AAIs in the Automatic Accounting Instructions Master table (F0012) and the ledger type equaling the value set in the processing options. The system retrieves the range of object accounts using this information:
| AAI Range | Accounts |
|---|---|
| F01 through F06 | Current assets accounts |
| F01 through F09 | Total asset accounts |
| F01 through F14 | Net worth accounts |
| F04 through F05 | Inventory accounts |
| F07 through F08 | Fixed asset accounts |
| F10 through F11 | Current liability accounts |
| F12 through F13 | Long term debt accounts |
| F15 through F16 | Sales accounts |
| F15 through F28 | Income accounts and net profit after tax accounts |
| F20 through F21 | Interest expense accounts |
| F26 through F27 | Tax accounts |
|
Note: The system does not process records in the F0902 table with object accounts in the AAI range of F14 to F15. |
4.6.1.2 Balance Sheet Accounts
Balance sheet accounts are included in AAI range F01 through F14. The balance sheet accounts are cumulative amounts. The system adds the value of the Beginning Balance field (APYC) to the amount of the first period (AN01). For each subsequent period, the system adds the balance from the previous period. For example, the amount for period two (AN02) is equal to the cumulative balance of AN01 plus the period amount for AN02.
This tables illustrate how the system stores period amounts in the F0902 table:
| Account ID | APYC | AN01 | AN02 | AN03 |
|---|---|---|---|---|
| 1234 | 100,000 | 5000 | 6000 | 3000 |
This table shows the calculation required to derive the cumulative amounts for each period:
| Account ID | Period 1 | Period 2 | Period 3 |
|---|---|---|---|
| 1234 | 105,000 | 111,000 | 114,000 |
4.6.1.3 Income Statement Accounts
Income statement accounts are included in AAI range F15 through F28. The amounts are not cumulative and the system does not use the beginning balance amount (APYC). For income statement accounts, the system adds the value for all object accounts for the period (AN01 through AN14) by business unit.
This tables illustrate how the system stores period amounts in the F0902 table:
| Account ID | APYC | AN01 | AN02 | AN03 |
|---|---|---|---|---|
| 5678 | 100,000 | 5000 | 6000 | 3000 |
| 5678 | 50,000 | 2000 | 4000 | 1500 |
This table shows the calculation required to derive the amounts for each period:
| Account ID | Period 1 | Period 2 | Period 3 |
|---|---|---|---|
| 5678 | 7000 | 10,000 | 4500 |
4.6.1.4 Metrics
The system uses the data populated in the F80D020 table for these metrics:
-
Fixed Asset Turnover
-
Total Asset Turnover
-
Inventory Turnover
-
Times Interest Earned
-
Debt to Total Assets
-
Current Ratio
-
Quick Acid Test
-
Return on Total Assets
-
After Tax Profit on Sales
-
Profit Margin on Sales
-
Return on Net Worth
-
Actual versus Planned Operating Expense
-
Actual versus Planned Operating Income
-
Actual versus Planned Operating Profit
4.6.2 Understanding Activity Ratios
Fixed asset turnover measures how efficiently a company uses fixed assets to generate sales. A high fixed asset turnover is good. A low fixed asset turnover ratio means that inefficient utilization or obsolescence of fixed assets exists, which can be caused by excess capacity or interruptions in the supply of raw materials.
Inventory turnover ratio is an indicator of how the customer is trading. The metric shows the approximate number of times the customer is able to acquire the inventories and convert them into sales. A long inventory turnover period from one accounting year to the next indicates a slowdown in trading or a build in inventory levels, which suggests that inventory is becoming excessive. A high turnover ratio is good, but several aspects of holding inventory should be balanced including lead times, seasonal fluctuations in orders, alternative use of warehouse space, bulk discounts, and the perishability or obsolescence. Because inventory is the least liquid form of assets, a high inventory turnover ratio is generally positive. However, an unusually high ratio in comparison to the average for your industry could indicate that you are losing sales due to inadequate inventory stock on hand.
Total asset turnover determines how much sales revenue a company generates from investments in assets. Total assets includes investments in both fixed assets and inventory. Generally, a high total asset turnover ratio suggests greater efficiency.
These Activity Ratio metrics indicate how effectively the company's managers use the assets under their control:
| Activity Ratio Metric | Description |
|---|---|
| Fixed Asset Turnover | Shows the fixed asset turnover for each period. Fixed Asset Turnover is calculated as:
=Sales amount Fixed asset amount |
| Inventory Turnover | Represents the inventory turnover for each period. Inventory Turnover is calculated as:
=Cost of goods sold amount Inventory amount |
| Total Asset Turnover | Illustrates the total asset turnover for each period. Total Asset Turnover is calculated as:
=Sales amount Total asset amount |
4.6.3 Understanding Leverage Ratios
Leverage ratios tell the lender how much money has been borrowed versus the money that owners and others have put into the company. Leverage ratios are important because borrowed money carries interest costs and a company must generate sufficient cash flow to cover the interest and principal amounts due to the lender. Generally, companies with higher debt levels will have higher interest costs to cover each month; therefore, low to moderate leverage is more favorable to prospective lenders.
A company's financial risk can be measured by determining how much of the company's assets have been financed by debt. The debt to total assets measurement is calculated by adding short-term and long-term debt and then dividing by the company's total assets. The lower the debt ratio, the less total debt the company has in comparison to its asset base. Companies with high total debt ratios are in danger of becoming insolvent or going bankrupt.
The times interest earned ratio indicates the extent of which earnings are available to meet interest payments. A lower times interest earned ratio means that less earnings are available to meet interest payments and that the business is more vulnerable to increases in interest rates.
These Leverage Ratio metrics help in measuring the company's use of borrowed funds in relation to the amount of funds provided by shareholders and owners:
| Metric | Description |
|---|---|
| Debt to Total Assets | Represents the company's financial risk by determining how much of the company's assets are financed by debt. Debt to Total Assets ratio is calculated as:
= Total liability Total assets |
| Times Interest Earned | Measures the ability of the company to meet its annual interest payments. Times Interest Earned is calculated as:
=Income - Tax expense - Interest expense Interest expense |
4.6.4 Understanding Liquidity Ratios
A company should not provide information only on profitability, but should also provide information that indicates whether the company will be able to pay its creditors, expenses, and loans falling due at the correct times. A company may be profitable, but if it fails to generate enough cash to settle its liability, it is insolvent.
The current ratio compares assets that become liquid within 12 months with liabilities that are due for payment in the same period and indicates whether a company has sufficient short-term assets to meet the short-term liabilities. The higher the ratio, the more capable the company is of paying its obligations. The recommended current ratio is 2:1. A ratio under suggests that the company may face liquidity problems and would be unable to pay off its obligations if they came due at that point. While this shows that the company is not in good financial health, it does not necessarily mean that the company will go bankrupt. A ratio that is higher than 2:1 indicates over trading and the company is under-utilizing its current assets. The current ratio provides a sense of the efficiency of a company's operating cycle or its ability to turn its product into cash. Companies that have trouble getting paid on their receivables or have long inventory turnover can run into liquidity problems because they are unable to alleviate their obligations. Because business operations differ in each industry, comparing companies within the same industry is always more useful.
The quick acid test ratio shows whether a company has enough liquid resources to meet its current liabilities. The higher the quick ratio, the better the position of the company. Ideally the ratio is 1:1 for companies with a slow inventory turnover. For companies with a fast inventory turnover, the ratio can be less than 1 without suggesting cash flow problems. A supermarket might have a current ratio of 0.5 and a quick acid test ratio of 0.17. Supermarkets have low receivables, because sales are usually made on credit, low cash, and medium inventories due to high inventory but quick turnover. If a manufacturing company had these same ratios, it would be regarded as showing solvency problems. The quick ratio is more conservative than the current ratio because it excludes inventory from current assets. Inventory is excluded because some companies have difficulty turning their inventory into cash. In the event that short-term obligations need to be paid off immediately, situations occur in which the current ratio would overestimate a company's short-term financial strength.
These Liquidity Ratio metrics provide information about the ability of a company to meet short-term debt obligations and whether a company has enough liquid resources to meet current liabilities:
| Metric | Description |
|---|---|
| Current Ratio | Represents the ability of a company to meet short-term debt obligations. The Current Ratio is calculated as:
=Current assets Current liabilities |
| Quick Acid Test | Shows whether a company has sufficient liquid resources to meet current liabilities. The Quick Acid Test is calculated as:
=Current assets - Inventory Current liabilities |
4.6.5 Understanding Actual Versus Planned Operating Income, Operating Expense, and Operating Profit
Controllers and accountants use information for income and expense to manage profitability. The ability to review the income generated by a single company and multiple companies compared to expenses helps controllers manage their receivable and payable activities. Actual versus planned operating income, operating expense, and operating profit metrics provide the information that is required by controllers to determine whether the company is over or under their planned operating amounts.
These Actual Versus Planned metrics help in determining the overall financial health of the company and how well the capital of the company is managed:
| Metric | Description |
|---|---|
| Actual and Planned Operating Income Amounts | Illustrates the total amount of planned operating income versus the actual operating income. |
| Actual and Planned Operating Expense Amounts | Illustrates the total amount of planned operating expense versus the actual operating expense. |
| Actual and Planned Operating Profit | Illustrates the total amount of planned operating profit versus the actual operating profit. The Planned Operating Profit is calculated as:
Planned Operating Income – Planned Operating Expense The Actual Operating Profit is calculated as: Actual Operating Income – Actual Operating Expense |
4.6.6 Understanding Profitability Ratios
The objective of profitability relates to the ability of a company to earn a satisfactory profit so that the investors and shareholders continue to provide capital. A company's profitability is linked to its liquidity because earnings ultimately produce cash flow. For these reasons ratios are important to both investors and shareholders.
When calculating profitability ratios, you should always use the profit on ordinary activities before taxation because unusual variations might occur in the tax charge from year to year that would not affect the underlying profitability of the company.
Profit margin tells you how much profit a company makes for every monetary unit it generates in revenue. Profit margin varies by industry, but the metric is very useful for comparing competitive companies or companies in similar industries. A high profit margin indicates a company that has more control over costs compared to competitors, and is therefore a more profitable company. A low profit margin can indicate a poor pricing strategy or be the result of competition. Profit margin on sales ratio indicates the portion of sales that contribute to the income of a company. Using USD, a 20 percent profit margin means that a company earns 20 cents for each dollar of sales.
The after tax profit margin of a company is important because it shows investors the percentage of money that a company actually earns per monetary unit of sales. The ratio is interpreted in the same way as profit margin; the after tax profit margin is more stringent because it includes taxes.
Net worth is the value of total stockholders' equity. The return on net worth is often referred to as the return on owner's equity. The ratio provides a measure of the return on the owner's investment in the company. This ratio is also referred to as the return on investment. The higher the value of the ratio, the greater the return on the investment.
Return on assets (ROA) measures a company's earnings in relation to all of the resources that it has at its disposal, which includes shareholder's capital plus short-term and long-term borrowed funds. ROA tells an investor how much profit a company generated for each monetary unit in assets. This measurement is the most stringent and excessive test of return to shareholders. The ROA figure is also a way to gauge the asset intensity of a company. Companies such as telecommunication providers, car manufacturers, and railroads are very asset-intensive, meaning that they require big, expensive machinery or equipment to generate a profit. Alternately, advertising agencies and software companies are generally very asset-light.
If a company has no debt, the return on total assets and return on net worth figures are the same.
These Profitability Ratio metrics help in determining the ability of a company to earn a satisfactory profit:
| Metric | Description |
|---|---|
| Profit Margin on Sales | Represents the portion of sales that contribute to the income of a company. Profit Margin on Sales is calculated as:
=Net profit before tax Sales amountÃ100 |
| After Tax Profit on Sales | Illustrates the percentage of money that a company actually earns per monetary unit of sales. After Tax Profit on Sales is calculated as:
=Net profit after taxes Sales amountÃ100 |
| Return on Net Worth | Measures the return on the owner's investment in the company. Return on Net Worth is calculated as:
=Net profit before taxes Net worth amountÃ100 |
| Return on Total Assets | Measures the company's earnings in relation to the resources. Return on Total Assets is calculated as:
=Net profit before taxes Total asset amountÃ100 |
4.6.7 Prerequisites
Before you can complete the tasks in this section, you must set up AAI items F01 through F28 to define the account ranges that the system uses to retrieve balance information. The system includes all subsidiaries for the object account range defined.
4.6.8 Setting Processing Options for the G/L Balances Fact Full Load UBE Program (R80D0201)
Processing options enable you to specify the default processing for the G/L Balances Fact Full Load UBE program.
4.6.8.1 Display
This processing option controls the print output.
- 1. Level of Detail to Print
-
Specify whether the system prints a detailed report or errors only. Values are:
-
Blank: The system prints errors only.
-
1: The system prints a detailed report of the processed records and any errors generated.
-
4.6.8.2 Defaults
This processing option controls the ledger types that the system uses to load data.
- 1. Ledger Type to be considered as actuals
-
Enter the ledger type that the system uses as actual amounts.
If you leave this processing option blank, the system uses ledger type AA to load the actual amounts.
- 2. Ledger Type to be considered as budget
-
Enter the ledger type that the system uses as budget amounts.
If you leave this processing option blank, the system uses ledger type BA to load the budget amounts.
Do not change the actual and budget ledger types each time you run the R80D0201 program. The system stores records in the F80D020 table by the ledger types specified in the processing options. If you change the ledger types, the system uses both ledger types in the metric calculations. For example, if you specify AA as the actual ledger type the first time you run the program and CA as the actual ledger type the next time you run the program, the system considers both AA and CA records to calculate the metric ratios.
4.6.9 Setting Processing Options for the G/L Balances Fact Rebuild UBE Program (R80D0202)
Processing options enable you to specify the default processing for the G/L Balances Fact Rebuild UBE program.
4.6.9.1 Display
This processing option controls the print output.
- 1. Level of Detail to Print
-
Specify whether the system prints a detailed report or errors only. Values are:
-
Blank: The system prints errors only.
-
1: The system prints a detailed report of the processed records and any errors generated.
-
4.6.9.2 Defaults
This processing option controls the ledger types that the system uses to load data.
- 1. Ledger Type to be considered as actual
-
Enter the ledger type that the system uses for actual amounts.
If you leave this processing option blank, the system uses ledger type AA to load the actual amounts.
- 2. Ledger Type to be considered as budget
-
Enter the ledger type that the system uses for budget amounts.
If you leave this processing option blank, the system uses ledger type BA to load the budget amounts.
Do not change the actual and budget ledger types each time you run the R80D0201 program. The system stores records in the F80D020 table by the ledger types specified in the processing options. If you change the ledger types, the system uses both ledger types in the metric calculations. For example, if you specify AA as the actual ledger type the first time you run the program and CA as the actual ledger type the next time you run the program, the system considers both AA and CA records to calculate the metric ratios.
4.6.10 Running the General Ledger Balances Fact Load Programs
Enter BV in the Fast Path field, and then enter R80D0201 or R80D0202 in the Batch Application field.
The system stores the general ledger information in the G/L Balances Fact table (F80D020). The financial ratio metrics and the actual versus planned operational metrics are accurate as of the last date that you ran the R80D0201 program or the R80D0202 program. The system stores the last run date of the R80D0201 and R80D0202 programs in the PMD - UBE Timestamp table (F80D101) for informational purposes.
The R80D0201 and R80D0202 programs create records in the F80D020 table. Oracle recommends that you run the program weekly for trending purposes.
See Understanding the General Ledger Balances Fact Load Programs.
|
Note: If you change the console data store currency, modify the business units associated with accounts, or update the company associated with the business unit, you must run a full load of data to the F80D020 table using the R80D0201 program. |
4.6.11 Analyzing Fixed Asset Turnover
Access the appropriate metric group on the Fin Mgmt & Compliance Console form.
The system performs these calculations for the Fixed Asset Turnover metric:
-
Sales amount: Sums the amount for each period for all object accounts specified by AAI items defined by the financial account range dimension SA in the F80D021 table for ledger type specified in the processing options of the R80D0201 and R80D0202 programs.
-
Fixed asset amount: Sums the amount for each period for all object accounts specified by AAI items defined by the financial account range dimension FA in the F80D021 table for ledger type specified in the processing options of the R80D0201 and R80D0202 programs.
The fixed asset period amounts must be represented as cumulative amounts; therefore, the system adds the value of the beginning balance to the amount of the first period. For each subsequent period, the system adds the balance from the previous period.
Fixed Asset Turnover: Divides the sales amount for each period by business unit by the fixed asset amount for each period by business unit.
(Fixed Asset Turnover = Sales amount ÷ Fixed asset amount)
The system presents the Fixed Asset Turnover metric in a combo bar chart that shows the ratio number (Y axis) for the date that the system calculated the metric (X axis):
Month is the default value for the date range value. You can also review the chart by quarter or year date ranges. The system displays the values for all previous Fixed Asset Turnover ratios in the chart. If a Fixed Asset Turnover ratio calculation is zero, the system displays a zero value bar for the date. If no calculation was performed for a period, the system does not display a bar.
You can define tolerance limits for the Fixed Asset Turnover metric. The tolerance limits are numerical values that represent an upper and lower limit for the Fixed Asset Turnover ratio. If the metric exceeds the limits, the system considers the limit breached. The system displays the limit values as diamond markers for each bar on the chart.
4.6.12 Analyzing Inventory Turnover
Access the appropriate metric group on the Fin Mgmt & Compliance Console form.
The system performs these calculations for the Inventory Turnover metric:
-
Cost of goods sold amount: Sums the amount for each period for all object accounts specified by AAI items defined by the financial account range dimensions CG and IV in the F80D021 table respectively for ledger type specified in the processing options of the R80D0201 and R80D0202 programs.
-
Inventory amount: Sums the beginning balance amount and the cumulative amounts for each period for all object accounts in the range specified by AAI items F04 through F05 by business unit for ledger type specified in the processing options of the R80D0201 and R80D0202 programs.
The inventory period amounts must be represented as cumulative amounts; therefore, the system adds the value of the beginning balance to the amount of the first period. For each subsequent period, the system adds the balance from the previous period.
-
Inventory Turnover: Divides the cost of goods sold amount for each period by business unit by the inventory amount for each period by business unit.
(Inventory Turnover = Cost of goods sold amount ÷ Inventory amount)
The system presents the Inventory Turnover metric in a combo bar chart that shows the ratio number (Y axis) for the date that the system calculated the metric (X axis):
Month is the default value for the date range value. You can also review the chart by quarter or year date ranges. The system displays the values for all previous Inventory Turnover ratios in the chart. If an Inventory Turnover ratio calculation is zero, the system displays a zero value bar for the date. If no calculation was performed for a period, the system does not display a bar.
You can define tolerance limits for the Inventory Turnover metric. The tolerance limits are numerical values that represent an upper and lower limit for the Inventory Turnover ratio. If the metric exceeds the limits, the system considers the limit breached. The system displays the limit values as diamond markers for each bar on the chart.
4.6.13 Analyzing Total Asset Turnover
Access the appropriate metric group on the Fin Mgmt & Compliance Console form.
The system performs these calculations for the Total Asset Turnover metric:
-
Sales amount: Sums the amount for each period for all object accounts specified by AAI items defined by the financial account range dimension SA in the F80D021 table for ledger type specified in the processing options of the R80D0201 and R80D0202 programs.
-
Total asset amount: Sums the amount for each period for all object accounts specified by AAI items defined by the financial account range dimension TA in the F80D021 table for ledger type specified in the processing options of the R80D0201 and R80D0202 programs.
The total asset period amounts must be represented as cumulative amounts; therefore, the system adds the value of the beginning balance to the amount of the first period. For each subsequent period, the system adds the balance from the previous period.
-
Total Asset Turnover: Divides the sales amount for each period by business unit by the total asset amount for each period by business unit.
(Total Asset Turnover = Sales amount ÷ Total asset amount)
The system presents the Total Asset Turnover metric in a combo bar chart that shows the ratio number (Y axis) for the date that the system calculated the metric (X axis):
Month is the default value for the date range value. You can also review the chart by quarter or year date ranges. The system displays the values for all previous Total Asset Turnover ratios in the chart. If a Total Asset Turnover ratio calculation is zero, the system displays a zero value bar for the date. If no calculation was performed for a period, the system does not display a bar.
You can define tolerance limits for the Total Asset Turnover metric. The tolerance limits are numerical values that represent an upper and lower limit for the Total Asset Turnover ratio. If the metric exceeds the limits, the system considers the limit breached. The system displays the limit values as diamond markers for each bar on the chart.
4.6.14 Analyzing Debt to Total Assets
Access the appropriate metric group on the Fin Mgmt & Compliance Console form.
The system performs these calculations for the Debt to Total Assets metric:
-
Total liability amount: Sums the amount for each period for all object accounts specified by AAI items defined by the financial account range dimension TL in the F80D021 table for ledger type specified in the processing options of the R80D0201 and R80D0202 programs.
-
Total asset amount: Sums the amount for each period for all object accounts specified by AAI items defined by the financial account range dimension TA in the F80D021 table for ledger type specified in the processing options of the R80D0201 and R80D0202 programs.
The long term and total asset period amounts must be represented as cumulative amounts; therefore, the system adds the value of the beginning balance to the amount of the first period. For each subsequent period, the system adds the balance from the previous period.
-
Debt to Total Asset: Divides the long term debt amount for each period by business unit by the total asset amount for each period by business unit.
(Debt to Total Assets = Total liability amount ÷ Total asset amount)
The system presents the Debt to Total Assets metric in a combo bar chart that shows the ratio number (Y axis) for the date that the system calculated the metric (X axis):
Month is the default value for the date range value. You can also review the chart by quarter or year date ranges. The system displays the values for all previous Debt to Total Assets ratios in the chart. If a Debt to Total Assets ratio calculation is zero, the system displays a zero value bar for the date. If no calculation was performed for a period, the system does not display a bar.
You can define tolerance limits for the Debt to Total Assets metric. The tolerance limits are numerical values that represent an upper and lower limit for the Debt to Total Assets ratio. If the metric exceeds the limits, the system considers the limit breached. The system displays the limit values as diamond markers for each bar on the chart.
4.6.15 Analyzing Times Interest Earned
Access the appropriate metric group on the Fin Mgmt & Compliance Console form.
The system performs these calculations for the Times Interest Earned metric:
-
Income amount: Sums the amount for each period for all object accounts in the range specified by AAI items F15 through F28 by business unit for ledger type specified in the processing options of the R80D0201 and R80D0202 programs.
-
Tax expense amount: Sums the beginning balance amount and the cumulative amounts for each period for all object accounts in the range specified by AAI items F26 through F27 by business unit for ledger type specified in the processing options of the R80D0201 and R80D0202 programs.
-
Interest expense amount: Sums the amount for each period for all object accounts specified by AAI items defined by the financial account range dimension IT in the F80D021 table for ledger type specified in the processing options of the R80D0201 and R80D0202 programs.
-
Net income amount: Subtracts the tax expense and interest expense amounts from the income amount.(Net income amount = Income amount – Tax expense amount – Interest expense amount). When calculating the net income amount, the system sums the amount for each period for all object accounts specified by AAI items defined by the financial account range dimension IN in the F80D021 table for ledger type specified in the processing options of the R80D0201 and R80D0202 programs.
-
Times Interest Earned: Divides the net income amount, which is income minus tax expense minus interest expense, for each period by business unit by the interest expense amount for each period by business unit.
(Times Interest Earned = Net income amount ÷ Interest expense amount)
The system presents the Times Interest Earned metric in a combo bar chart that shows the ratio number (Y axis) for the date that the system calculated the metric (X axis):
Month is the default value for the date range value. You can also review the chart by quarter or year date ranges. The system displays the values for all previous Times Interest Earned ratios in the chart. If a Times Interest Earned ratio calculation is zero, the system displays a zero value bar for the date. If no calculation was performed for a period, the system does not display a bar.
You can define tolerance limits for the Times Interest Earned metric. The tolerance limits are numerical values that represent an upper and lower limit for the Times Interest Earned ratio. If the metric exceeds the limits, the system considers the limit breached. The system displays the limit values as diamond markers for each bar on the chart.
4.6.16 Analyzing Current Ratio
Access the appropriate metric group on the Fin Mgmt & Compliance Console form.
The system performs these calculations for the Current Ratio metric:
-
Current asset amount: Sums the amount for each period for all object accounts specified by AAI items defined by the financial account range dimension CA in the F80D021 table for ledger type specified in the processing options of the R80D0201 and R80D0202 programs.
-
Current liability amount: Sums the amount for each period for all object accounts specified by AAI items defined by the financial account range dimension CL in the F80D021 table respectively for ledger type specified in the processing options of the R80D0201 and R80D0202 programs.
The current asset and current liability period amounts must be represented as cumulative amounts; therefore, the system adds the value of the beginning balance to the amount of the first period. For each subsequent period, the system adds the balance from the previous period.
-
Current Ratio: Divides the current asset amount for each period by business unit by the current liability amount for each period by business unit.
(Current Ratio = Current asset amount ÷ Current liability amount)
The system presents the Current Ratio metric in a combo bar chart that shows the ratio number (Y axis) for the date that the system calculated the metric (X axis):
Month is the default value for the date range value. You can also review the chart by quarter or year date ranges. The system displays the values for all previous Current Ratio calculations in the chart. If a Current Ratio calculation is zero, the system displays a zero value bar for the date. If no calculation was performed for a period, the system does not display a bar.
You can define tolerance limits for the Current Ratio value. The tolerance limits are numerical values that represent an upper and lower limit for the current ratio. If the metric exceeds the limits, the system considers the limit breached. The system displays the limit values as diamond markers for each bar on the chart.
4.6.17 Analyzing Quick Acid Test
Access the appropriate metric group on the Fin Mgmt & Compliance Console form.
The system performs these calculations for the Quick Acid Test metric:
-
Current asset amount: Sums the amount for each period for all object accounts specified by AAI items defined by the financial account range dimension CA in the F80D021 table for ledger type specified in the processing options of the R80D0201 and R80D0202 programs.
-
Inventory amount: Sums the amount for each period for all object accounts specified by AAI items defined by the financial account range dimension IV in the F80D021 table for ledger type specified in the processing options of the R80D0201 and R80D0202 programs.
-
Current liability amount: Sums the amount for each period for all object accounts specified by AAI items defined by the financial account range dimension CL in the F80D021 table for ledger type specified in the processing options of the R80D0201 and R80D0202 programs.
The current asset, inventory, and current liability period amounts must be represented as cumulative amounts; therefore, the system adds the value of the beginning balance to the amount of the first period. For each subsequent period, the system adds the balance from the previous period.
-
Current Ratio: Divides the current asset amount minus the inventory amount for each period by business unit by the current liability amount for each period by business unit.
(Quick Acid Test = (Current asset amount – Inventory amount) ÷ Current liability)
The system presents the Quick Acid Test Ratio metric in a combo bar chart that shows the ratio number (Y axis) for the date that the system calculated the metric (X axis):
Month is the default value for the date range value. You can also review the chart by quarter or year date ranges. The system displays the values for all previous Quick Acid Test ratios in the chart. If a Quick Acid Test ratio calculation is zero, the system displays a zero value bar for the date. If no calculation was performed for a period, the system does not display a bar.
You can define tolerance limits for the Quick Acid Test Ratio value. The tolerance limits are numerical values that represent an upper and lower limit for the Quick Acid Test ratio. If the metric exceeds the limits, the system considers the limit breached. The system displays the limit values as diamond markers for each bar on the chart.
4.6.18 Analyzing Actual Versus Planned Operating Income, Expense, and Profit
Access the appropriate metric group on the Fin Mgmt & Compliance Console form.
The system performs these calculations to derive the actual versus planned metrics:
-
Actual operating income: Sums the amount for each period for the ledger type specified in the processing options of the R80D0201 and R80D0202 programs for all object accounts specified by AAI items defined by the financial account range dimension SA in the F80D021 table.
-
Planned operating income: Sums the amount for each period for the ledger type specified in the processing options of the R80D0201 and R80D0202 programs for all object accounts specified by AAI items defined by the financial account range dimension SA in the F80D021 table.
-
Actual operating expense: Sums the amount for each period for the ledger type specified in the processing options of the R80D0201 and R80D0202 programs for all object accounts specified by AAI items defined by the financial account range dimension OE in the F80D021 table.
-
Planned operating expense: Sums the amount for each period for the ledger type specified in the processing options of the R80D0201 and R80D0202 programs for all object accounts specified by AAI items defined by the financial account range dimension OE in the F80D021 table.
-
Actual operating profit: Subtracts the amount for each period for the specified ledger type for all object amounts specified by AAI items defined by the financial account range dimension OE from object accounts specified by AAI items defined by the financial account range dimension SA in the F80D021 table. respectively.
-
Planned operating profit: Subtracts the amount for each period for the specified ledger type for all object amounts specified by AAI items defined by the financial account range dimension OE from object accounts specified by AAI items defined by the financial account range dimension SA in the F80D021 table. respectively.
The system presents the Actual Versus Planned Operating Income, Expense, and Profit metrics in three different combo bar charts that depict both the planned and actual amounts (Y axis) for the date that the system calculated the metric (X axis):
Figure 4-31 Operating Vs Planned Income chart
Description of "Figure 4-31 Operating Vs Planned Income chart"
Figure 4-32 Operating Vs Planned Expense chart
Description of "Figure 4-32 Operating Vs Planned Expense chart"
Figure 4-33 Operating Vs Planned Profit chart
Description of "Figure 4-33 Operating Vs Planned Profit chart"
Month is the default value for the date range value. You can also review the charts by quarter or year date ranges. The system displays the values for all previous Actual Versus Planned Operating Income, Expense, and Profit amounts in the charts. If an Actual Versus Planned Operating Income, Expense, and Profit amount calculation is zero, the system displays a zero value bar for the date. If no calculation was performed for a period, the system does not display a bar.
You can define tolerance limits for the actual operating profit value. The tolerance limits are numerical values that represent an upper and lower limit for the operating profit amount. If the metric exceeds the limits, the system considers the limit breached. The system displays the limit values as diamond markers for each bar on the chart.
4.6.19 Analyzing Profit Margin on Sales
Access the appropriate metric group on the Fin Mgmt & Compliance Console form.
The Profit Margin on Sales metric measures exactly how much of sales a company keeps for itself as earnings. A high Profit Margin on Sales percentage indicates that a company is earning a good return over the cost of merchandise sold. The metric indicates the portion of sales that contribute to the income of a company. The system presents the Profit Margin on Sales as a percentage.
The system performs these calculations to derive the Profit Margin on Sales metric:
-
Net profit after tax amount: Sums the amount for each period for all object accounts in the range specified by AAI items F15 through F28 by business unit for ledger type specified in the processing options of the R80D0201 and R80D0202 programs.
-
Tax amount: Sums the amount for each period for all object accounts in the range specified by AAI items F26 through F27 by business unit for ledger type specified in the processing options of the R80D0201 and R80D0202 programs.
-
Net profit before tax amount: Sums the amount for each period for all object accounts specified by AAI items defined by the financial account range dimension TX and subtracts it from the sum of object accounts specified by financial account range dimension IN from the F80D021 table.
-
Sales amount: Sums the amount for each period for all object accounts in the range specified by AAI items F15 through F16 by business unit for ledger type specified in the processing options of the R80D0201 and R80D0202 programs.
-
Profit Margin on Sales: Divides the net profit before tax amount for each period by business unit by the sales amount for each period by business unit and then multiplies the result by 100.
(Profit Margin on Sales = (Net profit before tax amount ÷ Sales amount) à 100)
The system presents this metric in a combo bar chart that shows the percentage number (Y axis) for the date that the system calculated the metric (X axis):
Month is the default value for the date range. You can also review the chart by quarter or year date ranges. The system displays the values for all previous Profit Margin on Sales percentages in the chart. If a Profit Margin on Sales calculation is zero, the system displays a zero value bar for the date. If no calculation was performed for a period, the system does not display a bar.
You can define tolerance limits for the Profit Margin on Sales percentage value. The limits are numerical values that represent desired upper and lower values for the metric. The system displays the tolerance limits on the chart as diamond markers for each bar on the chart.
4.6.20 Analyzing After Tax Profit on Sales
Access the appropriate metric group on the Fin Mgmt & Compliance Console form.
The system performs these calculations to derive the After Tax Profit on Sales metric:
-
Net profit after tax amount: Sums the amount for each period for all object accounts specified by AAI items defined by the financial account range dimension IN in the F80D021 table by business unit for ledger type specified in the processing options of the R80D0201 and R80D0202 programs.
-
Sales amount: Sums the amount for each period for all object accounts specified by AAI items defined by the financial account range dimension SA in the F80D021 table by business unit for ledger type specified in the processing options of the R80D0201 and R80D0202 programs
-
After Tax Profit on Sales: Divides the net profit after tax amount for each period by business unit by the sales amount for each period by business unit and then multiplies the result by 100.
(After Tax Profit on Sales = (Net profit after taxes ÷ Sales amount) à 100)
The system presents the After Tax Profit on Sales metric in a combo bar chart that shows the ratio number (Y axis) for the date that the system calculated the metric (X axis):
Figure 4-35 After Tax Profit On Sales chart
Description of "Figure 4-35 After Tax Profit On Sales chart"
Month is the default value for the date range value. You can also review the chart by quarter or year date ranges. The system displays the values for all previous After Tax Profit on Sales percentage in the chart. If an After Tax Profit on Sales calculation is zero, the system displays a zero value bar for the date. If no calculation was performed for a period, the system does not display a bar.
You can define tolerance limits for the After Tax Profit on Sales percentage value. The tolerance limits are numerical values that represent an upper and lower limit for the metric. If the metric exceeds the limits, the system considers the limit breached. The system displays the limit values as diamond markers for each bar on the chart.
4.6.21 Analyzing Return on Net Worth
Access the appropriates metric group on the Fin Mgmt & Compliance Console form.
The system performs these calculations to derive the Return on Net Worth metric:
-
Net profit after tax amount: Sums the amount for each period for all object accounts specified by AAI items defined by the financial account range dimension TX and subtracts it from the sum of object accounts specified by financial account range dimension IN from the F80D021 table for ledger type specified in the processing options of the R80D0201 and R80D0202 programs.
-
Tax amount: Sums the amount for each period for all object accounts in the range specified by AAI items F26 through F27 by business unit for ledger type specified in the processing options of the R80D0201 and R80D0202 programs.
-
Net profit before tax amount: Subtracts the tax amount from the net profit after tax amount.
(Net profit after tax – Tax)
-
Net worth amount: Sums the amount for each period for all object accounts specified by AAI items defined by the financial account range dimension NW in the F80D021 table for ledger type specified in the processing options of the R80D0201 and R80D0202 programs.
The net worth period amounts must be represented as cumulative amounts; therefore, the system adds the value of the beginning balance to the amount of the first period. For each subsequent period, the system adds the balance from the previous period.
-
Return on Net Worth: Divides the net profit before tax amount for each period by business unit by the net worth amount for each period by business unit and then multiplying the result by 100.
(Return on Net Worth = (Net profit before tax amount ÷ Net worth amount) à 100)
The system presents the Return on Net Worth metric in a combo bar chart that shows the ratio number (Y axis) for the date that the system calculated the metric (X axis):
Month is the default value for the date range value, you can also review the chart by quarter or year date ranges. The system displays the values for all previous Return on Net Worth percentage in the chart. If a Return on Net Worth calculation is zero, the system displays a zero value bar for the date. If no calculation was performed for a period, the system does not display a bar.
You can define tolerance limits for the Return on Net Worth percentage value. The tolerance limits are numerical values that represent an upper and lower limit for the metric. If the metric exceeds the limits, the system considers the limit breached. The system displays the limit values as diamond markers for each bar on the chart.
4.6.22 Analyzing Return on Total Assets
Access the appropriate metric group on the Fin Mgmt & Compliance Console form.
The system performs these calculations to derive the Return on Total Assets metric:
-
Net profit after tax amount: Sums the amount for each period for all object accounts in the range specified by AAI items F15 through F28 by business unit for ledger type specified in the processing options of the R80D0201 and R80D0202 programs.
-
Tax amount: Sums the amount for each period for all object accounts in the range specified by AAI items F26 through F27 by business unit for ledger type specified in the processing options of the R80D0201 and R80D0202 programs.
-
Net profit before tax amount: Subtracts the tax amount from the net profit after tax amount.
(Net profit after tax – Tax)
-
Total asset amount: Sums the beginning balance amount and the cumulative amount for each period for all object accounts in the range specified by AAI items F01 through F09 by business unit for ledger type specified in the processing options of the R80D0201 and R80D0202 programs.
The total asset period amounts must be represented as cumulative amounts; therefore, the system adds the value of the beginning balance to the amount of the first period. For each subsequent period, the system adds the balance from the previous period.
-
Return on Total Asset: Divides the net profit before tax amount for each period by business unit by the total asset amount for each period by business unit and then multiplies the result by 100.
(Return on Total Assets = (Net profit before tax amount ÷ Total asset amount) à 100)
The system presents the Return on Total Assets metric in a combo bar chart that shows the ratio number (Y axis) for the date that the system calculated the metric (X axis):
Month is the default value for the date range value. You can also review the chart by quarter or year date ranges. The system displays the values for all previous Return on Total Assets percentage in the chart. If a Return on Total Assets calculation is zero, the system displays a zero value bar for the date. If no calculation was performed for a period, the system does not display a bar.
You can define tolerance limits for the Return on Total Assets percentage value. The tolerance limits are numerical values that represent an upper and lower limit for the metric. If the metric exceeds the limits, the system considers the limit breached. The system displays the limit values as diamond markers for each bar on the chart.
4.7 Managing Profitability Management
This section provides overviews of profitability management and period balances, lists prerequisites, and discusses how to:
-
Set processing options for the ACA Most Profitable Brands Data Load program (R80D274).
-
Run the ACA Most Profitable Brands Data Load program.
-
Analyze most profitable brands.
-
Set processing options for the ACA Most Profitable Customers Data Load program (R80D272).
-
Run the ACA Most Profitable Customers Data Load program.
-
Analyze most profitable customers.
-
Set processing options for the ACA Most Profitable Products Data Load program (R80D273).
-
Run the ACA Most Profitable Products Data Load program.
-
Analyze most profitable products.
4.7.1 Understanding Profitability Management
To manage profitability factors such as direct and indirect expenses associated with brands and products, a company needs to understand the brands, products, and customers that are the most profitable.
The ability to measure profitability at the individual customer level enables companies to consider new customer profitability metrics such as percentage of unprofitable customers or dollars lost in unprofitable customer relationships. Such customer profitability measures provide a valuable signal that satisfaction, retention, and growth in customer relationships are desirable only if the relationships contribute to higher profits.
These Profitability with ACA metrics help in determining the overall financial health of the company and how well the capital of the company is managed:
| Metric | Description |
|---|---|
| Most Profitable Brands | Illustrates the brands with the highest balances. |
| Most Profitable Customers | Illustrates the customers with the highest balances. |
| Most Profitable Products | Illustrates the products with the highest balances. |
4.7.2 Understanding Period Balances
The JD Edwards EnterpriseOne Advanced Cost Accounting (ACA) system updates the Cost Analyzer Balances table (F1602) based on the summarization rules that are established for each cost analyzer view. The update is similar to how the system assigns fiscal date patterns to a company to direct posting amounts to specific period fields in the F0902 table. A fiscal date pattern is assigned to each view to direct posting amounts to specific period fields in the F1602 table.
Fiscal date patterns, which are stored in the Date Fiscal Patterns table (F0008), associate period-end dates with the net posting fields (AN01 through AN14) and net balance fields (NB01 through NB14) in the F1602 table. Because you can assign each view a different fiscal date pattern, the amounts can be posted to different net posting and net balance fields for the same date. The fiscal year is the year in which the ending date of the first period occurs. If period 01 ends on December 31, the system assigns records posted between December 01 and November 30 of the next year to the fiscal year. For each transaction that the system posts, it retrieves the fiscal date pattern code from the Cost Analyzer View Structure table (F1603) and then determines the fiscal period for the transaction based on the period-end dates defined for the code in the F0008 table.
This example shows the period fields that the system updates in the F1602 table based on the fiscal date pattern assigned to the view and the general ledger date of the posted transaction.
Assume two transactions are posted:
-
Transaction A: General ledger date = May 31, Amount = 500 USD.
-
Transaction B: General ledger date = June 15, Amount = 300 USD.
Assume that the fiscal date patterns are assigned to the companies, which represent periods 01 through 12:
-
View 1 = F (June 01 through May 31).
-
View 2 = J (April 01 through March 31).
-
View 3 = R (January 01 through December 31).
| View | Fiscal Date Pattern | Period 01 | Period 02 | Period 03 | Period 04 | Period 05 | Period 06 | Period 07 | Period 08 | Period 09 | Period 10 | Period 11 | Period 12 |
|---|---|---|---|---|---|---|---|---|---|---|---|---|---|
| 1 | F | N/A | N/A | N/A | N/A | N/A | N/A | N/A | N/A | N/A | N/A | N/A | 500 |
| 1 | F | 300 | N/A | N/A | N/A | N/A | N/A | N/A | N/A | N/A | N/A | N/A | N/A |
| 2 | J | N/A | 500 | 300 | N/A | N/A | N/A | N/A | N/A | N/A | N/A | N/A | N/A |
| 3 | R | N/A | N/A | N/A | N/A | 500 | 300 | N/A | N/A | N/A | N/A | N/A | N/A |
4.7.3 Prerequisites
You must use the JD Edwards EnterpriseOne Advanced Cost Accounting system to be able to analyze the profitability management metrics. Complete these steps before analyzing profitability management:
-
Define the flexible accounting rules for the appropriate cost objects.
-
Activate the flexible accounting processing options in the Sales Update program (R42800).
-
Verify that the view does not have summarization activated for the cost object that is updated.
For example, if cost object 1 is defined for the customer, then the view should not summarize cost object 1.
-
Specify the value in the Metric Category Code 2 field on the Dashboard Management program (P80D301) with the number of brands, products, and customers that the system displays on the console.
You must also specify the value in the Metric Category Code 3 field that represents the category code from the sales order that you use for the brand, SRP1 through SRP5.
-
Run the Cost Analyzer Balances program (R1602).
The balances that the system retrieves are accurate as of the last time you ran the R1602 program.
4.7.4 Setting Processing Options for the ACA Most Profitable Brands Data Load Program (R80D274)
Processing options enable you to specify the default processing for the Most Profitable Brands Data Load program.
4.7.4.1 Defaults
These processing options control the records that the system uses to populate the Most Profitable Brand Aggregate table (F80D274).
- 1. View Number
-
Enter the view number that the system uses to pull records from the Cost Analyzer Balances table (F1602). The system processes only the records with a view number equal to the number that you enter in this processing option.
- 2. Ledger Types
-
Enter the ledger types that the system uses to pull records from the F1602 table. The system processes only the records with a ledger type equal to the number that you enter in this processing option.
If you leave this processing option blank, the system uses ledger type AA.
- 3. Cost Object Type Field
-
Enter the cost object type that the system uses to process the column from ABR1, ABR2, ABR3, or ABR4.
- 4. Cost Object Type
-
Enter the cost object value that the system processes from the F1602 table, for example, ABT1, ABT2, ABT3, or ABT4 in the Cost Object Type Field processing option.
4.7.4.2 Display
This processing option controls the print output.
- 1. Level of Detail to Print
-
Specify whether the system prints a detailed report or errors only. Values are:
-
Blank: The system prints errors only.
-
1: The system prints a detailed report of the processed records and any errors generated.
-
4.7.5 Running the ACA Most Profitable Brands Data Load Program
Enter BV in the Fast Path field, and then enter R80D274 in the Batch Application field.
The Most Profitable Brands Data Load program (R80D274) calculates the Most Profitable Brands metric. The system retrieves transactions from the Cost Analyzer Balances table (F1602) based on these criteria:
-
Cost Object Type field (ABT1, ABT2, ABT3, ABT4) is equal to the value specified in the processing options of the R80D274 program.
-
Ledger Type (LT) value that is set in the data selection of the R80D274 program.
-
View Number (VWNM).
The system also retrieves transactions from the Cost Analyzer View Structure table (F1603) based on the view number.
The system sums all of the records retrieved from the F1602 table for each unique brand and determines which brands have the highest balance for each company by period balance and multiplies the amount by negative 1 to derive the Most Profitable Brands metric (Most Profitable Brands = Sum of the net balances for each period à –1).
The system stores the Most Profitable Brands values in the F80D274 table. The Most Profitable Brands metric is accurate as of the last date that you ran the R80D274 program.
|
Note: If you change the data store currency, modify the business units associated with accounts, or update the company associated with the business unit, you must run a full load of data to the F80D274 table. |
4.7.6 Analyzing Most Profitable Brands
Access the appropriate metric group on the Fin Mgmt & Compliance Console form.
The system presents the Most Profitable Brands metric in a bar chart that shows the amount (Y axis) for the top number of brands (X axis):
The system displays a bar for the number of brands that you specified in the Metric Definition table (F80D303). The Metric Category Code 3 field in the P80D301 program specifies the category code from the sales order that the system uses to label each bar on the chart.
4.7.7 Setting Processing Options for the ACA Most Profitable Customers Data Load Program (R80D272)
Processing options enable you to specify the default processing for the Most Profitable Customers Data Load program.
4.7.7.1 Defaults
These processing options control the records that the system uses to populate the Most Profitable Customers Aggregate table (F80D272).
- 1. View Number
-
Enter the view number that the system uses to pull records from the F1602 table. The system processes only the records with a view number equal to the number that you enter in this processing option.
- 2. Ledger Types
-
Enter the ledger types that the system uses to pull records from the F1602 table. The system processes only the records with a ledger type equal to the number that you enter in this processing option.
If you leave this processing option blank, the system uses ledger type AA.
- 3. Cost Object Type Field
-
Enter the cost object type that the system uses to process the column from ABR1, ABR2, ABR3, or ABR4.
- 4. Cost Object Type Value
-
Enter the cost object value that the system processes from the F1602 table, for example, ABT1, ABT2, ABT3, or ABT4 in the Cost Object Type Field processing option.
4.7.7.2 Display
This processing option controls the print output.
- 1. Level of Detail to Print
-
Specify whether the system prints a detailed report or errors only. Values are:
-
Blank: The system prints errors only.
-
1: The system prints a detailed report of the processed records and any errors generated.
-
4.7.8 Running the ACA Most Profitable Customers Data Load Program
Enter BV in the Fast Path field, and then enter R80D272 in the Batch Application field.
The ACA Most Profitable Customers Data Load program (R80D272) calculates the Most Profitable Customers metric.
The system retrieves transactions from the F1602 table based on these criteria:
-
Cost Object Type field (ABT1, ABT2, ABT3, ABT4) is equal to the value specified in the processing options of the R80D274 program.
-
Ledger Type (LT) value that is set in the data selection of the R80D272 program.
-
View Number (VWNM).
The system also retrieves transactions from the F1603 table based on the view number.
The system sums all of the records retrieved from the F1602 table for each unique customer and determines which customers have the highest balance for each company by period balance and multiplies the amount by negative 1 to derive the Most Profitable Customers metric (Most Profitable Customers = Sum of the net balances for each period à – 1).
The system stores the Most Profitable Customers values in the Most Profitable Customers Aggregate table (F80D272). The Most Profitable Customers metric is accurate as of the last date that you ran the R80D272 program.
|
Note: If you change the data store currency, modify the business units associated with accounts, or update the company associated with the business unit, then you must run a full load of data to the F80D272 table. |
4.7.9 Analyzing Most Profitable Customers
Access the appropriate metric group on the Fin Mgmt & Compliance Console form.
The system presents the Most Profitable Customers metric in a bar chart that shows the amount (Y axis) for the top number of customers (X axis):
Figure 4-39 Most Profitable Customers chart
Description of "Figure 4-39 Most Profitable Customers chart"
The system displays a bar for the number of customers that you specified in the F80D303 table.
4.7.10 Setting Processing Options for the ACA Most Profitable Products Data Load Program (R80D273)
Processing options enable you to specify the default processing for the Most Profitable Products Data Load program.
4.7.10.1 Defaults
These processing options control the records that the system uses to populate the Most Profitable Products Aggregate table (F80D273).
- 1. View Number
-
Enter the view number that the system uses to pull records from the F1602 table. The system processes only the records with a view number equal to the number that you enter in this processing option.
- 2. Ledger Type
-
Enter the ledger types that the system uses to pull records from the F1602 table. The system processes only the records with a ledger type equal to the number that you enter in this processing option.
If you leave this processing option blank, the system uses ledger type AA.
4.7.10.2 Display
This processing option controls the print output.
- 1. Level of Detail to Print
-
Specify whether the system prints a detailed report or errors only. Values are:
-
Blank: The system prints errors only.
-
1: The system prints a detailed report of the processed records and any errors generated.
-
4.7.11 Running the ACA Most Profitable Products Data Load Program
Enter BV in the Fast Path field, and then enter R80D273 in the Batch Application field.
The ACA Most Profitable Products Data Load program (R80D273) calculates the Most Profitable Products metric.
The system retrieves transactions from the F1602 table based on these criteria:
-
Short Item Number (ITM) is not blank.
-
Ledger Type (LT) value that is set in the data selection of the R80D273 program.
-
View Number (VWNM).
The system also retrieves transactions from the F1603 table based on the view number.
The system sums all of the records retrieved from the F1602 table for each unique item number and determines which items have the highest balance for each company by period balance and multiplies the amount by negative 1 to derive the Most Profitable Products metric (Most Profitable Products = Sum of the net balances for each period à – 1).
The system stores the Most Profitable Products values in the Most Profitable Products Aggregate table (F80D273). The Most Profitable Products metric is accurate as of the last date that you ran the R80D273 program.
|
Note: If you change the data store currency, modify the business units associated with accounts, or update the company associated with the business unit, you must run a full load of data to the F80D273 table. |
4.7.12 Analyzing Most Profitable Products
Access the appropriate metric group on the Fin Mgmt & Compliance Console form.
The system presents the Most Profitable Products metric in a bar chart that shows the amount (Y axis) for the top number of products (X axis):
Figure 4-40 Most Profitable Products chart
Description of "Figure 4-40 Most Profitable Products chart"
The system displays a bar for the number of products that you specified in the F80D303 table.
4.8 Managing Revenue Trends
This section provides overviews of sales revenue and the prerequisite batch programs, lists prerequisites, and discusses how to:
-
Run the Shipped Orders Processing program (R80D241).
-
Analyze revenue by brand.
-
Analyze revenue by division.
-
Analyze revenue by product.
-
Set processing options for the Forecasted Cash Flow Data Load program (R80D203).
-
Run the Forecasted Cash Flow Data Load program.
-
Analyze forecasted cash flow.
4.8.1 Understanding Sales Revenue
To determine the most profitable areas of their business, companies need to track revenue trends by different groupings such as brand, division, and product. The JD Edwards EnterpriseOne FMCC Sales Revenue metrics provide information about revenue trends by brand, division, and product.
Sales, costs and, therefore, profits do not necessarily coincide with their associated cash inflows and outflows. While a sale may have been secured and goods delivered, the related payment may be deferred as a result of giving credit to the customer. At the same time, payments must be made to suppliers, employees, and so on, cash must be invested in rebuilding depleted stocks, and new equipment may have to be purchased. The net result is that cash receipts often lag cash payments and, while profits may be reported, the business may experience a short-term cash shortfall. For this reason, forecasting cash flow is essential.
These Revenue Management metrics help in determining the overall financial health of the company and how well the capital of the company is managed:
| Metric | Description |
|---|---|
| Revenue by Brand | Shows the total revenue by brand or by company, business unit, and brand based on the user-specified category code. |
| Revenue by Division | Shows the total revenue by business unit or by company and business unit. |
| Revenue by Product | Shows the total revenue by individual item or by company, business unit, and item. |
| Forecasted Cash Flow | Shows the forecasted cash positions based on the due dates of invoices and vouchers. The system calculates Forecasted Cash Flow as:
= Starting balance amount + Inflow amount – Outflow amount |
4.8.2 Understanding Prerequisite Batch Programs
The Revenue Management metrics use two batch programs from the JD Edwards EnterpriseOne Plant Manager's Dashboard. Reusing the Sales Order Fact Data Load (R80D010) and the Shipped Orders Processing (R80D241) programs enables you to efficiently generate the necessary data for the revenue metrics.
4.8.2.1 Sales Order Fact Data Load Program
The R80D010 program enables you to take data from the Sales Order Detail table (F4211) and Sales Detail History table (F42119) and populate the Sales Order Fact table (F80D010). The system uses the F80D010 table to hold the data for which various metrics in the consoles.
The console systems do not access the data directly from the sales order transaction tables. The system must evaluate data in the appropriate context in order to process metric calculations. The R80D010 program uses data selection and processing options to determine the records that the system creates in the F80D010 table. The R80D010 program determines the company corresponding to the revenue branch plant, and calculates the extended price for each sales order line. The program also converts the unit of measure to the primary and converts the currency to the default currency code that you specify in the Analytics Data Store Currency program (P80D300C). The system has specific logic for configured items and kits in all calculations so that records are not counted multiple times.
4.8.2.2 Shipped Orders Processing Program
The R80D241 program calculates the shipped revenue for a specific sales order by adding the extended sales value from each line on the sales order that has an actual ship date. The system calculates the shipped revenue for a specific date by adding the total shipped revenue for all sales orders shipped on that date and stores the value in the Shipped Order Value Aggregate table (F80D241).
4.8.3 Prerequisites
Before you evaluate the sales revenue metric information, you must:
-
Run the R80D010 and the R80D241 programs.
You must run the R80D010 program prior to the R80D241 program.
-
Specify the category code for the brand, SRP1 through SRP5, on the Metric tab of the Dashboard Management program (P80D301).
The system uses the category code to determine the brand to display on the Fin Mgmt & Compliance Console form.
4.8.4 Running the Shipped Orders Processing Program (R80D241)
Enter BV in the Fast Path field, and then enter R80D241 in the Batch Application field.
The Shipped Orders Processing program (R80D241) calculates the Revenue by Brand, Revenue by Division, and Revenue by Product metrics.
When you run full loads, the system retrieves transactions from the Sales Order History table (F42119) based on these criteria:
-
Ship Date (ADDJ) is not blank.
-
Category Code (SRP1 through SRP5) is not blank.
To generate the revenue by brand, you must designate one of the category codes on the item, SRP1 through SRP5, as a brand. These are the only category codes associated with an item that the system records in the Sales Order Detail File table (F4211).
You must run the program a second time with the Load Type processing option blank to retrieve records from the Sales Order Detail table (F4211). For incremental loads, the system does not purge records from the F4211 table when you run the Sales Update program (R42800). The system retrieved transactions from the F4211 table based on these criteria:
-
Ship Date (ADDJ) is not blank.
-
Category Code (SRP1 through SRP5) is not blank.
The system performs these calculations to derive the sales revenue metrics:
-
Revenue by Brand: Sums the extended price for each unique value of the category code designated in the processing options to represent brand for each ship date by business unit.
(Revenue by Brand = Sum of the amounts shipped for each unique category code)
-
Revenue by Division: Sums the extended price for each unique division for each ship date.
(Revenue by Division = Sum of the amounts shipped for each unique division)
-
Revenue by Product: Sums the extended price for each unique item for each ship date by business unit.
(Revenue by Product = Sum of the amounts shipped for each unique item)
|
Note: You must run the Sales Order Fact Data Load program (R80D010) before the Shipped Orders Processing program (R80D241). |
4.8.5 Analyzing Revenue by Brand
Access the appropriate metric group on the Fin Mgmt & Compliance Console form.
The system presents the Revenue by Brand metric in a bar chart that shows the revenue amount (Y axis) for the date that the system calculated the metric (X axis):
You can use two variants to review data for the Revenue by Brand metric:
-
Company, business unit, brand, and date.
-
Brand and date.
Day is the default value for the date range value for both variants. You can also review the chart by week, month, quarter, or year date ranges.
The system displays the values for all previous Revenue by Brand in the chart. If a Revenue by Brand calculation is zero, the system displays a zero value bar for the date. If no calculation was performed for a period, the system does not display a bar.
4.8.6 Analyzing Revenue by Division
Access the appropriate metric group on the Fin Mgmt & Compliance Console form.
The system presents the Revenue by Division metric in a bar chart that shows the revenue amount (Y axis) for the date that the system calculated the metric (X axis):
Figure 4-42 Revenue Trend by Division chart
Description of "Figure 4-42 Revenue Trend by Division chart"
You can use two variants to review data for the Revenue by Division metric:
-
Company, branch/plant, and date.
-
Branch/Plant and date.
Day is the default value for the date range value for both variants. You can also review the chart by week, month, quarter, or year date ranges.
The system displays the values for all previous Revenue by Division in the chart. If a Revenue by Division calculation is zero, the system displays a zero value bar for the date. If no calculation was performed for a period, the system does not display a bar.
4.8.7 Analyzing Revenue by Product
Access the appropriate metric group on the Fin Mgmt & Compliance Console form.
The system presents the Revenue by Product metric in a bar chart that shows the revenue amount (Y axis) for the date that the system calculated the metric (X axis):
Figure 4-43 Revenue Trend by Product chart
Description of "Figure 4-43 Revenue Trend by Product chart"
You can use two variants to review data for the Revenue by Product metric:
-
Company, branch/plant, and date.
-
Branch/plant and date.
Day is the default value for the date range value for both variants. You can also review the chart by week, month, quarter, or year date range.
The system displays the values for all previous Revenue by Product in the chart. If a Revenue by Product calculation is zero, the system displays a zero value bar for the date. If no calculation was performed for a period, the system does not display a bar.
4.8.8 Setting Processing Options for the Forecasted Cash Flow Data Load Program (R80D203)
Processing options enable you to specify the default processing for the Forecasted Cash Flow Data Load program (R80D203).
4.8.8.1 Display
This processing option controls the print output.
- 1. Level of Detail to Print
-
Specify whether the system prints a detailed report or errors only. Values are:
-
Blank: The system prints errors only.
-
1: The system prints a detailed report of the processed records and any errors generated.
-
4.8.9 Running the Forecasted Cash Flow Data Load Program
Enter BV in the Fast Path field, and then enter R80D203 in the Batch Application field.
The Forecasted Cash Flow Data Load program (R80D203) calculates the Forecasted Cash Flow metric.
The system retrieves transactions from the Cash Forecast Data table (F09522) based on these criteria:
-
Status of Refresh (RFSTAT) is blank.
The system does not consider records that have a value in the RTSTAT field, because the records are not finished processing.
-
Based on Date (BSDATE) is closest to the run date of the R80D203 program.
The system retrieves transactions from the Cash Types Rules table (F09521) based on these criteria:
-
Cash Type (CSHTYP) from the F09522 table is equal to the Cash Type from the F09521 table.
-
Weight Factor (WGHTNO).
The system also retrieves the business unit from the F09522 table and the company from the F0006 table based on the business unit in the Forecasted Cash Flow Aggregate table (F80D203). You must have a previously established forecast so that records exist in the F09522 table.
The system performs these calculations to derive the forecasted cash flow metric:
-
Weighted amounts: Sums each amount by cash type and currency code for the most current date and multiplies the result by the weight factor that the system retrieves from the F09521 table.
-
Starting balance amount: Sums all the weighted amounts for all cash types by currency code for source system 09.
-
Inflow amount: Sums all weighted amounts for all cash types for source system 03B by currency code for each unique due date that is equal to or greater than the value of the based on date.
-
Outflow amount: Sums all weighted amounts for all cash types for source system 04 by currency code for each unique due date that is equal to or greater than the value of the based on date.
-
Forecasted Cash Flow: Subtracts the outflow amount from the starting balance amount plus the inflow amount.
(Forecasted Cash Flow = (Starting balance + Inflow amount) − Outflow amount)
The integrity of the data is validated by the Setup Cash Forecast Reporting Structures program (P09523). If cash types are set up for the same system with overlapping accounts, the system can validate the information only when a reporting structure is set up that includes all cash types. The system does not perform any validation when the F09522 table is built and, therefore, when the metric is displayed.
The system stores the Forecasted Cash Flow values in the F80D203 table. The Forecasted Cash Flow metric is accurate as of the last date you ran the R80D203 program. The system does not store historical data for the Forecasted Cash Flow metric; therefore, no trend is displayed.
|
Note: You must run the Refresh Cash Forecast Data program (R00522) before the R80D203 program.If you change the data store currency, modify the business units associated with accounts, or update the company associated with the business unit, you must run a full load of data to the F80D203 table. |
4.8.9.1 Forecasted Cash Flow Example
This table shows the records in the F09521 and F09522 tables:
| Sequence Number | Based on Date | Cash Type | Due Date | Source System | Node Amount | Business Unit | Status | Weight Factor |
|---|---|---|---|---|---|---|---|---|
| 1 | March 14 | BANK | March 14 | 09 | 400 | 2000 | N/A | 1 |
| 2 | March 14 | BANK | March 16 | 09 | 200 | 2000 | N/A | 1 |
| 3 | March 14 | INVCK | March 16 | 03B | 1200 | 2000 | N/A | .25 |
| 4 | March 14 | INVCK | March 18 | 03B | 400 | 2000 | N/A | .25 |
| 5 | March 14 | VOUCK | March 15 | 04 | 400 | 2001 | N/A | .5 |
| 6 | March 14 | VOUCK | March 16 | 04 | 200 | 2001 | D | .5 |
| 7 | March 14 | VOUCK | March 18 | 04 | 600 | 2000 | N/A | .5 |
| 8 | March 14 | INVCK | February 01 | 03B | 100 | 2004 | N/A | .25 |
| 9 | March 10 | BANK | March 12 | 09 | 400 | 2004 | N/A | 1 |
If you run the R80D203 program on March 14, the system processes only records with the recent based on date and a blank status. Using this criteria, the system does not process:
-
Record 6 because it does not have a blank status.
-
Record 8 because the due date is prior to March 14.
-
Record 9 because the based on date is prior to March 14.
The system performs these calculations:
| Date | Starting Balance | Inflow | Outflow | Forecasted Amount |
|---|---|---|---|---|
| March 14 | 400 Ã 1 = 400 | 0 | 0 | 400 |
| March 15 | 400 | 0 | 400 Ã 0.5 = 200 | 200 |
| March 16 | 200 + (200 Ã 1) = 400 | 1200 Ã 0.25 = 300 | 0 | 700 |
| March 17 | 700 | 0 | 0 | 700 |
| March 18 | 700 | 4700 Ã 0.25 = 100 | 600 Ã 0.5 = 300 | 500 |
4.8.10 Analyzing Forecasted Cash Flow
Access the appropriate metric group on the Fin Mgmt & Compliance Console form.
The system presents the Forecasted Cash Flow metric in a combo bar chart that shows the amount (Y axis) for the cash forecast (X axis):
Day is the default value for the date range. The system displays the values for all previous Forecasted Cash Flow amounts in the chart. If a Forecasted Cash Flow amount calculation is zero, the system displays a zero value bar for the date. If no calculation was performed for a period, the system does not display a bar.
You can define goal values for the Forecasted Cash Flow metric. The goal values represent an upper and lower limit for the expected cash balance. If the metric exceeds the goal limits, the system considers the goal breached. The system displays the goal value as a diamond marker for each bar on the chart.
4.9 Managing Unposted Transactions
This section provides an overview of unposted transactions and discusses how to:
-
Set processing options for the Unposted Transaction Data Load program (R80D701).
-
Run the Unposted Transaction Data Load program (R80D701).
-
Analyze unposted transactions.
4.9.1 Understanding Unposted Transactions
To accurately determine actual income and expense amounts, and ultimately the profitability of the company, financial managers need to know the income and expense amounts that are unposted. Unposted transactions are not reflected in the account balances.
Managers use the unposted information in addition to the Forecasted Cash Flow metric to determine the cash position of the company or business unit.
These unposted transactions metrics help in determining the overall financial health of the company and how well the capital of the company is managed:
| Metric | Description |
|---|---|
| Total Unposted Income | Shows the gross amount of all invoices retrieved by general ledger date. |
| Total Unposted Expense | Shows the gross amount of all vouchers retrieved by general ledger date. |
4.9.2 Setting Processing Options for the Unposted Transaction Data Load Program (R80D701)
Processing options enable you to specify the default processing for the Unposted Transaction Data Load program.
4.9.2.1 Display
This processing option controls the print output.
- 1. Level of Details to Print
-
Specify whether the system prints a detailed report or errors only. Values are:
-
Blank: The system prints errors only.
-
1: The system prints a detailed report of the processed records and any errors generated.
-
4.9.3 Running the Unposted Transaction Data Load Program
Enter BV in the Fast Path field, and then enter R80D701 in the Batch Application field.
The Unposted Transaction Data Load program (R80D701) calculates the Unposted Income and Unposted Expense metrics.
The system retrieves transactions from the Customer Ledger table (F03B11) based on these criteria:
-
Posted Code (POST) is blank.
-
Batch Type (ICUT) is equal to IB or 2B.
The system retrieves transactions from the Accounts Payable Ledger table (F0411) based on these criteria:
-
Posted Code (POST) is blank.
-
Batch Type (ICUT) is equal to V, W, /, or #.
The system also retrieves the business unit from the F03B11 table and the company from the F0006 table based on the business unit in the Unposted Transaction Aggregate table (F80D701).
The system performs these calculations to derive the unposted transaction metrics:
-
Unposted Income: Sums the gross amount of all invoices retrieved from the F03B11 table by general ledger date.
(Total unposted invoiced amount = sum of gross amounts)
-
Unposted Expense: Sums the gross amount of all vouchers retrieved from the F0411 table by general ledger date.
(Total unposted vouchered amount = sum of gross amounts)
The system stores the unposted income and unposted expense values in the F80D701 table. The system records data to the F80D701 table only when the R80D701 program runs successfully. If any errors appear on the report, the system does not create any records in the F80D701 table. The unposted transactions metrics are accurate as of the last date that you ran the R80D701 program.
|
Note: The system does not use data selection criteria for the R80D701 program. The system processes all data from the source tables regardless of the values you enter in the data selection categories. |
4.9.3.1 Unposted Income Example
This table shows the data in the F03B11 table:
| SI Number | Posted Code | Business Unit | Batch Type | Gross Amount | Receipt GL Date |
|---|---|---|---|---|---|
| 101 | N/A | 1 | IB | 100 | April 10 |
| 102 | N/A | 1 | 2B | 150 | April 10 |
| 103 | D | 1 | 2B | 150 | April 10 |
| 104 | D | 1 | 2B | 150 | April 10 |
| 105 | N/A | 1 | 2B | 200 | April 10 |
Using the data in the previous table, if you run the R80D701 program on April 11, the system processes only records with a blank posted code and batch type of either IB or 2B. The system sums the gross amounts from numbers 101, 102, and 105 to determine the total unposted income amount (100 + 150 + 200) = 450.
4.9.3.2 Unposted Expense Example
For example, this data is in the F0411 table:
| SI Number | Posted Code | Business Unit | Batch Type | Gross Amount | Receipt GL Date |
|---|---|---|---|---|---|
| 101 | N/A | 1 | V | 100 | April 10 |
| 102 | D | 1 | # | 100 | April 10 |
| 103 | N/A | 1 | W | 150 | April 10 |
| 104 | N/A | 1 | / | 100 | April 10 |
| 105 | D | 1 | / | 100 | April 10 |
| 106 | N/A | 1 | / | 100 | April 10 |
Using the data in the previous table, if you run the R80D701 program on April 11, the system processes only records with a blank posted code and batch type of V, W, /, or #. The system sums the gross amounts from numbers 101, 103, 104, and 106 to determine the total unposted expense amount (100 + 150 + 100 + 100) = 450.
4.9.4 Analyzing Unposted Transactions
Access the appropriate metric group on the Fin Mgmt & Compliance Console form.
The system presents the Unposted Income and Unposted Expense metrics in a cluster bar chart that shows the amount (Y axis) for the date that the system calculated the metric (X axis):
Day is the default value for the date range; you can specify the date range in the search fields. The system displays the values for all previous Unposted Income and Unposted Expense amounts in the chart. If an Unposted Income or Unposted Expense calculation is zero, the system displays a zero value bar for the period. If no calculation was performed for a period, the system does not display a bar.