9 One View Reporting for Sales Order Management
This chapter provides overview information, processing options, special processing, and reports for the following applications:
9.1 One View Open Sales Inquiry (P42270)
Access the One View Open Sales Inquiry application (P42270) on the Sales Order Inquiries (G42112) menu. Use One View Open Sales Inquiry to query open sales orders and create sales order reports including related data from the Item Branch and Customer Master Line of Business. One View Open Sales Inquiry uses the One View Open Sales Inquiry business view (V42270A), which include columns from the Sales Order Detail table (F4211), Item Master table (F4102), and Customer Master by Line of Business table (F03012). It also uses V42270B to fetch information from the Sales Order Header (F4201).
This application provides the ability to create and run reports on current sales orders including customer and item information, such as: open sales orders by customer, status of open orders, today's shipments by item, open sales orders by item, commitments by item, and current backorders by branch. Additional reporting is possible through customer and item category codes to allow reporting, for example, by sales catalog code or customer region.
9.1.1 Processing Options
Processing options enable you to specify the default processing for programs and reports.
9.1.1.1 Defaults
- 1. Branch Plant - Detail
-
Specify the branch/plant that you want the system to use as the default value for filtering sales order detail lines.
- 2. Order Company (Order Number)
-
Specify the order company that you want the system to use as the default value for filtering sales order detail lines.
- 3. Order Type
-
Specify the document type that you want the system to use as the default value for filtering sales order detail lines.
- 4. Status Code - Next From
-
Specify a default value for the Next Status From that you want the system to use for filtering sales order lines.
If you leave this processing option blank, the system does not use the Next Status From Value for filtering the display of sales order lines.
- 5. Status Code - Next Thru
-
Specify a default value for the Next Status Thru that you want the system to use for filtering sales order lines.
If you leave this processing option blank, the system does not use the Next Status Thru Value for filtering the display of sales order lines.
- 6. As If Currency Code
-
Specify the default value for the Currency Code that the system uses when calculating as if currency amounts.
9.1.1.2 Process
- 1. Perform Primary UOM Quantity Conversions
-
Specify whether to bypass the processing of order quantities to the primary unit of measure. If this processing option is set to '1', the primary unit of measure process will be bypassed.
- 2. Perform As If Currency Conversions
-
Specify whether to bypass the processing of order amounts to the as if currency. If this processing option is set to '1', as if currency process will be bypassed.
9.1.1.3 Versions
- 1. One View Historical Sales Inquiry (P42271)
-
Specify the version of One View Historical Sales Inquiry (P42271) the system uses to access the historical sales inquiry application.
If you leave this processing option blank, the system uses version ZJDE0001.
- 2. One View Sales To Date Inquiry (P42272)
-
Specify the version of One View Sales To Date Inquiry (P42272) the system uses to access the sales to date inquiry application.
If you leave this processing option blank, the system uses version ZJDE0001.
- 3. One View Sales Price Inquiry (P42273)
-
Specify the version of One View Sales Price Inquiry (P42273) the system uses to access the sales price inquiry application.
If you leave this processing option blank, the system uses version ZJDE0001.
9.1.2 Special Processing
One View Open Sales Inquiry converts all quantity-related grid columns to the primary unit of measure (UOM). However, you can set the processing option to bypass primary UOM processing if you are not using quantity fields in your reports.
The system requires values in the Company or Branch Plant fields. The system uses the values to build data selection to the Customer Master by Line of Business. If the Branch Plant is used as a filter, then the system retrieves the associated Company for the Branch Plant. The filter for Company takes precedence over any Branch Plant filtering.
9.1.2.1 Currency
Currency-related amounts are shown in the common currency that is entered in the processing option, the domestic currency, and any foreign currencies. The system displays the values for the currency code that is entered. This includes:
-
As If Currency Code
-
As If Unit Price
-
As If Extended Price
-
As If Unit Cost
-
As If Extended Cost
-
Accumulated Amount Invoiced (As If)
If Currency Processing is turned off in the processing options, the system does not display the fields in the grid and hides the As If Currency field on the header.
9.1.2.2 Unit Price Calculation
To calculate the Unit Price in Primary and the Unit Cost in Primary, the system uses the As If Currency Code and the Primary UOM. If you do not set the Primary UOM and Currency Code processing options, the system does not display the fields in the grid. If you set one of the processing options, the system uses a ratio of "1" to compute the missing information (for example, if you are only converting to primary, the system uses a currency ratio of 1.00).
9.1.2.3 Profit Calculations
The profit calculations use the As If amounts to compute the profit margin amount and percentage. If you do not use the As If amounts, the system uses the domestic amounts. Profit calculations also include the profit amount used to compute the%. This amount can be summed across order lines to give an aggregate profit amount.
9.1.3 Reports
The reports delivered with the One View Open Sales Inquiry application are:
-
Open Items Report
-
Open Customer Report
-
Status Report
-
Commitment Report
-
Open Sales Analysis
9.1.3.1 Open Items Report
The Open Item Report enables you to view the open sales order detail records based on item information. The Open Items by Item Number and Branch Plant cluster bar chart enables you to compare the sales for items across different branches. The Open Items by Sub Section pie chart enables you to view the percentage of sales by the sub section category code. You could use another category code associated with the item record.The Items Summary by Sub Section and Item table shows the total values for the items and sub sections that are used in the charts. The Open Items Detail table displays all the sales order detail records that were used to create the charts sequenced by Branch Plant and Sub Section. The table displays subtotals for each item and for each Sub Section.
This report contains the following components:
-
Open Items by Item Number and Branch Plant (bar graph)
-
Open Items by Sub Section (pie chart)
-
Items Summary by Sub Section and Item (table)
-
Open Items Detail Table (table)
The Open Items Detail table component contains drill back functionality as described in the following table:
| Functionality | Value |
|---|---|
| Table column containing drill back link | Item Number |
| Table columns passed to application | Item Number |
| Application called | Sales Order Entry (P42101) |
| Form called | W42101C |
| Version called | ZJDE0001 |
9.1.3.2 Open Customer Report
The Open Customer Report enables you to view open sales order detail records based on customer information. The Open Items by Customer cluster bar chart enables you to compare the sales for items to different customers. The Open Orders by Customer pie chart enables you to view the percentage of sales by customer. The Open Orders Summary by Customer and Item table shows the total values for the items and customers that are used in the charts. The Open Orders by Customer Detail table displays all the sales order detail records that were used to create the charts sequenced by customer. The table displays subtotals for each sales order and for each customer.
This report contains the following components:
-
Open Items by Customer (horizontal bar graph)
-
Open Orders by Customer (pie chart)
-
Open Orders Summary by Customer and Item (table)
-
Open Orders by Customer Detail Table (table)
The Open Orders by Customer Detail table component contains drill back functionality as described in the following table:
| Functionality | Value |
|---|---|
| Table column containing drill back link | Sold To Number |
| Table columns passed to application | Sold To Number |
| Application called | Sales Order Entry (P42101) |
| Form called | W42101C |
| Version called | ZJDE0001 |
9.1.3.3 Status Report
The Status Report enables you to view open sales order detail records based on the status of the sales order lines. The Order Status by Customer cluster bar chart enables you to view the number of open sales order lines at each status by customers. The Current Order Status pie chart enables you to view the percentage of order lines that are at each status in the sales order cycle. The Order Line Summary by Customer and Status table shows the total number of lines at each status for the customers that are used in the charts. The Status by Customer Details table displays the status of each open sales order detail record that was used to create the charts sequenced by customer. The table displays the number of order lines at each status for each customer.
This report contains the following components:
-
Order Status by Customer (bar graph)
-
Current Order Status (pie chart)
-
Order Line Summary by Customer and Status (table)
-
Status by Customer Details Table
The Status by Customer Details table component contains drill back functionality as described in the following table:
| Functionality | Value |
|---|---|
| Table column containing drill back link | Sold To Number |
| Table columns passed to application | Sold To Number |
| Application called | Sales Order Entry (P42101) |
| Form called | W42101C |
| Version called | ZJDE0001 |
9.1.3.4 Commitment Report
The Commitment Report enables you to view open sales order detail records based on the quantity in each commitment bucket for the items within a specific category code (SRP1) within the specific branch plants. This report can be helpful in determining which items are backordered. You can view this information for a particular set of business units, items, or by commitment bucket.
This report contains the following components:
-
Commitments by Item (bar graph)
-
Commitment Summary by Item (table)
-
Commitment Details Table
The Commitment Details table component contains drill back functionality as described in the following table:
| Functionality | Value |
|---|---|
| Table column containing drill back link | Item Number |
| Table columns passed to application | Item Number |
| Application called | Item Availability (P41202) |
| Form called | W41202A |
| Version called | ZJDE0001 |
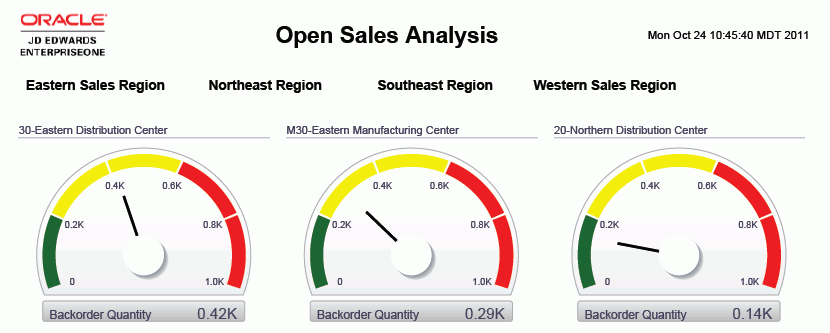
9.1.3.5 Open Sales Analysis
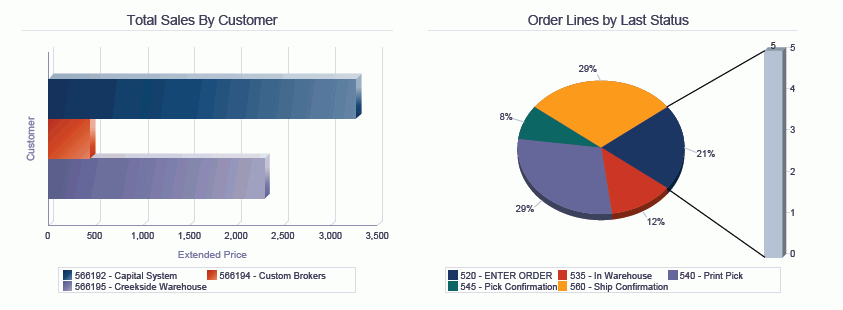
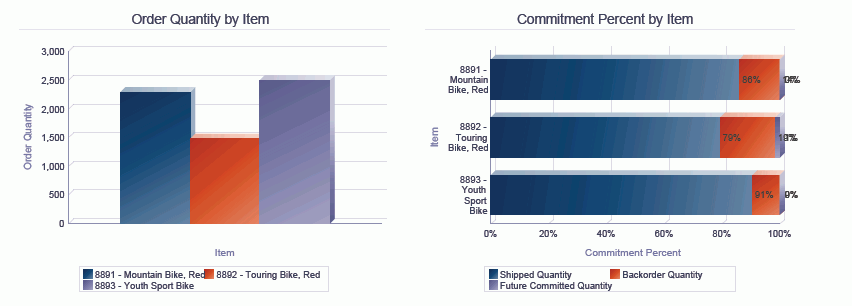
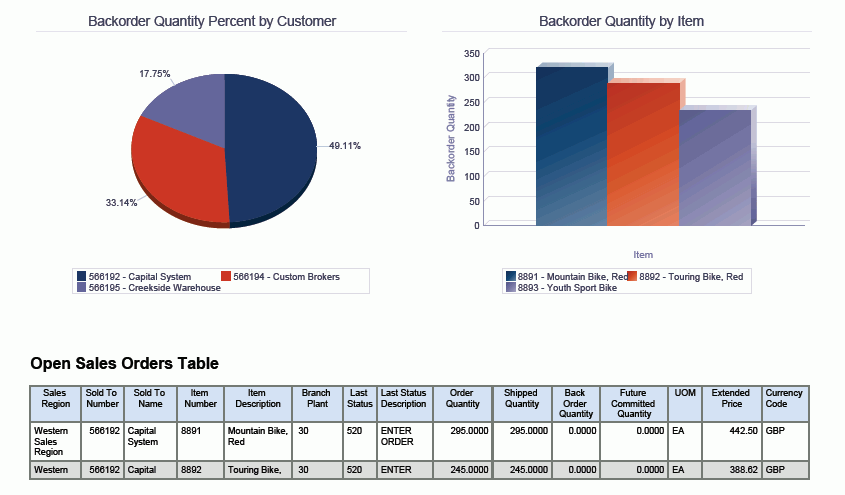
The Open Sales Analysis enables you to view open sales orders using region information as a filter. The Backorder Quantity dials display the level of backorders and the value for each branch plant within a region. The Total Sales by Customer bar chart enables you to compare the sales volumes for different customers within the selected region. The Order Lines by Last Status pie chart enables you to view the percentage of order lines that are at each status in the sales order cycle. The Order Quantity by Item bar chart enables you to view the total quantity of an item that is on open sales order lines for the selected region. The Commitment Percent by Item bar chart displays the percent of the total open quantity of an item that is included in each commitment category. The Backorder Quantity Percent by Customer pie chart displays the percent of the total backorder quantity for each customer. The Backorder Quantity by Item bar chart enables you to view the quantity of an item that is on backorder. The Open Sales Orders Table displays the sales order detail lines that were included in the selected region.
This report contains the following components:
-
Backorder Quantity by Branch Plant (gauges)
-
Total Sales by Customer (horizontal bar graph)
-
Order Lines by Last Status (pie chart)
-
Order Quantity by Item (bar graph)
-
Commitment Percentage by Item (horizontal bar graph)
-
Backorder Quantity Percentage by Customer (pie chart)
-
Backorder Quantity by Item (bar graph)
-
Open Sales Orders Table
The Open Sales Orders table component contains drill back functionality as described in the following table:
| Functionality | Value |
|---|---|
| Table column containing drill back link | Item Number |
| Table columns passed to application | Sold To Number, Item Number, Order Number |
| Application called | Sales Order Entry (P42101) |
| Form called | W42101C |
| Version called | ZJDE0001 |
9.2 One View Historical Sales Inquiry (P42271)
Access the One View Historical Sales Inquiry application (P42271) on the Sales Order Inquiries (G42112) menu. Use One View Historical Sales Inquiry to query open sales orders including related data from the Item Branch and Customer Master Line of Business. One View Historical Sales Inquiry uses the following business views and tables:
| Business View | Tables |
|---|---|
| V42271A | Sales Order Detail History table (F42119), F4101, and F03012 |
| V42271B | F4101 |
| V42271C | F03012 |
This application provides the ability to create and run reports on historical or closed sales orders including customer and item information, such as: average sales by item, total sales by customer, top customer sales by item, top sales by branch plant, and current backorders by branch. Additional reporting is possible through customer and item category codes to allow reporting, for example, by sales catalog code, sub section, or customer region.
9.2.1 Processing Options
Processing options enable you to specify the default processing for programs and reports.
9.2.1.1 Defaults
- 1. Branch Plant - Detail
-
Specify the branch/plant that you want the system to use as the default value for filtering sales order detail lines.
- 2. Order Company (Order Number)
-
Specify the order company that you want the system to use as the default value for filtering sales order detail lines.
- 3. Order Type
-
Specify the document type that you want the system to use as the default value for filtering sales order detail lines.
- 4. As If Currency Code
-
Specify the default value for the Currency Code that the system uses when calculating as if currency amounts.
9.2.1.2 Process
- 1. Perform Primary UOM Quantity Conversions
-
Specify whether to bypass the processing of order quantities to the primary unit of measure. If this processing option is set to '1', the primary unit of measure process will be bypassed.
- 2. Perform As If Currency Conversions
-
Specify whether to bypass the processing of order amounts to the as if currency. If this processing option is set to '1', as if currency process will be bypassed.
9.2.1.3 Versions
- 1. One View Open Sales Inquiry (P42270)
-
Specify the version of One View Open Sales Inquiry (P42270) the system uses to access the open sales inquiry application.
If you leave this processing option blank, the system uses version ZJDE0001.
- 2. One View Sales To Date Inquiry (P42272)
-
Specify the version of One View Sales To Date Inquiry (P42272) the system uses to access the sales to date inquiry application.
If you leave this processing option blank, the system uses version ZJDE0001.
- 3. One View Sales Price Inquiry (P42273)
-
Specify the version of One View Sales Price Inquiry (P42273) the system uses to access the sales price inquiry application.
If you leave this processing option blank, the system uses version ZJDE0001.
9.2.2 Special Processing
One View Historical Sales Inquiry converts all quantity-related grid columns to the primary UOM. However, you can set the processing option to bypass primary UOM processing if you are not using quantity fields in your reports.
The system requires values in the Company or Branch Plant fields. The system use the values to build data selection to the Customer Master by Line of Business. If the Branch Plant is used as a filter, then the system retrieves the associated Company for the Branch Plant. The filter for Company takes precedence over any Branch Plant filtering.
9.2.2.1 Currency
Currency-related amounts are shown in the common currency that is entered in the processing option, the domestic currency, and any foreign currencies. The system displays the values for the currency code that is entered. This includes:
-
As If Currency Code
-
As If Unit Price
-
As If Extended Price
-
As If Unit Cost
-
As If Extended Cost
-
Accumulated Amount Invoiced (As If)
If Currency Processing is turned off in the processing options, the system does not display the fields in the grid and hides the As If Currency field on the header.
9.2.2.2 Unit Price Calculation
To calculate the Unit Price in Primary and the Unit Cost in Primary, the system uses the As If Currency Code and the Primary UOM. If you do not set the Primary UOM and Currency Code processing options, the system does not display the fields in the grid. If you set one of the processing options, the system uses a ratio of "1" to compute the missing information (for example, if you are only converting to primary, the system uses a currency ratio of 1.00).
9.2.2.3 Profit Calculations
The profit calculations use the As If amounts to compute the profit margin amount and percentage. If you do not use the As If amounts, the system uses the domestic amounts. Profit calculations also include the profit amount used to compute the%. This amount can be summed across order lines to give an aggregate profit amount.
9.2.3 Reports
The reports delivered with the One View Historical Sales Inquiry application are:
-
Total Historical Sales Report
-
Average Historical Sales Report
-
Top Customers Report
-
Historical Sales Analysis
9.2.3.1 Total Historical Sales Report
The Total Historical Sales Report enables you to view the historical sales order detail records based on item information.The Sales by SRP2 and Branch Plant cluster bar chart enables you to compare the historical sales for items within the sub section category codes across different branches. You could use another category code associated with the item record. The Sales by Category Code pie chart enables you to view the historical percentage of sales by the sub section category code. You could use another category code associated with the item record. The Sales Summary by Category Code table shows the total historical values for the items within the sub section category code and branch plant that are used in the charts. The Branch Sales by Category Code and Item detail table displays all the historical sales order detail records that were used to create the charts sequenced by Branch Plant and category code. The table displays subtotals for Sub Section category code and for each Branch Plant.
This report contains the following components:
-
Sales by Sub Section and Branch Plant (bar graph)
-
Sales Percentage by Sub Section (pie chart)
-
Order Quantity Summary by Sub Section (table)
-
Order Sales Quantity by Branch Plant and Sub Section (table)
The Order Sales Quantity by Branch Plant and Sub Section table component contains drill back functionality as described in the following table:
| Functionality | Value |
|---|---|
| Table column containing drill back link | Item Number |
| Table columns passed to application | Item Number |
| Application called | Sales Order Entry (P42101) |
| Form called | W42101C |
| Version called | ZJDE0001 |
9.2.3.2 Average Historical Sales Report
The Average Historical Sales Report enables you to view the average historical sales order detail records based on item information. The Sales by Sub Section and Branch Plant cluster bar chart enables you to compare the average historical sales for items within the sub section category codes across different branches. You could use another category code associated with the item record. The Sales Percent by Sub Section pie chart enables you to view the average historical percentage of sales by the sub section category code. You could use another category code associated with the item record. The Order Quantity Summary by Sub Section table shows the average historical values for the sub section category code and branch plant that are used in the charts. The Order Sales Quantity by Branch Plant and Sub Section detail table displays all the historical sales order detail records that were used to create the charts sequenced by Branch Plant and sub section category code. The table displays the averages for each Sub Section category code and for each Branch Plant.
This report contains the following components:
-
Sales by Sub Section and Branch Plant (bar graph)
-
Sales Percentage by Sub Section (pie chart)
-
Order Quantity Summary by Sub Section (table)
-
Order Sales Quantity by Branch Plant and Sub Section (table)
The Order Sales Quantity by Branch Plant and Sub Section table component contains drill back functionality as described in the following table:
| Functionality | Value |
|---|---|
| Table column containing drill back link | Item Number |
| Table columns passed to application | Item Number |
| Application called | Sales Order Entry (P42101) |
| Form called | W42101C |
| Version called | ZJDE0001 |
9.2.3.3 Top Customers Report
The Top Customers Report enables you to view historical sales order detail records based on customer information. The Top 10 Customer Sales by Item cluster bar chart enables you to compare the historical sales of items to your top 10 customers. The Total Sales Percent by Customer pie chart enables you to view the percentage of total historical sales by customer. The Top Customer Sales Summary table shows the total historical sales amounts for the customers that are used in the charts. The Top Customers Details Table displays all the historical sales order detail records that were used to create the charts sequenced by customer and item. The table displays subtotals for each customer.
This report contains the following components:
-
Top 10 Customer Sales by Item (horizontal bar graph)
-
Total Sales Percentage by Customer (pie chart)
-
Top Customer Sales Summary (table)
-
Top Customers Details Table
The Top Customers Details table component contains drill back functionality as described in the following table:
| Functionality | Value |
|---|---|
| Table column containing drill back link | Sold To Number |
| Table columns passed to application | Sold To Number |
| Application called | Sales Order Entry (P42101) |
| Form called | W42101C |
| Version called | ZJDE0001 |
9.2.3.4 Historical Sales Analysis
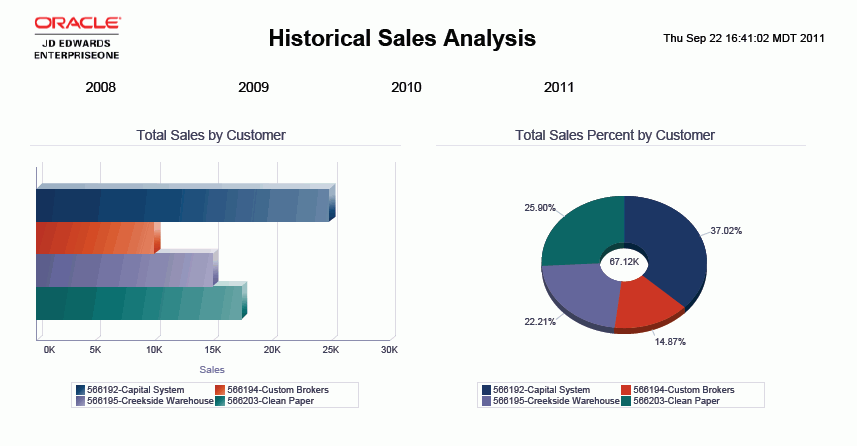
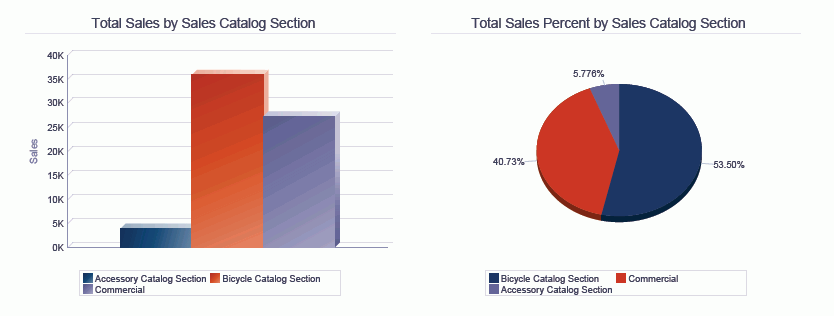
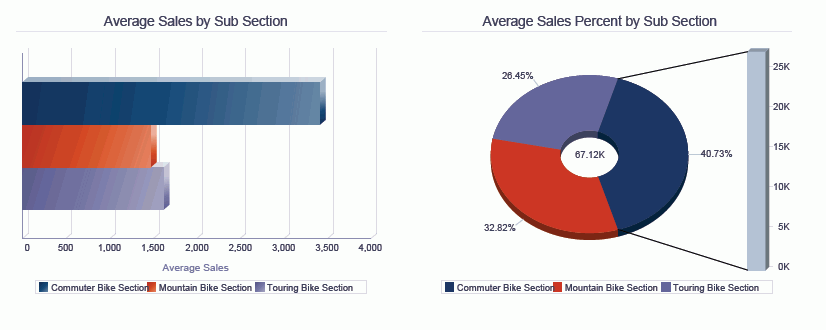
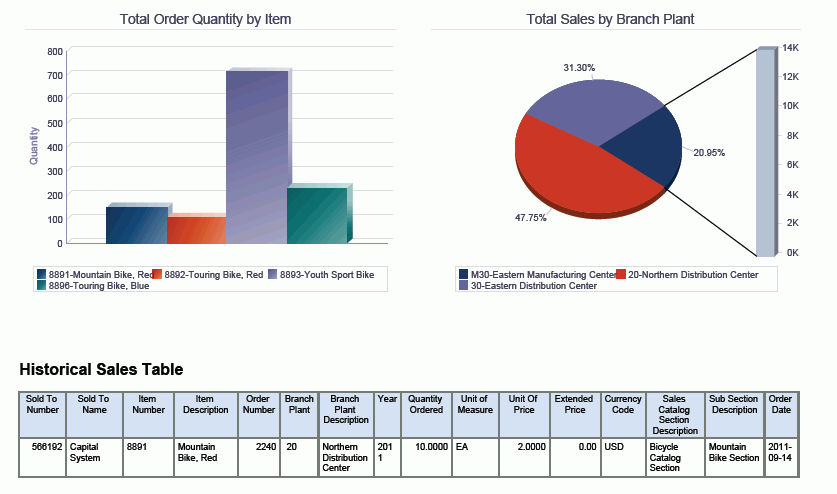
The Historical Sales Analysis enables you to view open sales orders using region information as a filter. The Total Sales by Customer bar chart enables you to compare the historic sales volumes for different customers within the selected region. The Total Sales Percent by Customer pie chart enables you to view the percentage of sales by customers in the selected region. The Total Sales by Sales Catalog Section bar chart enables you to view the total historical sales for items within each sales catalog section category code.You could use another category code associated with the item record. The Total Sales Percent by Sales Catalog Section pie chart enables you to view the percentage of historical sales by the sales catalog section category. You could use another category code associated with the item record. The Average Sales by Sub Section bar chart enables you to view the average historical sales for items within each sub section category code. You could use another category code associated with the item record. The Average Sales Percent by Sub Section pie chart enables you to view the percentage of historical sales by the sub section category code or you could use another category code associated with the item record. The Total Order Quantity by Item bar chart enables you to view the total historical quantity of items that have been sold for the selected region. The Total Sales by Branch Plant pie chart enables you to view the percentage of historical sales by branch plants in the selected region. The Historical Sales Orders Table displays the sales order detail lines that were included in the selected region.
This report contains the following components:
-
Total Sales by Customer (horizontal bar graph)
-
Total Sales Percentage by Customer (donut graph)
-
Total Sales by Sales Catalog Section (bar graph)
-
Total Sales Percentage by Sales Catalog Section (pie chart)
-
Average Sales by Sub Section (horizontal bar graph)
-
Average Sales Percentage by Sub Section (donut graph)
-
Total Order Quantity by Item (bar graph)
-
Total Sales by Branch Plant (pie chart)
-
Historical Sales Table
The Historical Sales table component contains drill back functionality as described in the following table:
| Functionality | Value |
|---|---|
| Table column containing drill back link | Order Number |
| Table columns passed to application | Sold To Number, Item Number, Order Number |
| Application called | Sales Order Entry (P42101) |
| Form called | W42101C |
| Version called | ZJDE0001 |
9.3 One View Sales To Date Inquiry (P42272)
Access the One View Sales To Date Inquiry application (P42272) on the Sales Order Inquiries (G42112) menu. Use One View Sales To Date Inquiry to query open and historical sales orders. One View Sales To Date Inquiry uses the One View Sales To Date Inquiry business view (V42272A), which includes columns from the F4211 and the F42119 and Fiscal Date Patterns table (F0008). V42272B fetches additional information from the F03012.
This application provides the ability to create and run reports on open and historical (or closed) sales orders including customer and item information, such as: customer sales by period, item sales by period, sales profit by period, sales price by period, sales costs by period, average profit per period, sales profit by customer, and sales profit by item. Additional reporting is possible through item and customer category codes to allow reporting, for example, by sales catalog code, sub section, or customer region.
(Release 9.1 Update) This application also provides the ability to create and run reports to view sales orders, revenue, potential revenue, and profit information associated with sales opportunities.
9.3.1 Processing Options
Processing options enable you to specify the default processing for programs and reports.
9.3.1.1 Defaults
- 1. Branch Plant - Detail
-
Specify the branch/plant that you want the system to use as the default value for filtering sales order detail lines.
- 2. Order Company (Order Number)
-
Specify the order company that you want the system to use as the default value for filtering sales order detail lines.
- 3. Order Type
-
Specify the document type that you want the system to use as the default value for filtering sales order detail lines.
- 4. Status Code - Next From
-
Specify a default value for the Next Status From that you want the system to use for filtering sales order lines.
If you leave this processing option blank, the system does not use the Next Status From Value for filtering the display of sales order lines.
- 5. Status Code - Next Thru
-
Specify a default value for the Next Status Thru that you want the system to use for filtering sales order lines.
If you leave this processing option blank, the system does not use the Next Status Thru Value for filtering the display of sales order lines.
- 6. As If Currency Code
-
Specify the default value for the Currency Code that the system uses when calculating as if currency amounts.
9.3.1.2 Process
- 1. Perform Primary UOM Quantity Conversions
-
Specify whether to bypass the processing of order quantities to the primary unit of measure. If this processing option is set to '1', the primary unit of measure process will be bypassed.
- 2. Perform As If Currency Conversions
-
Specify whether to bypass the processing of order amounts to the as if currency. If this processing option is set to '1', as if currency process will be bypassed.
9.3.1.3 Versions
- 1. One View Open Sales Inquiry (P42270)
-
Specify the version of One View Open Sales Inquiry (P42270) the system uses to access the open sales inquiry application.
If you leave this processing option blank, the system uses version ZJDE0001.
- 2. One View Historical Sales Inquiry (P42271)
-
Specify the version of One View Historical Sales Inquiry (P42271) the system uses to access the historical sales inquiry application.
If you leave this processing option blank, the system uses version ZJDE0001.
- 3. One View Sales Price Inquiry (P42273)
-
Specify the version of One View Sales Price Inquiry (P42273) the system uses to access the sales price inquiry application.
If you leave this processing option blank, the system uses version ZJDE0001.
9.3.2 Special Processing
One View Sales to Date Inquiry converts all quantity-related grid columns to the primary UOM. However, you can set the processing option to bypass primary UOM processing if you are not using quantity fields in your reports.
The system requires values in the Company or Branch Plant fields. The system uses the values to build data selection to the Customer Master by Line of Business. If the Branch Plant is used as a filter, then the system retrieves the associated Company for the Branch Plant. The filter for Company takes precedence over any Branch Plant filtering.
The system determines the Fiscal Period for each sales order detail line based on the Requested date on the sales order detail line.
9.3.2.1 Currency
Currency-related amounts are shown in the common currency that is entered in the processing option, the domestic currency, and any foreign currencies. The system displays the values for the currency code that is entered. This includes:
-
As If Currency Code
-
As If Unit Price
-
As If Extended Price
-
As If Unit Cost
-
As If Extended Cost
-
Accumulated Amount Invoiced (As If)
If Currency Processing is turned off in the processing options, the system does not display the fields in the grid and hides the As If Currency field on the header.
9.3.2.2 Unit Price Calculation
To calculate the Unit Price in Primary and the Unit Cost in Primary, the system uses the As If Currency Code and the Primary UOM. If you do not set the Primary UOM and Currency Code processing options, the system does not display the fields in the grid. If you set one of the processing options, the system uses a ratio of "1" to compute the missing information (for example, if you are only converting to primary, the system uses a currency ratio of 1.00).
9.3.2.3 Profit Calculations
The profit calculations use the As If amounts to compute the profit margin amount and percentage. If you do not use the As If amounts, the system uses the domestic amounts. Profit calculations also include the profit amount used to compute the%. This amount can be summed across order lines to give an aggregate profit amount.
9.3.3 Reports
The reports delivered with the One View Sales To Date Inquiry application are:
-
Customer Sales Report
-
Item Sales Report
-
Sales Profit Report
-
Sales to Date Analysis
-
Sales by Opportunity (Release 9.1 Update)
-
Opportunity Trends (Release 9.1 Update)
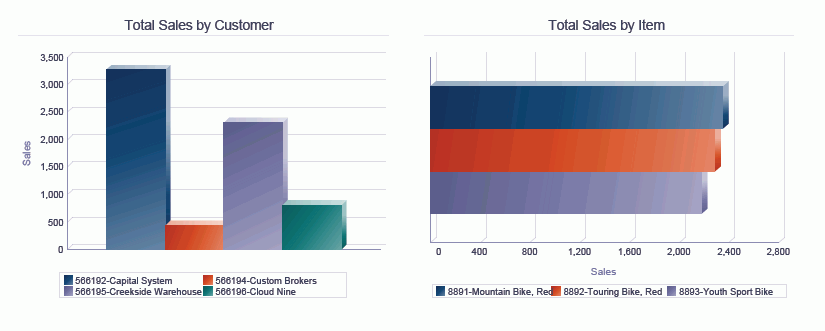
9.3.3.1 Customer Sales Report
The Customer Sales Report enables you to view the open and historical sales orders detail records based on customer information. The Total Sales by Customer and Period cluster bar chart enables you to compare the sales for customers by period. This chart can help you evaluate trends in your sales cycles. The Total Customer Sales by Period pie chart displays the percentage of customer sales by period. The Customer Sales Summary by Fiscal Period table shows the total sales amounts for each customer and period that are used in the charts. The Customer Sales by Fiscal Period Detail Table displays all the sales order detail records that were used to create the charts sequenced by Customer, Fiscal Year, and then Fiscal Period. The table displays subtotals for each customer.
This report contains the following components:
-
Total Sales by Customer and Period (bar graph)
-
Total Customer Sales by Period (pie chart)
-
Customer Sales Summary by Fiscal Period (table)
-
Customer Sales by Fiscal Period Detail Table
The Customer Sales by Fiscal Period Detail table component contains drill back functionality as described in the following table:
| Functionality | Value |
|---|---|
| Table column containing drill back link | Sold To Number |
| Table columns passed to application | Sold To Number |
| Application called | Sales Order Entry (P42101) |
| Form called | W42101C |
| Version called | ZJDE0001 |
9.3.3.2 Item Sales Report
The Item Sales Report enables you to view the open and historical sales order detail records based on item information. The Total Sales by Item and Period cluster bar chart enables you to compare the sales for items by period. This chart can help you evaluate trends in your sales cycles. The Total Item Sales by Period pie chart displays the percentage of item sales by period. The Item Sales Summary by Fiscal Period table shows the total sales amounts for each item and period that are used in the charts. The Item Sales by Fiscal Period Detail Table displays all the sales order detail records that were used to create the charts sequenced by Fiscal Year and Fiscal Period. The table displays subtotals for each item and each period.
This report contains the following components:
-
Total Sales by Item and Period (bar graph)
-
Total Item Sales by Period (pie chart)
-
Item Sales Summary by Fiscal Period (table)
-
Item Sales by Fiscal Period Detail Table
The Item Sales by Fiscal Period Detail table component contains drill back functionality as described in the following table:
| Functionality | Value |
|---|---|
| Table column containing drill back link | Item Number |
| Table columns passed to application | Item Number |
| Application called | Sales Order Entry (P42101) |
| Form called | W42101C |
| Version called | ZJDE0001 |
9.3.3.3 Sales Profit Report
The Sales Profit Report enables you to view the open and historical sales order detail records based on fiscal period information. The Total Profit by Fiscal Period bar chart enables you to compare the sales for each period. This chart can help you evaluate trends in your sales cycles. The Total Sales and Total Cost by Fiscal Period cluster bar chart displays the price and cost for each fiscal period. This report enables you to compare the profitability of different periods. The Average Profit Percent by Period pie chart enables you to compare the average sales profit percentage by period. The Profit Margin Summary by Sub Section table shows the profit margin for sub section category code that is used in the charts. The Profit Margin by Sub Section Details Table displays all the sales order detail records that were used to create the charts sequenced sub section category code and then Fiscal Year and Period. The table displays subtotals for each sub section.
This report contains the following components:
-
Total Profit by Fiscal Period (bar graph)
-
Total Sales and Total Cost by Fiscal period (bar graph)
-
Average Profit Percentage by Period (pie chart)
-
Profit Margin Summary by Sub Section (table)
-
Profit Margin by Sub Section Details Table
-
Average Profit Margin by Sub Section Details Table
The Profit Margin by Sub Section Details table component contains drill back functionality as described in the following table:
| Functionality | Value |
|---|---|
| Table column containing drill back link | Item Number |
| Table columns passed to application | Item Number |
| Application called | Sales Order Entry (P42101) |
| Form called | W42101C |
| Version called | ZJDE0001 |
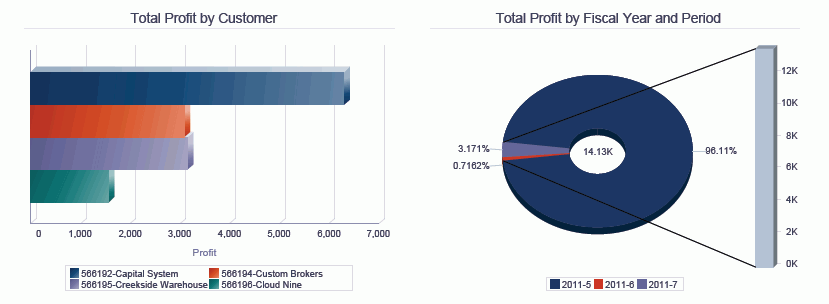
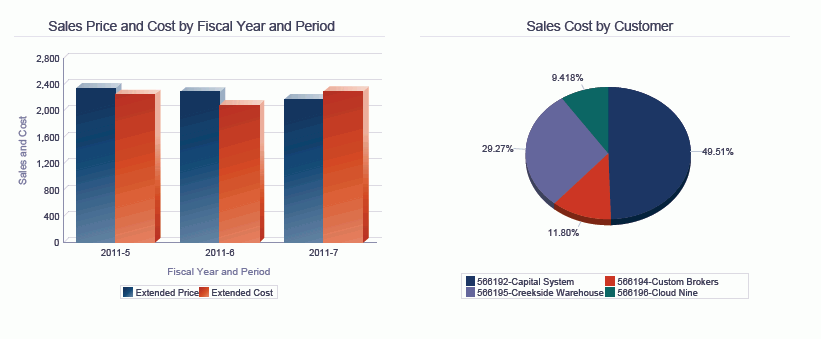
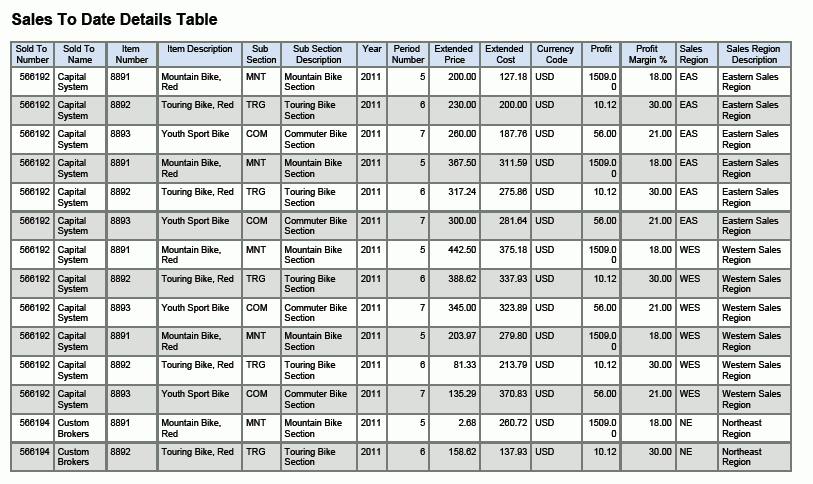
9.3.3.4 Sales to Date Analysis
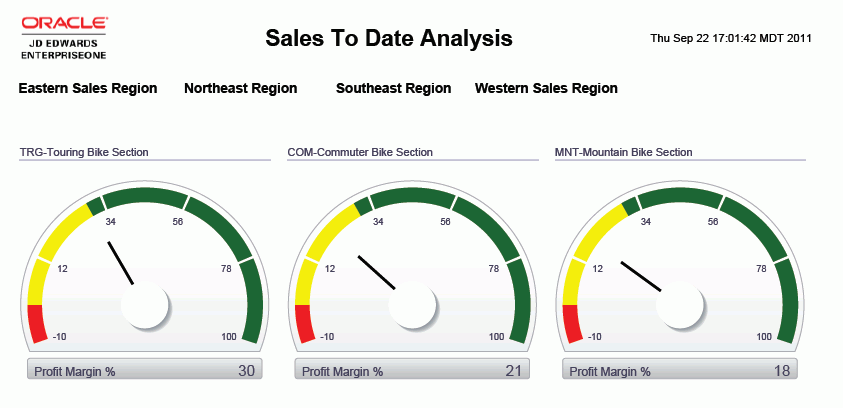
The Sales To Date Analysis enables you to view the open and historical sales orders using region information as a filter. The Profit Margin Percent dial enables you to compare the profit margin on sales orders for the different sub section category codes within the selected region. You could use another category code associated with the item record. The Total Sales by Customer bar chart enables you to view the total sales by customers in the selected region. The Total Sales by Item bar chart enables you to view the total sales for items in the selected region. The Total Profit by Customer bar chart enables you to view the profitability of sales to each customer in the selected region. The Total Profit by Fiscal Year and Period pie chart enables you to compare the sales profit percentage by period. The Sales Price and Cost by Fiscal Year and Period cluster bar chart displays the price and cost for items within each fiscal period. You can compare the profitability of different periods. The Sales Cost by Customer pie chart enables you to view the percentage of sales costs by customer. The Sales to Date Details Table displays both the open and historical sales order detail lines that were included in the selected region.
This report contains the following components:
-
Profit Margin Percentage by Sub Section (gauges)
-
Total Sales by Customer (bar graph)
-
Total Sales by Item (horizontal bar graph)
-
Total Profit by Customer (horizontal bar graph)
-
Total Profit by Fiscal Year and Period (donut graph)
-
Sales Price and Cost by Fiscal year and Period (bar graph)
-
Sales Cost by Customer (pie chart)
-
Sales to Date Details Table
The Sales to Date Details table component contains drill back functionality as described in the following table:
| Functionality | Value |
|---|---|
| Table column containing drill back link | Sold To Number |
| Table columns passed to application | Sold To Number, Item Number, Order Number |
| Application called | Sales Order Entry (P42101) |
| Form called | W42101C |
| Version called | ZJDE0001 |
9.3.3.5 Sales by Opportunity Report (Release 9.1 Update)
The Sales by Opportunity report enables you to view detailed information about the number of orders created, sales revenue, and potential revenue generated based on opportunity data.
Several bar charts are available to enable you to view orders, sales revenue, and potential revenue by opportunity and by cost center.
Additionally, the Summary of Sales by Opportunity summary table enables you to view the sales summary by cost center and opportunity ID. You can also use the Sales Opportunity Details Table to analyze details associated with the sales generated from opportunities.
This report contains the following components:
-
Orders by Opportunity (bar chart)
-
Sales Revenue by Opportunity (bar chart)
-
Sales Revenue by Cost Center from Opportunity (bar chart)
-
Potential Revenue by Opportunity (bar chart)
-
Potential Revenue by Cost Center from Opportunity (bar chart)
-
Summary of Sales by Opportunity (summary table)
-
Sales Opportunity Details Table
9.3.3.6 Opportunity Trends Report (Release 9.1 Update)
The Opportunity Trends report enables you to view detailed information about the sales revenue, profit, profit margin, and potential revenue generated based on a sales opportunity record.
The Total Sales from Opportunities by Period bar chart enables you to view the total revenue generated by opportunities in each fiscal period. Additional bar charts enable you to view total profit, average profit, and profit margin associated with opportunities for a fiscal period.
Additionally, the Summary of Profit from Opportunity by Fiscal Period summary table enables you to view the profit summary by fiscal period and opportunity ID. You can also use the Profit from Opportunity by Fiscal Period detail table to analyze details associated with the profit generated from opportunities.
This report contains the following components:
-
Total Sales from Opportunities by Period (bar chart)
-
Total Profit from Opportunities by Period (bar chart)
-
Average Profit from Opportunities by Period (bar chart)
-
Profit Margin from Opportunities by Period (bar chart)
-
Summary of Profit from Opportunity by Fiscal Period (summary table)
-
Profit from Opportunity by Fiscal Period Detail Table
9.4 One View Sales Price Inquiry (P42273)
Access the One View Sales Price Inquiry application (P42273) on the Sales Order Inquiries (G42112) menu. Use One View Sales Price Inquiry to create item pricing reports. One View Sales Price Inquiry uses the following business views and tables:
| Business View | Tables |
|---|---|
| One View Sales Price Inquiry (V42273A) | F4106, Item Key ID Master File (F40941), and Customer Key ID Master File (F40942) |
| One View Customer Master (V42273B) | F03012 |
| One View Item Master (V42273C) | F4101 |
This application provides the ability to create and run reports for sales prices using customer and item information, such as: price list by customer, item price list by sub section, item price list by branch, highest priced items, item prices by region, and item price list by customer group. Additional reporting is possible through item and customer category codes to allow reporting, for example, by sales catalog code, sub section, or customer region.
9.4.1 Processing Options
Processing options enable you to specify the default processing for programs and reports.
9.4.1.1 Defaults
- 1. Branch Plant
-
Specify the branch/plant that you want the system to use as the default value for filtering sales order detail lines.
- 2. As If Currency Code
-
Specify the default value for the Currency Code that the system uses when calculating as if currency amounts.
9.4.1.2 Process
- 1. Perform As If Currency Conversions
-
Specify whether to bypass the processing of order amounts to the as if currency. If this processing option is set to '1', as if currency process will be bypassed.
9.4.1.3 Versions
- 1. One View Open Sales Inquiry (P42270)
-
Specify the version of One View Open Sales Inquiry (P42270) the system uses to access the open sales inquiry application.
If you leave this processing option blank, the system uses version ZJDE0001.
- 2. One View Historical Sales Inquiry (P42271)
-
Specify the version of One View Historical Sales Inquiry (P42271) the system uses to access the historical sales inquiry application.
If you leave this processing option blank, the system uses version ZJDE0001.
- 3. One View Sales To Date Inquiry (P42272)
-
Specify the version of One View Sales To Date Inquiry (P42272) the system uses to view additional sales order details for the displayed order number.
If you leave this processing option blank, the system uses version ZJDE0001.
9.4.2 Special Processing
The system requires a value in at least one header field so that a wide-open search does not hinder performance. Enter a value in one of these fields:
-
Item Number
-
Branch Plant
-
Item Price Group
-
Customer Number
-
Customer Price Group
If the F4106 record contains the item number, and a branch/plant, One View Sales Price Inquiry retrieves category code values from the F4102 table. If there is no branch/plant, then it retrieves the category code values from the F4101 table. If the F4106 record contains the customer number, the One View Sales Price Inquiry retrieves category code values from the F03012 table. If the record also has a branch/plant, the system uses line of business logic to retrieve the F03012 record. Otherwise, the application retrieves the Customer Master with Company '00000'.
9.4.2.1 Currency
Currency related amounts are shown in the common currency that is entered in the processing option, the domestic currency, and any foreign currencies. The system displays the values for the currency code that is entered, which includes:
-
As If Currency Code
-
As If Unit Price
-
As If Extended Price
-
As If Unit Cost
-
As If Extended Cost
-
Accumulated Amount Invoiced (As If)
If Currency Processing is turned off in the processing options, the system does not display the fields in the grid and hides the As If Currency field in the header.
9.4.2.2 Unit Price and Unit Cost Calculation
To calculate the Unit Price in Primary and the Unit Cost in Primary, the system uses the As If Currency Code and the Primary UOM. If you do not set the Primary UOM and Currency Code processing options, the system does not display the fields in the grid. If you set one of the processing options, the system uses a ratio of "1" to compute the missing information (for example, if you are only converting to primary, the system uses a currency ratio of 1.00).
9.4.3 Reports
The reports delivered with the One View Sales Price Inquiry application are:
-
Customer Price List Report
-
Item Price List Report
-
Price Comparison by Region Report
-
Sales Price Analysis
9.4.3.1 Customer Price List Report
The Customer Price List Report enables you to view the current base price of items for each customer in the data selection. The Customer Price List Details Table displays the unit price for each customer, customer group, item group, item, and branch plant. The system displays only the prices that are current based on the Effective From and Thru Dates and the date the report was created.
This report contains a table listing customer price list details.
The Customer Price List Details table component of this report contains drill back functionality as described in the following table:
| Functionality | Value |
|---|---|
| Table column containing drill back link | Customer Number |
| Table columns passed to application | Branch Plant |
| Application called | Base Price Revisions (P4106) |
| Form called | W4106J |
| Version called | None |
9.4.3.2 Item Price List Report
The Item Price List Report enables you to view the current base price of items. The Top 5 Highest Priced Items bar chart enables you to evaluate the most expensive items in your system. The Item Price List Details Table displays the unit price for each item and branch plant. The system displays only the prices that are current based on the Effective From and Thru Dates and the date the report was created.
This report contains the following components:
-
Top 5 Highest Priced Items (bar graph)
-
Item Price List Details Table
The Item Price List Details table component contains drill back functionality as described in the following table:
| Functionality | Value |
|---|---|
| Table column containing drill back link | Item Number |
| Table columns passed to application | Item Number, Branch Plant |
| Application called | Base Price Revisions (P4106) |
| Form called | W4106J |
| Version called | None |
9.4.3.3 Price Comparison by Region Report
The Price Comparison by Region Report enables you to view the current base price using sales region as sorting criteria. You could use another category code associated with the item record to sort the price information. The Price Comparison by Region cluster bar chart enables you to compare the sales for items by region. This chart can help you evaluate trends in your sales cycles. The Price Comparison by Region Details Table displays the unit price for each item record that was used to create the charts sequenced by region category code and then sales catalog section category code. The system displays only the prices that are current based on the Effective From and Thru Dates and the date the report was created.
This report contains the following components:
-
Price Comparison by Region (horizontal bar graph)
-
Price Comparison by Region Details Table
The Price Comparison by Region Details table component contains drill back functionality as described in the following table:
| Functionality | Value |
|---|---|
| Table column containing drill back link | Item Number |
| Table columns passed to application | Item Number |
| Application called | Base Price Revisions (P4106) |
| Form called | W4106J |
| Version called | None |
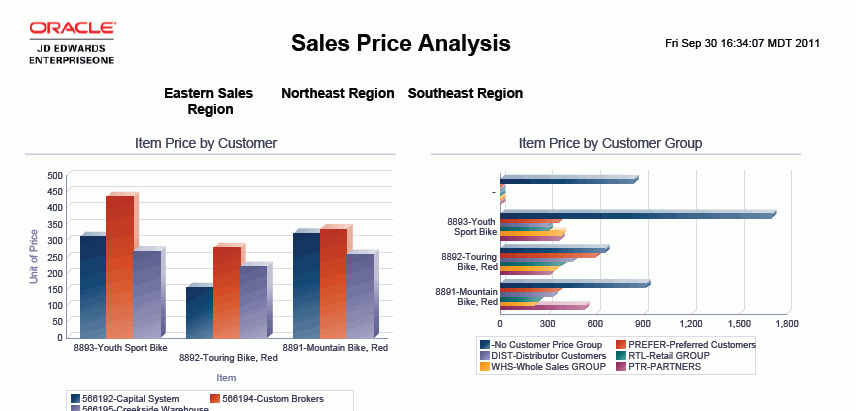
9.4.3.4 Sales Price Analysis
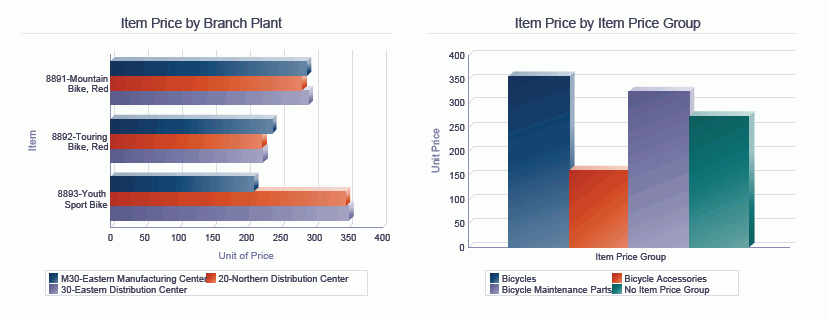
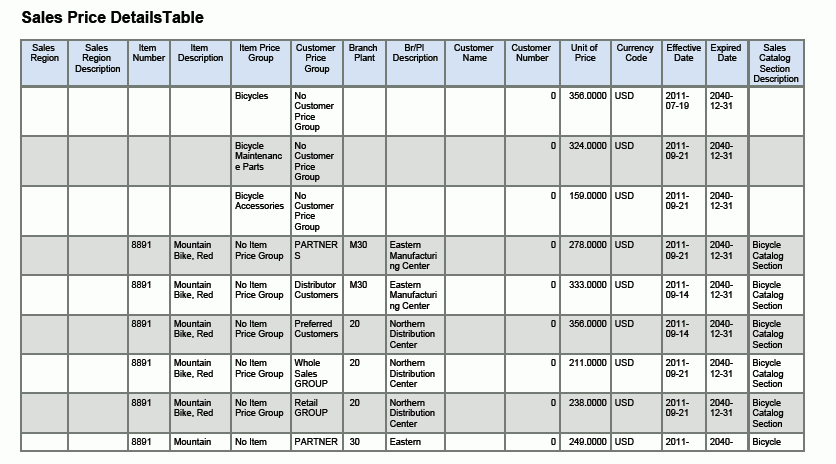
The Sales Price Analysis enables you to view the current base prices using region information as a filter. The Item Price by Customer cluster bar chart enables you to compare the unit price for items for customers within the selected region. The Item Price by Customer Group cluster bar chart enables you to compare the unit price for items for different customer groups within the selected region. The Item Price by Branch Plant cluster bar chart enables you to compare the unit price for items for different branch plants within the selected region. The Item Price by Item Price Group bar chart enables you to view the unit price for different item price groups within the selected region. The Sales Price Details Table displays all the base price records that were included in the selected region.
This report contains the following components:
-
Item Price by Customer (bar graph)
-
Item Price by Customer Group (horizontal bar graph)
-
Item Price by Branch Plant (horizontal bar graph)
-
Item Price by Item Price Group (bar graph)
-
Sales Price Details Table
The Sales Price Details table component contains drill back functionality as described in the following table:
| Functionality | Value |
|---|---|
| Table column containing drill back link | Item Number |
| Table columns passed to application | Item Number, Branch Plant |
| Application called | Base Price Revisions (P4106) |
| Form called | W4106J |
| Version called | None |