16 One View Reporting for Service Management (Release 9.1 Update)
This chapter provides overview information, processing options, special processing, and reports for the following applications:
|
Note: The One View Reporting for Service Management module includes three applications and the reports delivered with the applications. In addition to these, this module also includes the use of the five applications and the reports delivered with One View Reporting for Capital Asset Management. |
16.1 One View Case Management Inquiry (P90CG530)
Access the One View Case Management Inquiry application (P90CG530) from the Daily Case Processing (G17132) menu. Use One View Case Management Inquiry to analyze cases for such measures as aging, how well case commitments were met, overdue open cases, case loads, and other case statistics. One View Case Management Inquiry uses the Case Master for OVR business view (V17550), which includes columns from the Case Master table (F1755). You can use this application to analyze your cases in many ways. Choose from over 230 columns in the business view and from numerous calculated columns in the grid that relate to additional case analysis information useful in analyzing cases. The information in these calculated columns does not exist elsewhere in JD Edwards EnterpriseOne because these are pulled together by the application. In addition to high-value reports delivered with the application, you can use this application to create reports for many business purposes. You can use the associated descriptions provided in the grid for assistance when developing custom reports.
One View Case Management Inquiry is delivered with five pre-defined reports. These reports are Case Aging, Case Commitment Results, Case Load, Overdue Open Cases, and Case Statistics. With these delivered reports, you can analyze key case metrics, such as case age by case type, how provider groups compare in cases that are closed early or late relative to the committed date, which assignees have more open overdue cases than others, how the rate of incoming cases compares to the rate of closing cases (useful to determine if backlog is developing), and case escalation and entitlement statistics.
16.1.1 Processing Options
Processing options enable you to specify the default processing for programs and reports.
16.1.1.1 Defaults
- 1. Case Closed Status Default
-
Specify the status that the system uses as default to define a closed case. The system uses this value along with the header option "Include Closed" to include all closed cases in the report.
If you leave this processing option blank, the system uses 999.
- 2. Case Cancelled Status Default
-
Specify the status that the system uses as default to define a cancelled case. The system uses this value along with the header option "Include Open" to include all open cases in the report. Open cases are those that are neither closed nor cancelled.
If you leave this processing option blank, the system uses 997.
- 3. Period Definition Default
-
Specify the period type that the system uses as default to analyze case loads. Valid values are:
1: Days
3: Months
If you leave this processing option blank, the system uses Weeks as the default value.
16.1.2 Special Processing
The One View Case Management Inquiry application uses special processing in the header options and in the calculated columns in the grid.
16.1.2.1 Special Processing in the Header
The One View Case Management Inquiry application uses the following special processing in these header options:
-
Period Types
You use the Period Types option to choose the period type for analyzing case loads. Options are Days, Weeks, and Months. The Case Load report shows an analysis of case loads over the past 13 periods. Periods can be days, weeks, or months. The system considers today as falling in period 13 and the oldest period that you can choose to analyze case loads is period 01. For example, if you are analyzing by weeks, then today falls in week 13 and the report shows an analysis for the last 12 weeks in addition to this week.
-
Include Open and Include Closed
You use these options to include either open or closed cases, or both in the report. You consider cases as open or closed based on their status and you can set default values for these statuses through the processing options. If you select both options, three of the five reports (Case Aging, Case Load, and Case Statistics reports) will analyze information for both open and closed cases. The Case Commitment Results report only analyzes closed cases and the Overdue Open Cases report only analyzes open cases.
16.1.2.2 Special Processing in the Calculated Grid Columns
The One View Case Management Inquiry application has numerous calculated columns provided in the grid. These columns aggregate or designate information about each case to facilitate reporting over data that is not available in the database in a form easy to report on. The reports delivered with the application are possible because of these columns. You can also use them when defining custom reports.
The One View Case Management Inquiry application uses the following special processing in these calculated columns in the grid:
-
Case Age in Days
The number of days from today's date and the Begin Date (EFTB) if the case is open, or the number of days from the Ending Date (END) and the Begin Date (EFTB) if the case is closed. The system uses this in the Case Aging report.
-
Case Age 0-1 Days
Depending on the value in the Case Age in Days column, the system uses "1" if the case age falls in this range and "0" if it does not. The system uses this in the Case Aging report.
-
Case Age 2-7 Days
Depending on the value in the Case Age in Days column, the system uses "1" if the case age falls in this range and "0" if it does not. The system uses this in the Case Aging report.
-
Case Age 8-30 Days
Depending on the value in the Case Age in Days column, the system uses "1" if the case age falls in this range and "0" if it does not. The system uses this in the Case Aging report.
-
Case Age>30 Days
Depending on the value in the Case Age in Days column, the system uses "1" if the case age falls in this range and "0" if it does not. The system uses this in the Case Aging report.
-
Case Record Type
Cases are open, cancelled, or closed based on the values that you set in the processing options. Open cases are those that are neither closed nor cancelled. The system uses this in all five reports.
-
Case Days Completed
This is applicable only when the value of the Case Record Type = Closed. This is the number of days of Ending Date (END) minus Commit Date (CDATE). The system uses this in the Case Commitment Results report.
-
Case Commitment Met
This is applicable only when the value of the Case Record Type = Closed. If the value of the Case Days Completed is "0" or is a negative value, the case was closed early or on-time and the system indicates this with a value of "1". Else, the system uses "0" to indicate that the case was closed late. The system uses this in the Case Commitment Results report.
-
Case Commitment Up To 1 Month Late
This is applicable only when the value of the Case Record Type = Closed. If the value of the Case Days Completed is 1 through 30, the case was closed late by a month or less than a month and the system indicates this with a value of "1". Else, the system uses "0" to indicate that the case was closed after a month. The system uses this in the Case Commitment Results report.
-
Case Commitment >1 Month Late
This is applicable only when the value of the Case Record Type = Closed. If the value of the Case Days Completed is greater than "30", the case was closed late by more than a month and the system indicates this with a value of "1". Else, the system uses "0" to indicate that the case was closed within a month. The system uses this in the Case Commitment Results report.
-
Case Timeliness N/A
This is applicable for cases that fulfil any of the conditions below:
-
Case is not closed (based on the value in the Case Record Type).
-
Case has blank Ending Date (END) and blank Commit Date (CDATE) values.
-
Case has blank Ending Date (END) or blank Commit Date (CDATE) values.
The system assigns "1" to cases that meet any of these conditions. Else, the system assigns "0". The system uses this in the Case Commitment Results report.
-
-
Entitled Case
This is applicable for both open and closed cases and indicates if a case is entitled. If the value in the Entitlement Check (ENTCK) field is equal to 1, 2, 3, or 4, the system assigns "1" in this column to indicate that the case is entitled. Else, the system assigns "0" to indicate that it is not. The system uses this in the Case Statistics report.
-
Escalated Case
This is applicable for both open and closed cases and indicates if a case has been escalated. If the value in either the ESC1 or the ESC2 field is greater than 1, the system assigns "1" in this column to indicate that the case has been escalated. Else, the system assigns "0" to indicate that it has not been escalated. The system uses this in the Case Statistics report.
-
Overdue Case
This indicates if a case is overdue. For open cases, if today's date is greater than the Commit Date (CDATE), the system assigns "1" in this column to indicate that the case is overdue. For closed cases, if the Ending Date (END) field is greater than the value in the Commit Date (CDATE) field, the system assigns "1" to indicate that the case is overdue. If a case is not overdue, the system assigns "0" in this column. The system uses this in the Overdue Open Cases report.
-
Days Overdue
This is applicable for overdue cases and indicates the number of days overdue. For open cases that are overdue (based on the value in the Overdue Case field), the system subtracts the Commit Date (CDATE) from today's date and assigns the difference in this column. For closed cases, the system subtracts the Commit Date (CDATE) from the Ending date (END) and assigns the difference in this column. If a case is not overdue, the system assigns "0" in this column. The system uses this in the Overdue Open Cases report.
-
Incoming Case Period
This indicates the period (P1 through P13) that the case falls in based on the Begin Date (EFTB) and today's date. A case may not fall in any of the 13 periods if the case begin date is either before Period 1 or after Period 13. You define period as days, weeks, or months in the header. The system uses this in the Case Load report.
-
Incoming Load Period (1-13, a column for each period)
The values in the columns from 1-13 indicate if the case falls in that period. The system assigns "1" in a column to indicate that the case falls in that period and "0" to indicate that it does not. The system uses these in the Case Load report.
-
Committed Case Period
This indicates the period that the case falls in based on the Commit Date (CDATE) and today's date (values are P1 - P13) fields. A case may not fall in any of the 13 periods if the case commit date is either before Period 1 or after Period 13. You define period as days, weeks, or months in the header. The system uses this in the Case Load report.
-
Committed Load Period (1-13, a column for each period)
The values in the columns from 1-13 indicate if the case falls in that period. The system assigns "1" in a column to indicate that the case falls in that period and a value of "0" to indicate that it does not. The system uses these in the Case Load report.
-
Closed Case Period
This indicates the period that the case falls in based on the Ending Date (END) and today's date (values are P1 - P13) fields. A case may not fall in any of the 13 periods if the case commit date is either before Period 1 or after Period 13. You define period as days, weeks, or months in the header. The system uses this in the Case Load report.
-
Closed Load Period (1-13, a column for each period)
The values in the columns from 1-13 indicate if the case falls in that period. A value of "1" in a column indicates that the case falls in that period and a value of "0" indicates that it does not. The system uses these in the Case Load report.
-
Status Type of Selected Cases
The system uses the value in this column internally in all five reports to know which header check boxes are selected. The value is the same for all cases.
-
Period Type to Analyze
The system uses the value in this column internally in the Case Load report to know which period type (days, weeks, or months) to use to analyze data. The value is the same for all cases.
16.1.3 Reports
The reports delivered with the One View Case Management Inquiry application are:
-
Case Aging
-
Case Commitment Results
-
Case Load
-
Overdue Open Cases
-
Case Statistics
All five reports use a list at the top based on case priority that you can use to filter data when you run reports in interactive mode.
16.1.3.1 Case Aging
This report enables you to analyze the age of cases for both open and closed cases. For open cases, it is the number of days between today and the case begin date. For closed cases, it is the number of days between the case ending date and the case begin date. This report includes both open and closed cases.
The system calculates case age in days and categorizes it into four buckets: 0-1 day old, 2-7 days old, 8-30 days old, and greater than 30 days old.
This report contains the following components:
-
Case Age Distribution By Case Type (horizontal bar graph)
-
Case Age Distribution By Assignee (horizontal bar graph)
-
Case Age Distribution By Provider Group (horizontal bar graph)
-
Average Case Age By Case Type (horizontal bar graph)
-
Average Case Age By Assignee (Top 10) (horizontal bar graph)
-
Average Case Age by Provider Group (Top 10) (horizontal bar graph)
-
Case Age Distribution (pie chart)
-
Average Case Age by Days (gauge)
-
Top 10 Oldest Open Cases (horizontal bar graph)
-
Case Age (By Provider Group, Assignee, Case Type) (table)
-
Reference tables with Case Type, Assignee, and Provider Group descriptions
16.1.3.2 Commitment Results
This report enables you to analyze how timely cases were closed relative to when they were committed to be resolved. You analyze cases for the number of days they were closed ahead of or after they were committed to be resolved. This report includes only closed cases.
The system categorizes case commitment results into four buckets: commitment met (closed early or on time), up to one month late, more than one month late, or timeliness N/A (cases that are not yet closed or have missing values for either of the dates used to determine this).
This report contains the following components:
-
Average Number of Days Cases Closed Early or Late By Case Type (horizontal bar graph)
-
Average Number of Days Cases Closed Early or Late By Assignee (Top 10) (horizontal bar graph)
-
Average Number of Days Cases Closed Early or Late By Provider Group (Top 10) (horizontal bar graph)
-
Case Commitment By Case Type (horizontal bar graph)
-
Case Commitment By Assignee (horizontal bar graph)
-
Case Commitment By Provider Group (horizontal bar graph)
-
Average Days Early or Late (gauge)
-
Closed Cases Commitment Results (pie chart)
-
Commitment Results for Closed Cases (By Provider Group, Assignee, Case Type) (table)
-
Reference tables with Case Type, Assignee, and Provider Group descriptions
16.1.3.3 Case Load
This report enables you to analyze the rate at which cases are opened, committed, and closed. This is useful to determine if a backlog is developing, if case reassignment is necessary, or reevaluate service levels. The system determines the incoming case load using the case begin date; the committed case load using the commit date; and the closed case load using the ending date. This report includes both open and closed cases.
The report provides an analysis of this information across the last 13 periods. You can define periods as days, weeks, or months. Today always falls in Period 13. So, today is Day 13, Week 13, or Month 13. Period 1 is the oldest period that you can analyze (13 days ago, 13 weeks ago, or 13 months ago).
This report contains the following components:
-
Incoming Case Load per Period (line graph)
-
Committed Case Load per Period (line graph)
-
Closed Case Load per Period (line graph)
-
Average Case Load per Period By Case Type (horizontal bar graph)
-
Average Case Load per Period By Assignee (Top 5) (horizontal bar graph)
-
Average Case Load per Period By Provider Group (Top 5) (horizontal bar graph)
-
Average Case Load for all Cases (horizontal bar graph)
-
Total Number of Cases (Incoming, Committed, Closed) (horizontal bar graph)
-
Incoming Case Load for the Past 13 Periods (By Provider Group, Assignee, Case Type) (table)
-
Committed Case Load for the Past 13 Periods (By Provider Group, Assignee, Case Type) (table)
-
Closed Case Load for the Past 13 Periods (By Provider Group, Assignee, Case Type) (table)
-
Reference tables with Case Type, Assignee, and Provider Group descriptions
16.1.3.4 Overdue Open Cases
This report enables you to analyze open cases to determine if they are overdue as of today. This report includes only open cases. This report enables you to analyze cases by case types, assignees, and provider groups to compare average days overdue.
This report contains the following components:
-
Average Days Overdue for Open Cases By Case Type (horizontal bar graph)
-
Average Days Overdue for Open Cases By Assignee (Top 10) (horizontal bar graph)
-
Average Days Overdue for Open Cases By Provider Group (Top 10) (horizontal bar graph)
-
Overdue Open Cases By Case Type (horizontal bar graph)
-
Overdue Open Case By Assignee (Top 10) (horizontal bar graph)
-
Overdue Open Cases By Provider Group (Top 10) (horizontal bar graph)
-
Overdue Open Cases (pie chart)
-
Top 10 Overdue Open Cases (horizontal bar graph)
-
Overdue Open Cases (By Provider Group, Assignee, Case Type) (table)
-
Reference tables with Case Type, Assignee, and Provider Group descriptions
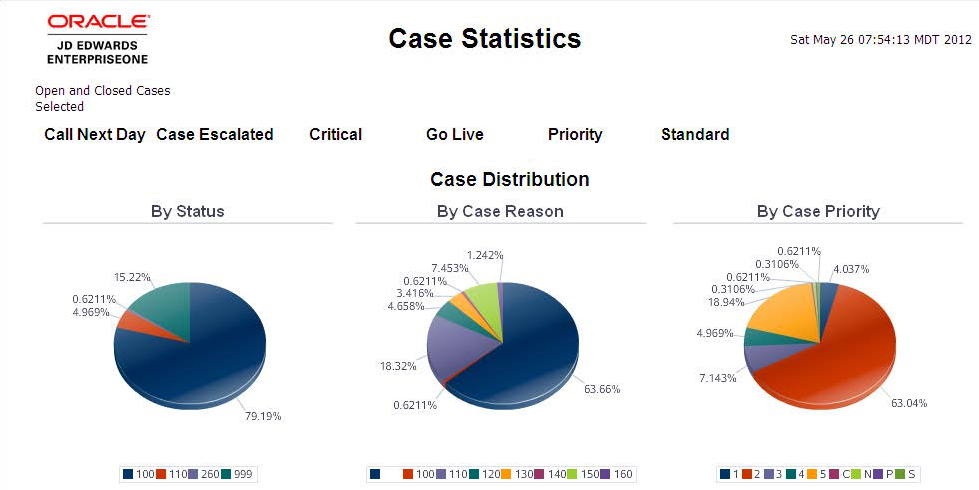
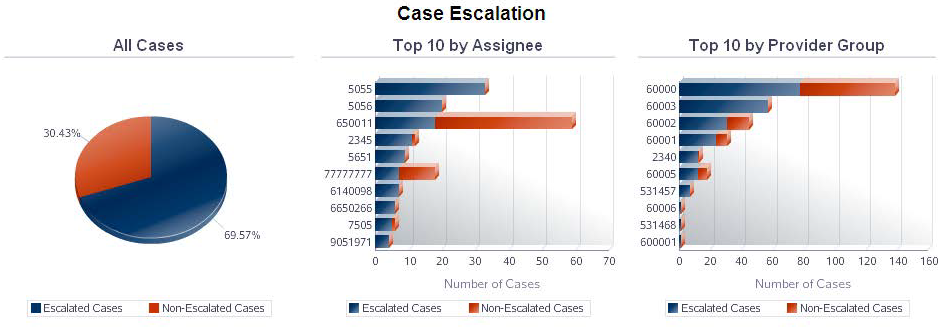
16.1.3.5 Case Statistics
This report enables you to analyze cases on a variety of key metrics. Metrics include distribution of cases by different attributes; different case types; case escalation; cases by inventory items, product families and customers; and case entitlement. This report includes both open and closed cases.
This report contains the following components:
-
Case Distribution By Status (pie chart)
-
Case Distribution By Case Reason (pie chart)
-
Case Distribution By Case Priority (pie chart)
-
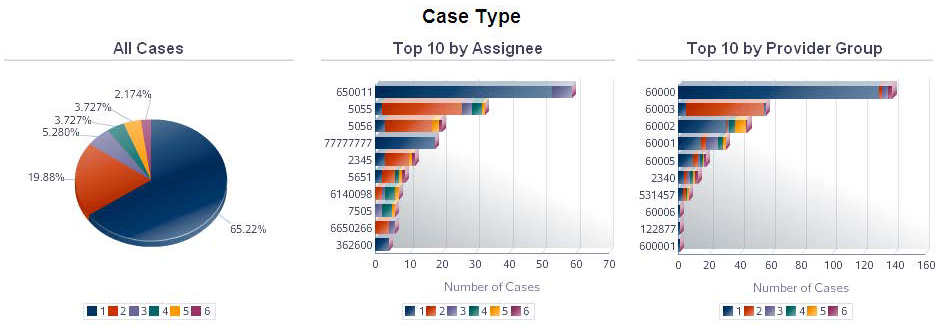
Case Type for All Cases (pie chart)
-
Case Type - Top 10 by Assignee (horizontal bar graph)
-
Case Type - Top 10 by Provider Group (horizontal bar graph)
-
Case Escalation for All Cases (pie chart)
-
Case Escalation - Top 10 by Assignee (horizontal bar graph)
-
Case Escalation - Top 10 by Provider Group (horizontal bar graph)
-
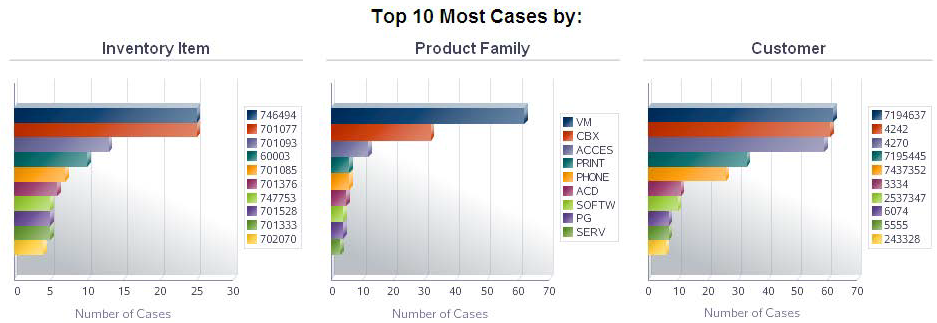
Top 10 Most Cases by Inventory Item (horizontal bar graph)
-
Top 10 Most Cases by Product Family (horizontal bar graph)
-
Top 10 Most Cases by Customer (horizontal bar graph)
-
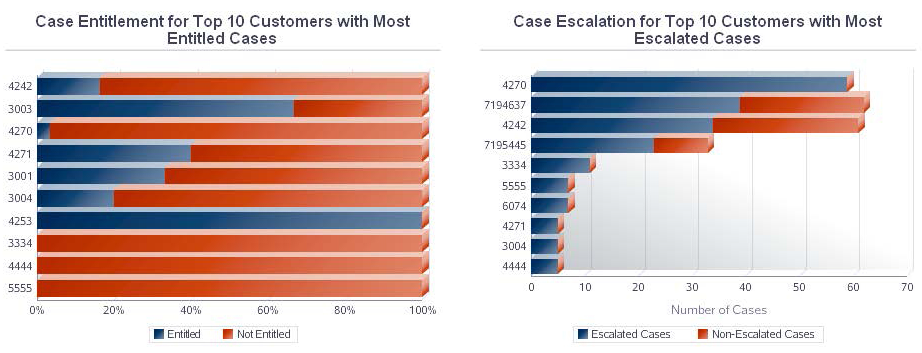
Case Entitlement for Top 10 Customers with Most Entitled Cases (horizontal bar graph)
-
Case Escalation for Top 10 Customers with Most Escalated Cases (horizontal bar graph)
-
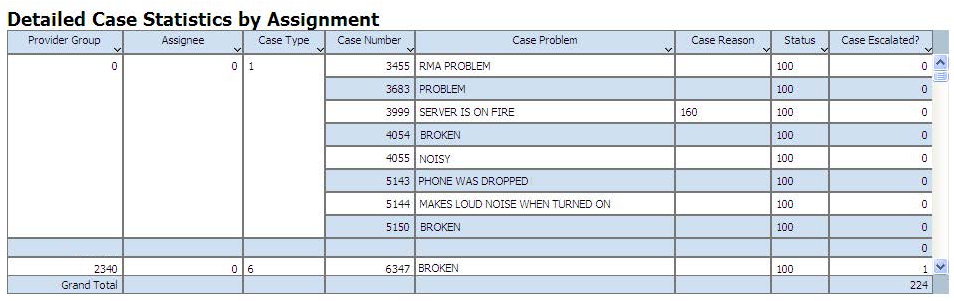
Detailed Case Statistics by Assignment (table)
-
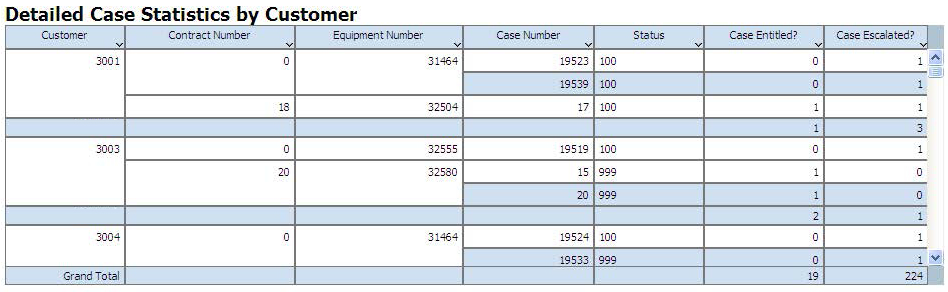
Detailed Case Statistics by Customer (table)
-
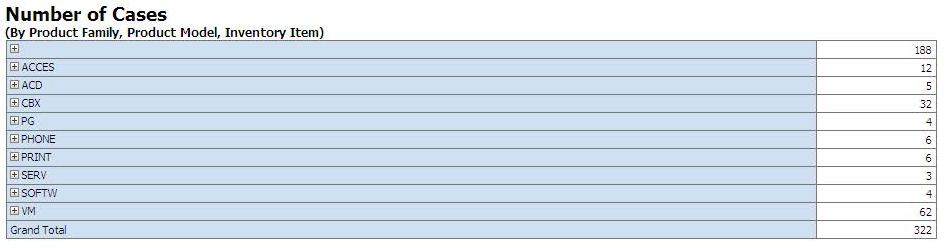
Number of Cases (By Product Family, Product Model, Inventory Item) (table)
-
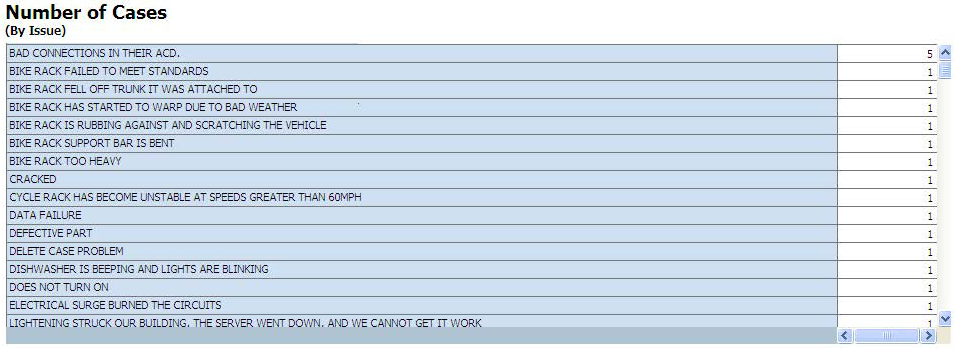
Number of Cases (By Issue)
-
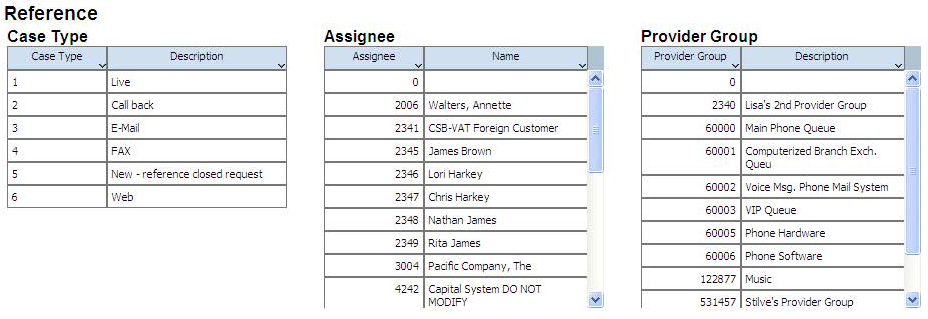
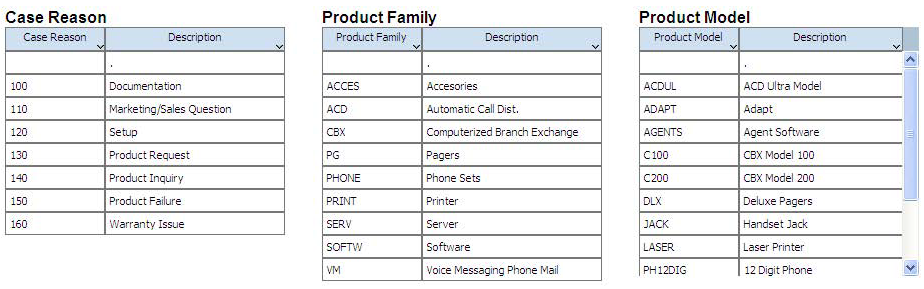
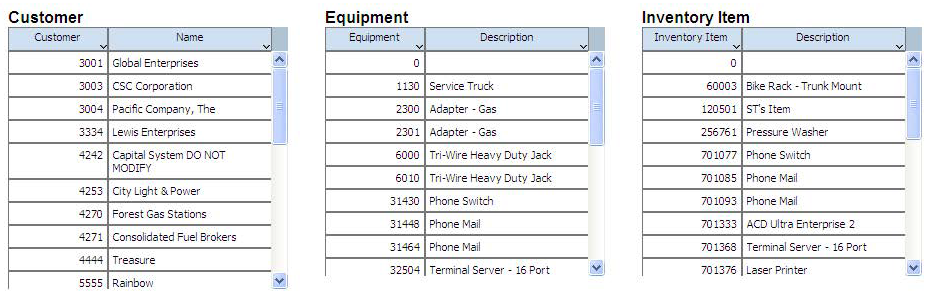
Reference tables with Case Type, Assignee, Provider Group, Case Reason, Product Family, Product Model, Customer, Equipment, and Inventory Item descriptions
This report contains drill back functionality as described in the following table:
| Functionality | Value |
|---|---|
| Table column containing drill back link | Case Number |
| Table columns passed to application | Case Number |
| Application called | Case Update (P90CG501) |
| Form called | W90CG501J |
| Version called | ZJDE0001 |
The following report was generated by selecting both "Include Open" and "Include Closed" options in the application header.
16.2 One View Service Contract Inquiry (P1727)
Access the One View Service Contract Inquiry application (P1727) from the Daily Contract Processing (G1714) menu. Use the One View Service Contract Inquiry to analyze contracts for such measures as expired or expiring contracts, contracts by customers, contracts by inventory items, and contracts by equipment. One View Service Contract Inquiry uses the Service Contract for OVR business view (V17210), which includes columns from the Contract Header (F1720) and the Contract Detail tables (F1721). You can use this application to analyze your contracts in many ways. Choose from over 200 columns in the business view and from numerous calculated columns in the grid that relate to additional contract analysis information useful in analyzing contracts. The information in these calculated columns does not exist elsewhere in JD Edwards EnterpriseOne because these are pulled together by the application. In addition to four reports delivered with the application, you can use this application to create reports for many business purposes. You can use the associated descriptions provided in the grid for assistance when developing custom reports.
One View Service Contract Inquiry is delivered with four pre-defined reports. These reports include Expired - Expiring Contracts, Contracts by Inventory, Contracts by Equipment, and Contracts by Customers. With these delivered reports, you can analyze key case metrics, such as contracts that are about to expire or have recently expired, which customers have the maximum number of contracts, top ten inventory items covered by contracts, and which equipment contracts generate maximum revenue.
16.2.1 Processing Options
Processing options enable you to specify the default processing for programs and reports.
16.2.1.1 Defaults
- 1. As If Currency Code
-
Specify the currency code that the system uses as default in the "As If Currency" field in the header of the One View Service Contract Inquiry form. The system uses this value to calculate As If currency amounts. You can leave this processing option blank and enter the code in the "As If Currency" field in the header of the One View Service Contract Inquiry form. You can also override the value that you entered in this processing option in the One View Service Contract Inquiry form.
The system calculates and displays the As If Amounts using the currency code in the As If Currency field and the exchange rate that the system retrieves using the value in the As of Date field.
If you leave the As If Currency field blank in the One View Service Contract Inquiry form, the system does not calculate As If Amounts and hides the As If Amount grid columns.
- 2. As of Date
-
Specify the date that the system uses to retrieve the exchange rate between the As If currency and the domestic currency. If you leave this processing option blank, the system uses the system date.
16.2.2 Special Processing
The One View Service Contract Inquiry application uses special processing in the header options and fields and in the calculated columns in the grid.
16.2.2.1 Special Processing in the Header
The One View Service Contract Inquiry application uses the following special processing in these header options and fields:
-
Include Cancelled Lines and Include Suspended Lines
You select the Include Cancelled Lines option to include information for cancelled contracts in the report. Contracts that do not have a blank value in the CN CD grid column are cancelled contracts. You specify the value for the CN CD grid column from the Cancellation Reason Code UDC table (17/CN).
You select the Include Suspended Lines option to include information for suspended contracts in the report. Contracts that do not have a blank value in the Bill Suspend Flag grid column are suspended contracts. You specify the value for the Bill Suspend Flag grid column from the Bill Suspend Reason Code UDC table (17/BS).
When you select the options for suspended and cancelled contracts, the search results will include these contracts along with other contracts unless you specifically filter for only these conditions. To report over only cancelled or suspended contracts, you can use the Query By Example (QBE) line to filter for these conditions or use the Advanced Query feature.
-
Days Past, Days Ahead, and Days to Analyze
You can define a time period to view contracts that have recently expired or are set to expire soon. Select the Days Past option to view contracts that have recently expired and enter the number of days you want to look back in the Days to Analyze field. For example, to view contracts that have expired within the last 30 days, select the Days Past option and enter "30" in the Days to Analyze field. The system includes the contracts that have expired within the last 30 days in the grid and these expired contracts have a value of "1" in the grid column Expired Contract.
To view contracts that are set to expire soon, select the Days Ahead option and enter the number of days counting from today to the day that you want to look up in the Days to Analyze field. The system considers today as the first day of the days ahead. The system includes the contracts that are set to expire according to your criteria in the header fields with a value of "1" in the Expiring Contract grid column.
If you select both Days Past and Days Ahead options, the system displays contracts that have recently expired and contracts that are set to expire in the grid. You can enter any number between (and including) zero and 366 in the Days to Analyze field.
When you select the options for expired and expiring contracts, the search results will include these contracts along with other contracts unless you specifically filter for only these conditions. The system includes only the contracts identified as expired or expiring in the Expired - Expiring Contracts Report.
-
As If Currency and As of Date
The One View Service Contract Inquiry application can report on contract amounts in a common currency. You can use the As If Currency and As of Date fields to convert contract amounts from domestic currency to a common currency. The system converts and subsequently populates the As If columns in the grid only if the As If Currency Code field has a valid value. The system uses the As of Date field to get the exchange rate to do the conversion. The As If Currency and As of Date fields are not filters for the grid column. If you are not using these fields, the conversion will not take place and the "As If" columns will not appear in the grid. You can convert four contract amounts to a common currency. These are Total Dollars, Daily Amortization Amount, Annualized Contract Amount, and Recurring Billing Amount.
The system enables you to compare contracts that are billed with different periodicity (monthly, quarterly, or annually) using the Annualized Contract Amount column. Special processing in this column multiplies the value in the Daily Amortization Amount column by 365 and converts it to an annualized amount, which enables you to compare all contracts assuming each contract lasted a year.
16.2.2.2 Special Processing in the Calculated Grid Columns
The system records information in the grid columns that is related to the special processing considerations in the header. These columns facilitate reporting over data that is not available in the database in a form easy to report on. The reports delivered with the application are possible because of these columns. You can also use them when defining custom reports.
The One View Service Contract Inquiry application uses the following special processing in these calculated columns in the grid:
-
Date Analyze From
This is the starting date that the system uses to analyze expired contracts. The system determines this date based on today's date, the value in the Days to Analyze field, and whether the Days Past option is selected. For example, if you select the Days Past option to analyze contracts that have expired in the last ten days, the value in this column is today's date minus ten.
-
Date Analyze Through
This is the ending date that the system uses to analyze expiring contracts. The system determines this date based on today's date, the value in the Days to Analyze field, and whether the Days Ahead option is selected. The system considers today as the first day of the days ahead. For example, if you select the Days Ahead option to analyze contracts expiring in the next ten days, this date is today's date plus ten minus one (or today's date plus nine).
-
Expired Contract
You select the Days Past option and use the value in the Days to Analyze field in the header to filter information for expired contracts in the grid. The system assigns "1" in this column to indicate that this is an expired contract that you can analyze.
-
Expiring Contract
You select the Days Ahead option and use the value in the Days to Analyze field in the header to filter information for expiring contracts in the grid. The system assigns "1" in this column to indicate that this is an expiring contract that you can analyze.
-
Days to Analyze
This represents the number of days that the system uses to look back or look ahead when building the date range to include either or both expired and expiring contracts for analysis. The system populates this column with the value from the Days to Analyze field in the header.
-
Days Past
A value of "1" in this column indicates that the contract has expired. You can select the Days Past option and use the Days to Analyze field in the header to filter information for contracts that have expired in the last number of days entered in the Days to Analyze field.
-
Days Ahead
A value of "1" in this column indicates that the contract is set to expire. You can select the Days Ahead option and use the Days to Analyze field in the header to filter information for contracts that are expiring from today to the number of days in the future entered in the Days to Analyze field. The system considers today as the first day of the days ahead. For example, if you have selected the Days Ahead header option and set the Days to Analyze to seven, the system includes contracts that are expiring today and contracts that will expire in the next six days in the grid.
-
As If Total Dollars
The system uses this amount to calculate average days to pay. This amount is equal to the sum of cash received against valid accounts receivable invoices. The system calculates and displays the As If Total Dollars amount in a common currency using the currency code in the As If Currency field and the exchange rate that the system retrieves using the value in the As of Date field. The system updates the Total Dollars amount at the same time that you update the Weighted Days total.
-
As If Daily Amortization Amount
This is the daily amortization amount and is the contract amount divided by the number of days in the contract. The system calculates and displays the As If Daily Amortization Amount in a common currency using the currency code in the As If Currency field and the exchange rate that the system retrieves using the value in the As of Date field.
-
Annualized Contract Amount
This is the daily amortization contract amount multiplied by 365.
-
As If Annualized Contract Amount
This is the daily amortization contract amount multiplied by 365. The system calculates and displays the As If Annualized Contract Amount in a common currency using the currency code in the As If Currency field and the exchange rate that the system retrieves using the value in the As of Date field.
-
As If Recurring Billing Amount
This is the fixed amount that you want to bill with each recurring frequency. The system calculates and displays the As If Recurring Billing Amount in a common currency using the currency code in the As If Currency field and the exchange rate that the system retrieves using the value in the As of Date field.
-
Type of Contracts Included
The system uses this grid column to indicate the type of contracts that you have included to analyze. Values can be Cancelled, Suspended, Both, or None.
16.2.3 Reports
The reports delivered with the One View Service Contract Inquiry application are:
-
Expired - Expiring Contracts
-
Contracts by Inventory
-
Contracts by Equipment
-
Contracts by Customers
All four reports use a list at the top based on Line Type and Service Package that you can use to filter data when you run reports in interactive mode.
16.2.3.1 Expired - Expiring Contracts
This report enables you to analyze contracts that have recently expired or are set to expire as defined in the fields of the application header. The system includes only expired and expiring contracts in this report.
This report contains the following components:
-
Expired Contracts By Line Type (pie chart)
-
Expired Contracts By Service Package (pie chart)
-
Expired Contracts By Contract Type (pie chart)
-
Daily Amortization Amount by Line Type for Expired Contracts (horizontal bar graph)
-
Annualized Amount by Service Package for Expired Contracts (horizontal bar graph)
-
Contract Amount by Contract Type for Expired Contracts (horizontal bar graph)
-
Expired Contracts (table)
-
Expiring Contracts By Line Type (pie chart)
-
Expiring Contracts By Service Package (pie chart)
-
Expiring Contracts By Contract Type (pie chart)
-
Daily Amortization Amount by Line Type for Expiring Contracts (horizontal bar graph)
-
Annualized Amount by Service Package for Expiring Contracts (horizontal bar graph)
-
Contract Amount by Contract Type for Expiring Contracts (horizontal bar graph)
-
Expiring Contracts (table)
-
Reference tables with Customer, Site, Contract Type, and Service Package descriptions
16.2.3.2 Contracts by Inventory
This report enables you to analyze contracts for different inventory items. You can analyze contracts for different inventory items to compare the contract amounts and identify your top 10 product families, product models, and inventory items based on contract amounts. The system includes only the contracts that are associated with an inventory item in this report.
This report contains the following components:
-
Total Number of Contracts By Product Family (Top 10) (horizontal bar graph)
-
Total Number of Contracts By Product Model (Top 10) (horizontal bar graph)
-
Total Number of Contracts By Inventory Item (Top 10) (horizontal bar graph)
-
Total Number of Contracts By Line Type (pie chart)
-
Total Number of Contracts By Service Package (pie chart)
-
Total Contract Amount By Product Family (Top 10) (horizontal bar graph)
-
Total Contract Amount By Product Model (Top 10) (horizontal bar graph)
-
Total Contract Amount By Inventory Item (Top 10) (horizontal bar graph)
-
Total Annualized Amortization Contract Amount By Line Type (vertical bar graph)
-
Total Annualized Amortization Contract Amount By Service Package (vertical bar graph)
-
Inventory Contracts - Summary (table)
-
Inventory Contracts - Detail (table)
-
Reference tables with Product Family, Product Model, Inventory Item, and Service Package descriptions
16.2.3.3 Contracts by Equipment
This report enables you to analyze contracts for different equipment. You can analyze contracts for different equipment to compare the contract amounts and identify your top 10 product families, product models, and equipment based on contract amounts. Only the contracts that are associated with an equipment number are included in this report.
This report contains the following components:
-
Total Number of Contracts By Product Family (Top 10) (horizontal bar graph)
-
Total Number of Contracts By Product Model (Top 10) (horizontal bar graph)
-
Total Number of Contracts By Equipment Number (Top 10) (horizontal bar graph)
-
Total Number of Contracts By Line Type (pie chart)
-
Total Number of Contracts By Service Package (pie chart)
-
Total Contract Amount By Product Family (Top 10) (horizontal bar graph)
-
Total Contract Amount By Product Model (Top 10) (horizontal bar graph)
-
Total Contract Amount By Equipment Number (Top 10) (horizontal bar graph)
-
Total Annualized Amortization Contract Amount By Line Type (vertical bar graph)
-
Total Annualized Amortization Contract Amount By Service Package (vertical bar graph)
-
Equipment Contracts - Summary (table)
-
Equipment Contracts - Detail (table)
-
Reference tables with Product Family, Product Model, Equipment Number, and Service Package descriptions
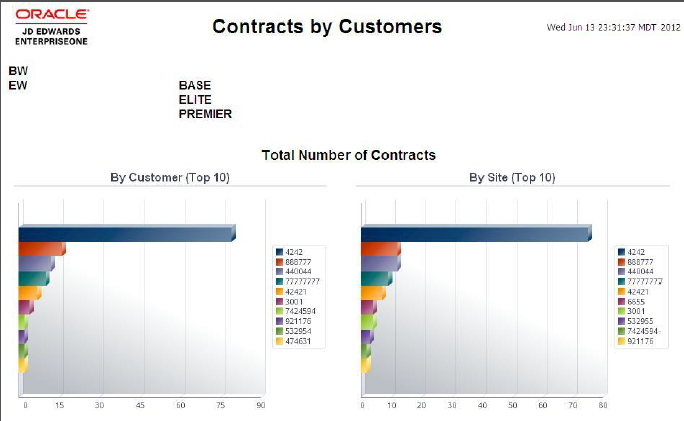
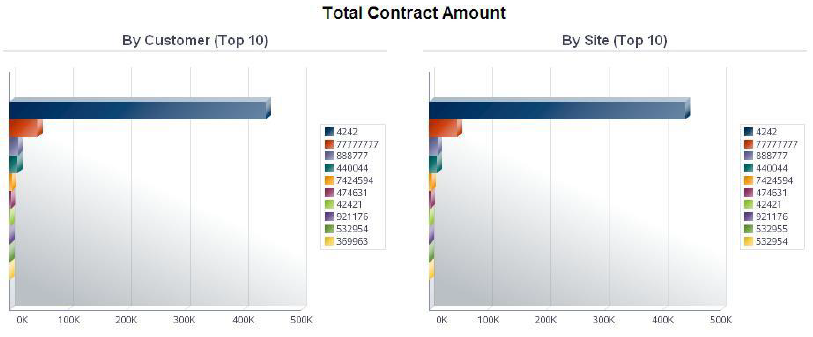
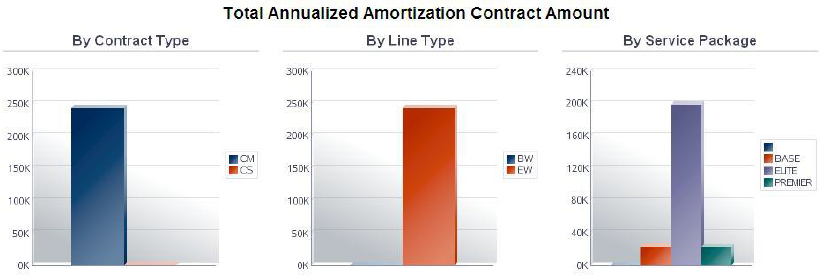
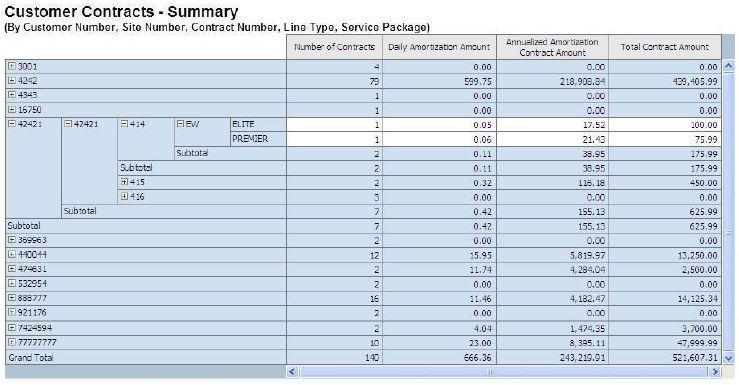
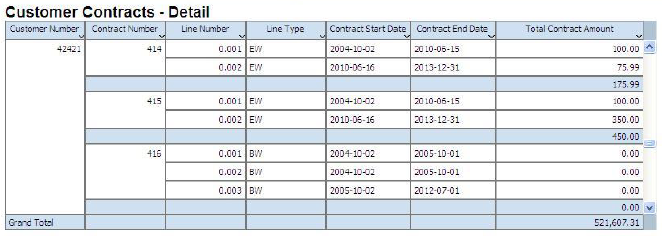
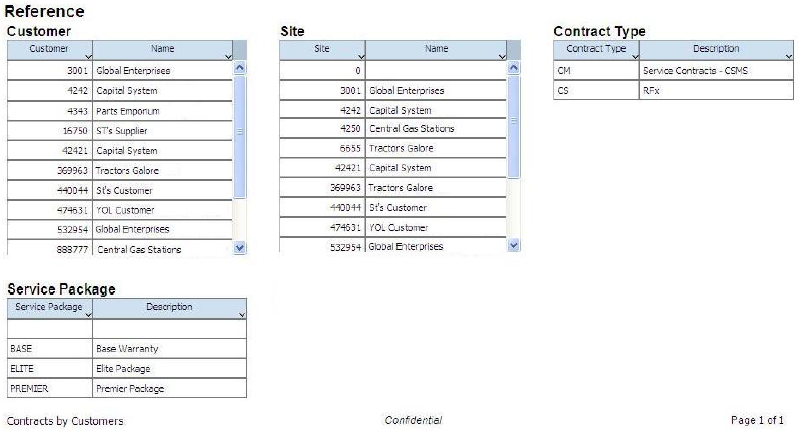
16.2.3.4 Contracts by Customers
This report enables you to analyze contracts for different customers. You can analyze contracts for each customer to compare contract amounts and identify your top 10 customers based on contract amounts. Only the contracts that are associated with a customer are included in this report.
This report contains the following components:
-
Total Number of Contracts By Customer (Top 10) (horizontal bar graph)
-
Total Number of Contracts By Site (Top 10) (horizontal bar graph)
-
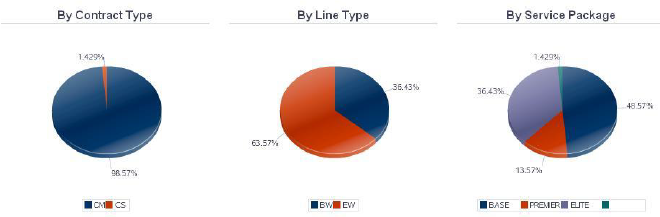
Total Number of Contracts By Contract Type (pie chart)
-
Total Number of Contracts By Line Type (pie chart)
-
Total Number of Contracts By Service Package (pie chart)
-
Total Contract Amount By Customer (Top 10) (horizontal bar graph)
-
Total Contract Amount By Site (Top 10) (horizontal bar graph)
-
Total Annualized Amortization Contract Amount By Contract Type (vertical bar graph)
-
Total Annualized Amortization Contract Amount By Line Type (vertical bar graph)
-
Total Annualized Amortization Contract Amount By Service Package (vertical bar graph)
-
Customer Contracts - Summary (table)
-
Customer Contracts - Detail (table)
-
Reference tables with Customer, Site, Contract Type, and Service Package descriptions
16.3 One View Service Contract Profitability Inquiry (P1730)
Access the One View Service Contract Profitability Inquiry application (P1730) from the Periodic Contract Processing (G1724) menu. Use the One View Service Contract Profitability Inquiry to analyze the profitability of your service contracts. Profitability is the analysis of the revenue, credits, and costs associated with a service contract. These come from contract billings, work order billings, and work order costs for equipment covered by a service contract. One View Service Contract Profitability Inquiry uses the One View Service Contract Profitability Inquiry business view (V1730A), which includes columns from the Contract Detail table (F1721). You can use this application to analyze how profitable your contracts have been. Choose from over 130 columns in the business view and from numerous calculated columns in the grid that relate to additional contract profitability analysis information useful in analyzing contract profitability. The information in these calculated columns does not exist elsewhere in JD Edwards EnterpriseOne because these are pulled together by the application. In addition to a report delivered with the application, you can use this application to create reports for many business purposes. You can use the associated descriptions provided in the grid for assistance when developing custom reports.
One View Service Contract Profitability Inquiry is delivered with a pre-defined report, which is the Service Contract Profitability report. With this delivered report, you can analyze key contract profitability metrics, such as total and average contract profitability, top five most profitable contracts, and profit by contract attributes, such as service package and contract type.
16.3.1 Processing Options
Processing options enable you to specify the default processing for programs and reports.
16.3.1.1 Defaults
- 1. As If Currency Code
-
Specify the currency code that the system uses as default in the "As If Currency" field in the header of the One View Service Contract Profitability Inquiry form. The system uses this value to calculate As If currency amounts. You can leave this processing option blank and enter the code in the "As If Currency" field in the header of the One View Service Contract Profitability Inquiry form. You can also override the value that you entered in this processing option in the One View Service Contract Profitability Inquiry form.
The system calculates and displays the As If Amounts using the currency code in the As If Currency field and the exchange rate that the system retrieves using the value in the As of Date field.
If you leave the As If Currency field blank in the One View Service Contract Profitability Inquiry form, the system does not calculate As If Amounts and hides the As If Amount grid columns.
- 2. As of Date
-
Specify the date that the system uses to retrieve the exchange rate between the As If currency and the domestic currency. If you leave this processing option blank, the system uses the system date.
16.3.2 Special Processing
The One View Service Contract Profitability Inquiry application uses special processing in the header options and fields and in the calculated columns in the grid.
16.3.2.1 Special Processing in the Header
The One View Service Contract Profitability Inquiry application uses the following special processing in these header options and fields:
-
Include Cancelled Lines and Include Suspended Lines
You select the Include Cancelled Lines option to include information for cancelled contracts in the report. Contracts that do not have a blank value in the CN CD grid column are cancelled contracts. You specify the value for the CN CD grid column from the Cancellation Reason Code UDC table (17/CN).
You select the Include Suspended Lines option to include information for suspended contracts in the report. Contracts that do not have a blank value in the Bill Suspend Flag grid column are suspended contracts. You specify the value for the Bill Suspend Flag grid column from the Bill Suspend Reason Code UDC table (17/BS).
When you select the options for suspended and cancelled contracts, the search results will include these contracts along with other contracts unless you specifically filter for only these conditions. To report over only cancelled or suspended contracts, you can use the Query By Example (QBE) line to filter for these conditions or use the Advanced Query feature.
-
As If Currency and As of Date
The One View Service Contract Profitability Inquiry application can report on contract amounts in a common currency. You can use the As If Currency and As of Date fields to convert contract amounts from domestic currency to a common currency. The system converts and subsequently populates the As If columns in the grid only if the As If Currency Code field has a valid value. The system uses the As of Date field to get the exchange rate to do the conversion. The As If Currency and As of Date fields are not filters for the grid column. If you are not using these fields, the conversion will not take place and the "As If" columns will not appear in the grid. You can convert six contract amounts to a common currency. These are Revenue Amount, Invoiced Amount, Actual Labor, Actual Material, Actual Other, and Actual Dollars.
16.3.2.2 Special Processing in the Calculated Grid Columns
The system retrieves information from several sources to identify the revenues and costs associated with service contracts. When this information is retrieved, the system writes a grid record for each service contract that does not have specific revenue or cost information. The report ignores these rows but they are necessary as part of the processing. A service contract is defined as the unique combination of Contract Number, Contract Change Number, and Line Number. The Profitability Factor Type and Profitability Factor Source columns are quick ways to identify non-informative rows from the ones used in the reports. These columns will not have any value for the rows that do not contain information.
The system records information in the grid columns that is related to the special processing considerations in the header. These columns facilitate reporting over data that is not available in the database in a form easy to report on. The report delivered with the application is possible because of these columns. You can also use them when defining custom reports.
The One View Service Contract Profitability Inquiry application uses the following special processing in these calculated columns in the grid:
-
Profitability Factor Type
Use this column to identify whether the grid row contains information that impacts profitability and if so, the type of profitability information that it contains. Revenue and Cost are the two types of profitability factors. A blank value in this column indicates that the grid row does not contain information that the system will use when determining profitability.
-
Profitability Factor Source
Use this column to identify the source of the amount included in the profitability calculation. Service Contracts and Service Work Orders are the two types of sources. A blank value in this column indicates that the grid row does not contain information that the system will use when determining profitability.
-
Type of Contracts Included
The value in this column indicates the type of contract that you have included for analysis. Values can be Cancelled, Suspended, Both, or None.
-
One View Common Summary
Special processing in this column ensures that a common value is shared across all grid records on One View Reporting applications. The system uses this column along with the BIP Editor for certain summary needs. This column is not meaningful by itself and the system assigns a value of blank to this column for each record in the grid.
-
As If Currency Code
The system populates this column with the currency code from the As If Currency field in the header. The system will not display this column if the As If Currency and As of Date fields in the header have a blank value.
-
As of Date
The system populates this column with the date from the As of Date field in the header. The system uses this date to get the exchange rate to convert amounts from domestic currency to a common currency. The system will not display this column if the As If Currency and the As of Date fields in the header have a blank value.
-
Revenue Amount
This is the revenue amount for the contract generated from service contract billing or service work order billing. The system retrieves this amount from the Billing Detail Workfile (F4812) and the Billing Workfile History (F4812H) tables. If the revenue amount comes from service contract billings, the system displays the net amount of all revenues and credits for all service contract billings for a contract in a single grid row. If the revenue amount comes from service work order billings, the system displays the net amount of all the parts and labor billing records related to each work order in individual grid rows and displays the work order number in the Work Order Number column. The system applies this special processing to all service work orders that are entitled against this contract and has billed revenue.
-
As If Revenue Amount
This is the revenue amount converted to a common currency. The system will not display this column if the As If Currency and the As of Date fields in the header have a blank value.
-
Invoiced Amount
This is the invoiced amount for the contract coming from the service contract billing or the service work order billing. The only difference between this column and the Revenue Amount column is that Invoiced Amount include taxes and Revenue Amount does not.
-
As If Invoiced Amount
This is the invoiced amount converted to a common currency. The system will not display this column if the As If Currency and the As of Date fields in the header have a blank value.
-
Actual Labor
This is the total labor cost associated with a service work order that is entitled against the contract. The system retrieves this amount from the Work Order Master table (F4801) and displays the labor costs for each service work order entitled against the contract in separate grid rows. The value in the Work Order Number column is the work order number associated with each service work order.
-
As If Actual Labor
This is the actual labor amount converted to a common currency. The system will not display this column if the As If Currency and the As of Date fields in the header have a blank value.
-
Actual Material
This is the total cost of material (parts) associated with a service work order that is entitled against the contract. The system retrieves this amount from the Work Order Master table (F4801) and displays the material cost for each service work order entitled against the contract in separate grid rows. The value in the Work Order Number column is the work order number associated with each service work order.
-
As If Actual Material
This is the actual material cost converted to a common currency. The system will not display this column if the As If Currency and the As of Date fields in the header have a blank value.
-
Actual Other
This is the total other cost associated with a service work order that is entitled against the contract. The system retrieves this amount from the Work Order Master table (F4801) and displays the other cost for each service work order entitled against the contract in separate grid rows. The value in the Work Order Number column is the work order number associated with each service work order.
-
As If Actual Other
This is the actual other cost converted to a common currency. The system will not display this column if the As If Currency and the As of Date fields in the header have a blank value.
-
Actual Dollars
This is the total costs (labor, material and other costs) associated with a service work order that is entitled against the contract. The system retrieves this amount from the Work Order Master table (F4801) and displays the total cost for each service work order entitled against the contract in separate grid rows. The value in the Work Order Number column is the work order number associated with each service work order.
-
As If Actual Dollars
This is the actual dollar amount converted to a common currency. The system will not display this column if the As If Currency and the As of Date fields in the header have a blank value.
-
Work Order Number
This column records the work order number for the service work order that is entitled against the contract and for which you want to analyze associated costs and revenues.
|
Note: The system retrieves revenue and costs for service contracts and service work orders and displays the information in the grid. For revenue billed against a service contract, the system nets the amount for all revenue and credits and displays it in a single grid row. For revenue and cost coming from service work order billings, the system the system uses a grid row for each work order to display revenue from billing and a separate grid row to display cost from billing. To analyze total contract profitability, you must consider the revenue and costs from both service contracts and service work orders entitled against the contract. |
16.3.3 Reports
The report delivered with the One View Service Contract Profitability Inquiry application is the Service Contract Profitability report.
This report uses a list at the top based on Contract Type and Service Package that you can use to filter data when you run the report in interactive mode.
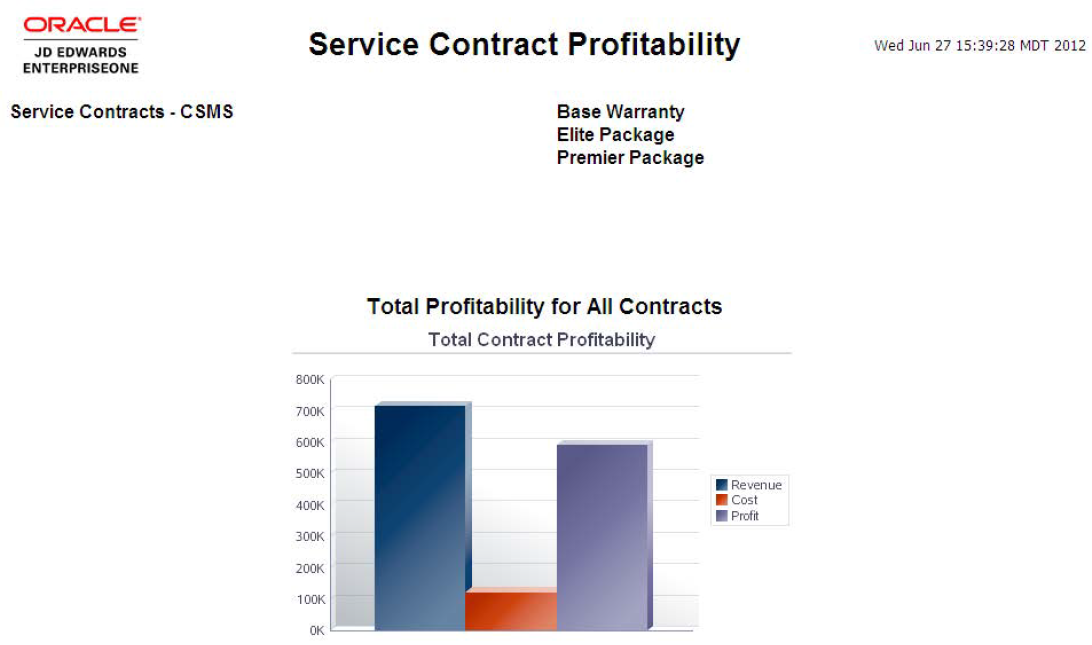
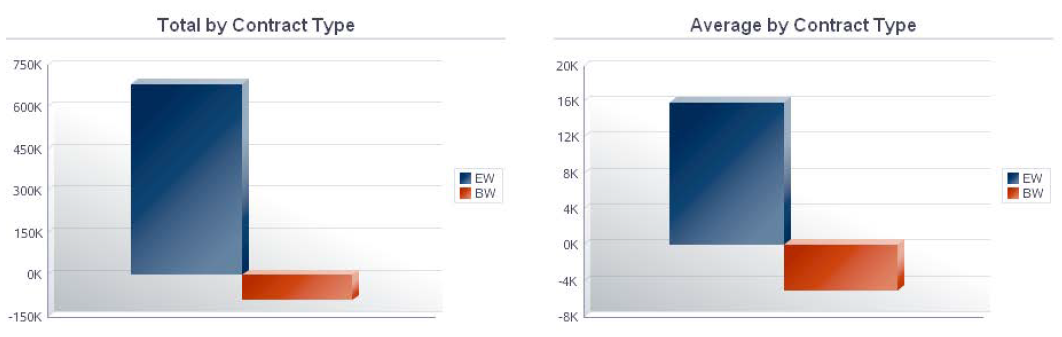
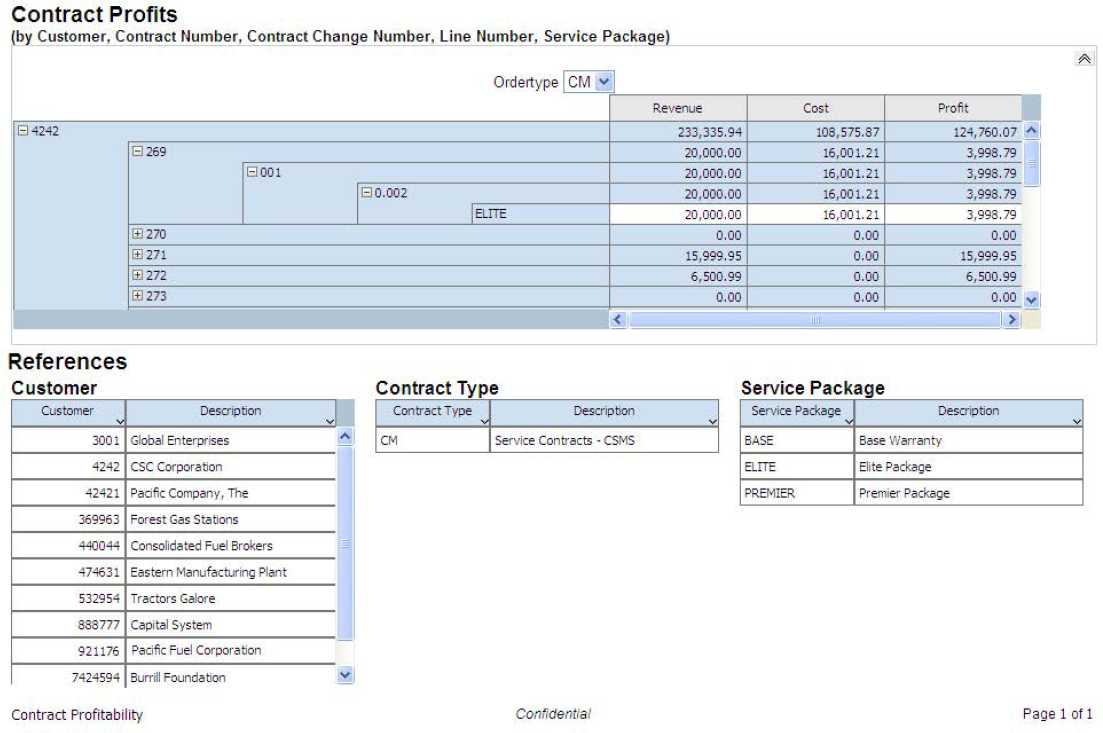
16.3.3.1 Service Contract Profitability
This report enables you to analyze the profitability of contracts.
This report contains the following components:
-
Total Contract Profitability (vertical bar graph)
-
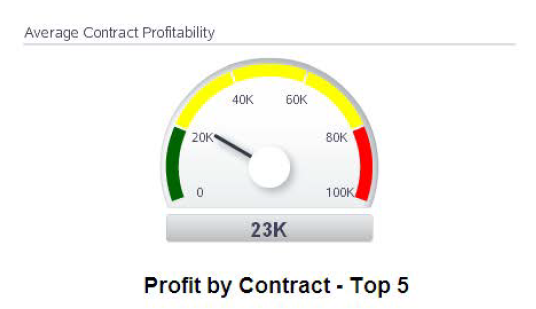
Average Contract Profitability (gauge)
-
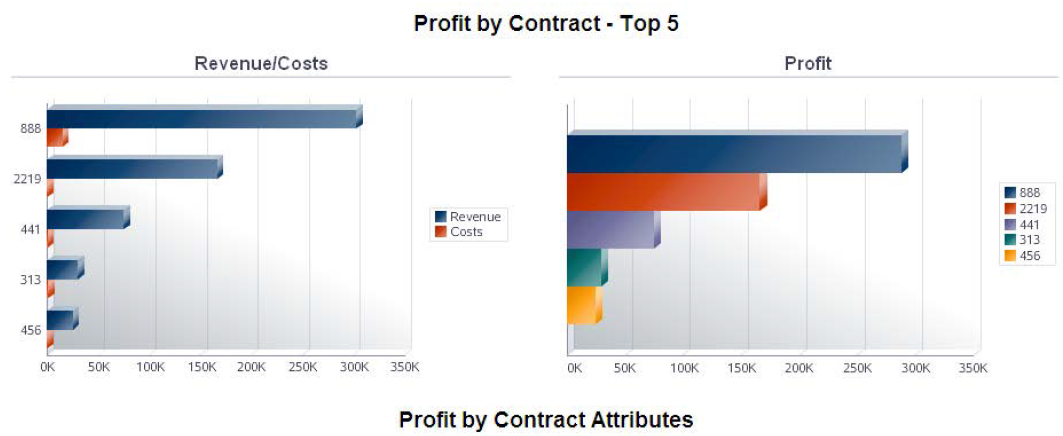
Profit by Contract - Top 5 - Revenue/Costs (horizontal bar graph)
-
Profit by Contract - Top 5 - Profit (horizontal bar graph)
-
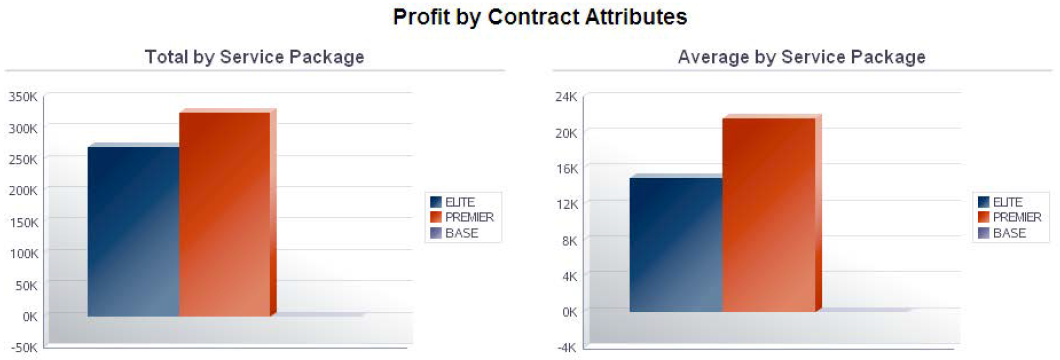
Profit by Contract Attributes - Total by Service Package (vertical bar graph)
-
Profit by Contract Attributes - Average by Service Package (vertical bar graph)
-
Profit by Contract Attributes - Total by Contract Type (vertical bar graph)
-
Profit by Contract Attributes - Average by Contract Type (vertical bar graph)
-
Contract Profits (repeating table section, repeats on Contract Type)
-
Reference tables with Customer, Contract Type and Service Package descriptions