6 Working with Supply Monitor
This chapter contains the following topics:
-
Section 6.2, "Working with Supply Monitor for Sales Order Lines"
-
Section 6.3, "Working with Supply Monitor for Sales Order Lines in Fulfillment Management"
6.1 Understanding Supply Monitor
Supply Monitor provides real-time access to inventory availability information during order entry. Chart views are available for each product on the sales order, as each one has its own demand and priority rank. Showing availability information during order entry gives customer service representatives visibility into the likelihood of the order being filled. Real-time insight into product availability and the potential to allocate inventory to sales order lines in regards to other sales demand enables proactive communication with customers to discuss the probably of product being shipped on time.
Supply Monitor works with the JD Edwards EnterpriseOne Fulfillment Management system to provide insight into the potential of allocating inventory to sales order lines in Fulfillment Management. Allocating inventory based on priority rank ensures that the highest priority orders are filled first, thus improving customer satisfaction.
6.2 Working with Supply Monitor for Sales Order Lines
This section provides an overview of supply monitor for sales order lines and discusses how to work with supply monitor for sales order lines.
6.2.1 Understanding Supply Monitor for Sales Order Lines
The Supply/Demand Chart program (P42X050) enables you to constantly monitor sales orders and view real-time information concerning the allocation of inventory to sales order lines. You must use the Sales Order Entry program (P42101) for sales order entry to access the Supply Monitor - Supply/Demand form (W42X050A). From the Sales Order Entry program, you can access the Supply Monitor - Supply/Demand form by clicking the icon that appears in the Supply Monitor field of the sales order detail line that is not marked as in fulfillment.
The system displays graphical information such as quantity available, quantity ordered, and scheduled pick date. A snapshot view of this information enables customer service representatives to communicate real-time information concerning the inventory available to allocate to the sales order line.
The information that you are viewing at the time of sales order entry or in update mode is a snapshot view of real-time item availability for the scheduled pick date.
The information is real-time and changes based on new and revised transactions. For example, today you might have enough inventory to completely fill the order line, but the scheduled pick date is two weeks away. Because of additional transactions and new demands, five days before the scheduled pick date, you may have only enough inventory to partially fill the order line.
In the case of a process failure such as sales order processing ending abnormally or closing a browser with an active session open, the system may not cleanup work files properly. You can run the Supply Monitor Chart Work File program (R42X060WP) to delete all work file records that are more than one day old. The Supply Monitor Chart Work File program purges records from the Supply Monitor Chart Work File table (F42X060W).
|
Note: The supply/demand information that the system displays is based on how you set up the processing options for the Supply and Demand Inquiry program (P4021) version that the Sales Order program executes. |
6.2.2 Working With Supply Monitor for Sales Order Lines
To work with supply monitor for sales order lines:
-
Access the Enter New Order form.
Form Name Form ID Navigation Enter New Order W42101D Sales Order Processing (G4211). Select Create Sales Order - Detail First.
On the Manage Existing Order form, click the Add button.
-
On the Enter New Order form, enter order header and detail information.
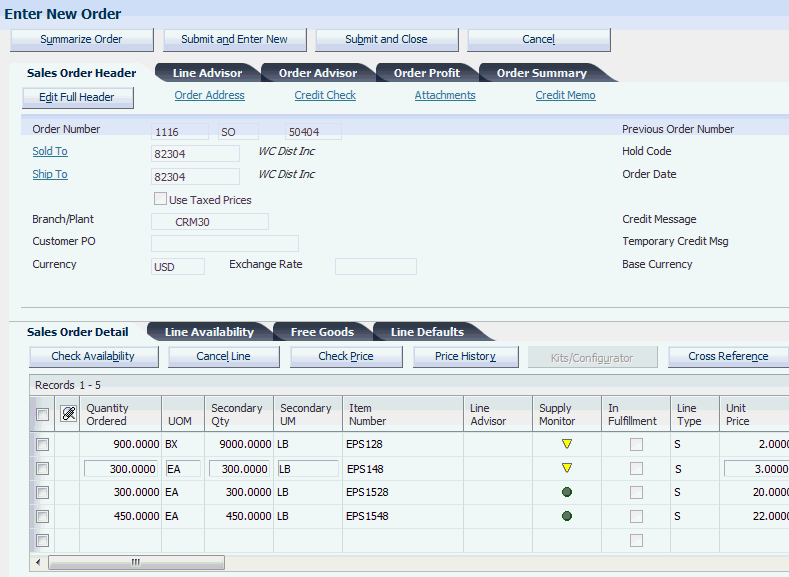
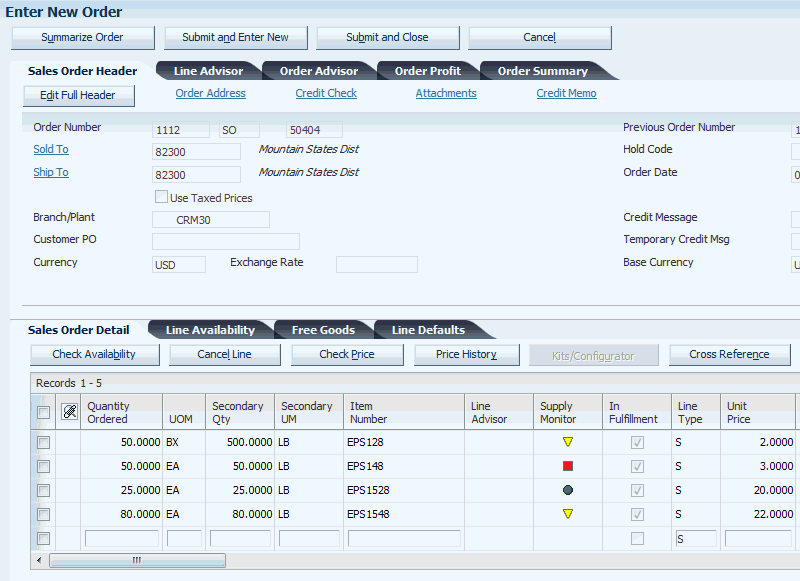
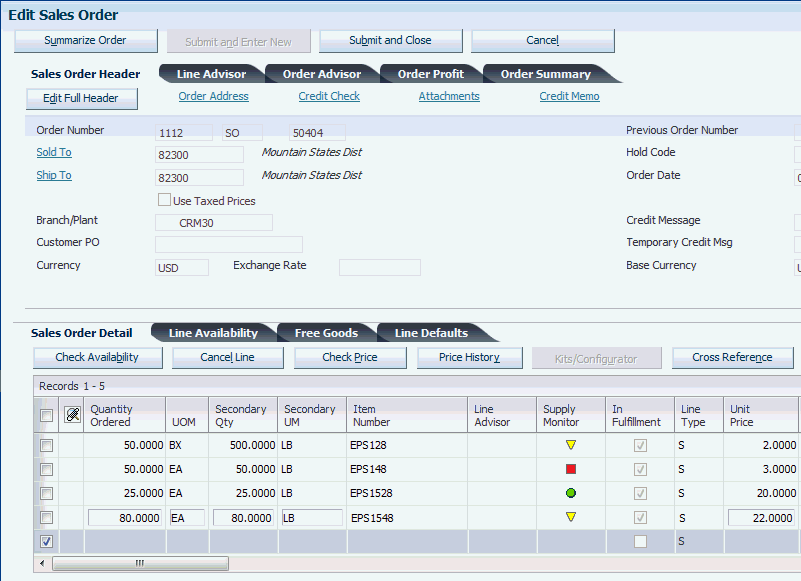
When you tab off the order line, the system displays a green, yellow, or red icon in the Supply Monitor field to indicate inventory availability:
-
The green icon (circle) indicates that there is enough availability to allocate inventory for the entire order line.
-
The yellow icon (inverted triangle) indicates that there is not enough inventory available to fill the entire order line. However, there is enough inventory to partially fill the order line.
-
The red icon (square) indicates there is no inventory available to allocate to the order line.
The system does not display an icon in the Supply Monitor field under the following circumstances:
-
The order line's order type, line type, and next status are not in the Supply/Demand inclusion rules.
-
The order line is a credit order.
-
The order line is for a non-stock item.
-
The order line is for an ETO parent item.
-
The order line is for a configured parent item.
-
The order line is for a kit parent item that does not generate a work order.
-
The order line is for an item that is a process.
-
The order line is for an item with a bulk stocking type and the Supply/Demand (P4021) processing options exclude bulk stocking type items.
-
The order line has been released from the Fulfillment Management system.
-
The order line is canceled.
-
The order line is for an order promising item.
-
Viewing the order line in change mode without modifying the line or selecting Evaluate Supply Monitor from the Row menu.
-
-
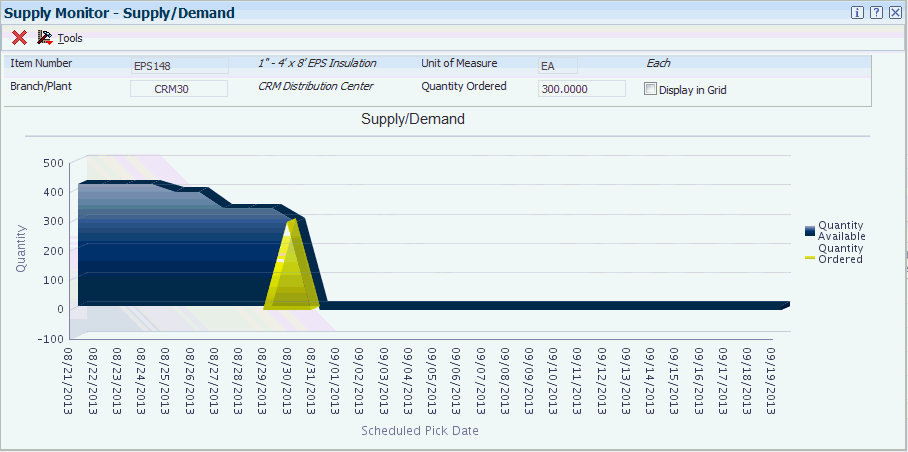
To display the Supply Monitor - Supply/Demand form, click the icon on a sales order line for which you want to see supply monitor information.
The chart displays the range of scheduled pick dates along the x-axis and the range of available Quantity along the y-axis. The blue area represents the total available quantity on the specified scheduled pick dates. In Figure 6-2 the available quantity remains the same from August 21st thru August 24st. Then on August 25th, the available quantity starts to decrease because there is quantity scheduled for picking on that date and subsequent dates. From August 31st thru September 19th, the blue area indicates that there is zero quantity available.
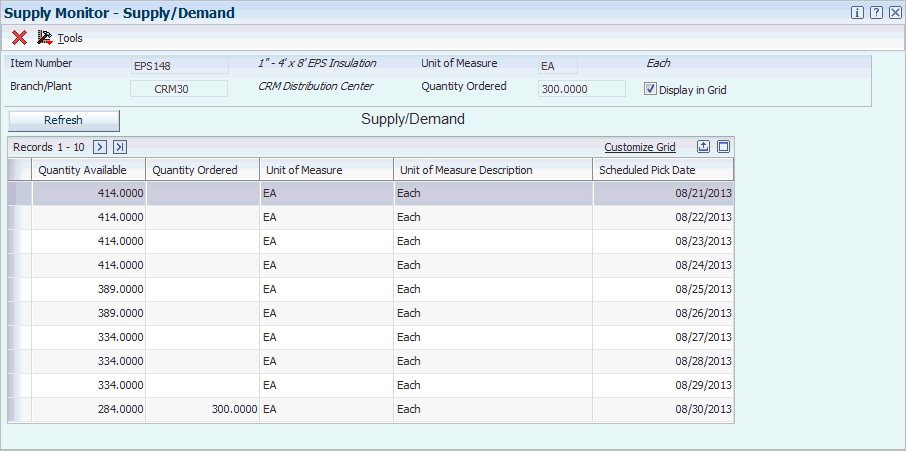
A yellow triangle indicates that the system can allocate inventory to the order line to partially fill it. The top point of the triangle indicates the total partial quantity that the system can allocate to your order line. In Figure 6-2 the quantity ordered is 300. The top of the triangle point is equal to total inventory quantity (284) available to partially fill the order. You can see the actual numeric values in the grid format as shown in Figure 6-3.
As other transactions occur such as an increase in inventory, canceled order lines, new orders and so on; the triangle color might change to green, which indicates that there is enough quantity available on the scheduled pick date to allocate inventory to the order line. Or the triangle color might change to red, which indicates that there is not enough quantity available on the scheduled pick date to allocate any inventory to your order line.
Note:
You use the Sales Advisor Constants program (P42X00) to specify the number of calendar days the system displays on either side of the scheduled pick date for the order line. In Figure 6-2 there is no inventory for the item before August 21, 2013. Therefore the number of scheduled pick dates before the scheduled pick date for this order line does not equal to the number of scheduled pick dates after the scheduled pick date for the order line.- Item Number
-
Displays the item number from the sales order line.
- Branch/Plant
-
Displays the branch/plant from the sales order line.
- Unit of Measure
-
Displays the unit of measure from the sales order line.
- Quantity Ordered
-
Displays the quantity ordered. This is the quantity ordered for the line item.
- Display in Grid
-
Select this option to have the system hide the graph and display the information in a grid format.
-
Select the Display in Grid option.
- Quantity Available
-
Displays the quantity that is available to be picked on the specified scheduled pick date.
- Quantity Ordered
-
Displays the quantity from the order.
- Unit of Measure
-
Displays the unit of measure from the sales order line.
- Unit of Measure Description
-
Displays the unit of measure description.
- Scheduled Pick Date
-
Displays the date that the quantity is scheduled for picking.
-
After reviewing the order information, click the Save and Submit button.
-
On the Manage Existing Order form, inquire on your sales order.
-
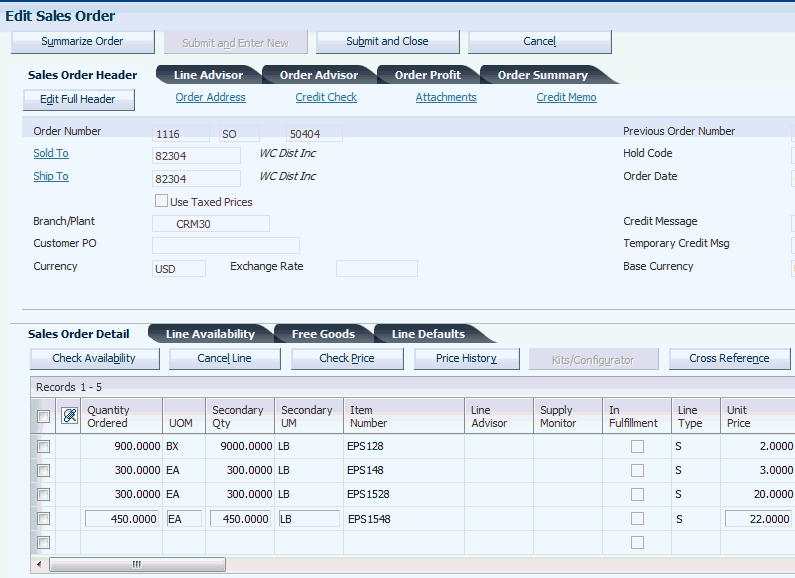
To display the Edit Sales Order form, select an order line and click the Select button.
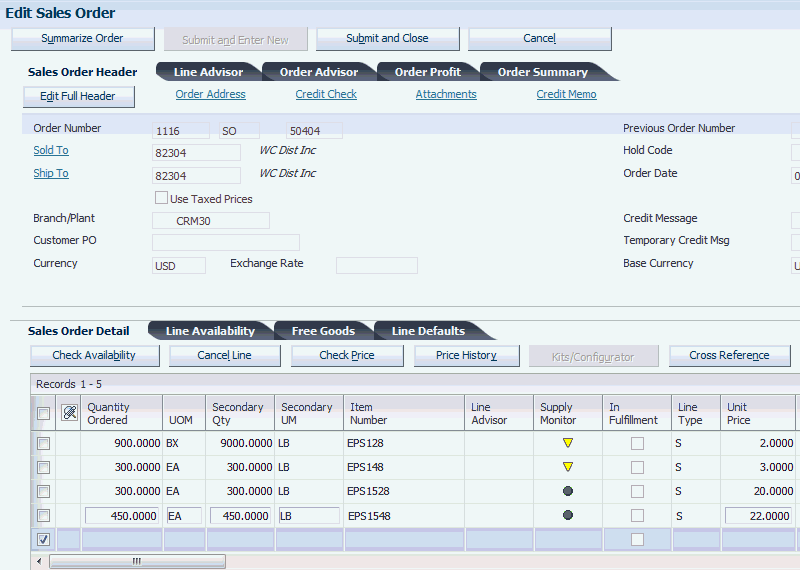
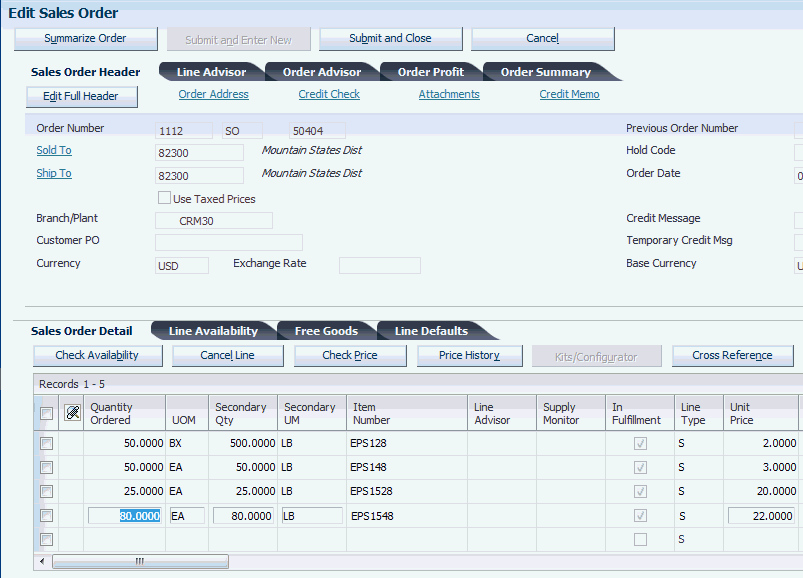
When you initially access the Edit Sales Order form, the form does not display icons in the Supply Monitor field.
-
Select the order lines for which you want to evaluate supply monitor.
-
Select Evaluate Supply Monitor from the More Row Actions menu and click the Go button.
The system displays the icons in the Supply Monitor field.
6.3 Working with Supply Monitor for Sales Order Lines in Fulfillment Management
This section provides an overview of supply monitor for sales order lines in Fulfillment Management, list prerequisites, and discusses how to work with supply monitor for sales order lines in Fulfillment Management.
6.3.1 Understanding Supply Monitor for Sales Order Lines in Fulfillment Management
The Fulfillment Chart program (P42X040) enables you to constantly monitor sales orders and view real-time information concerning the potential to allocate inventory to sales order lines in Fulfillment Management.
The system displays graphical information, such as priority ranking, quantity ordered, ranges of order scores, and the fulfillment potential for sales order lines in each fulfillment potential category: high, moderate, and low. A snapshot view of this information enables customer service representatives to communicate real-time information concerning the potential to allocate inventory to sales order lines in Fulfillment Management.
You must use the Sales Order Entry program (P42101) for sales order entry to access the Supply Monitor - Fulfillment Potential form (W42X040A). From the Sales Order Entry program, you can access the Supply Monitor - Fulfillment Potential form by clicking the icon that appears in the Supply Monitor field of a sales order detail line marked as in fulfillment.
The information that you are viewing at the time of sales order entry and in update mode is a snapshot view of what would occur should you run the Auto Fulfillment Processing program (R4277701) at that point in time.
The information is real-time and changes based on new and revised transactions. For example, order lines that currently have a high potential of being fulfilled might have a moderate potential of being fulfilled two hours later.
In the case of a process failure such as sales order processing ending abnormally or closing a browser with an active session open, the system may not cleanup work files properly. You can run the Supply Monitor Chart Work File program (R42X060WP) to delete all work file records that are more than one day old. The Supply Monitor Chart Work File program purges records from the Supply Monitor Chart Work File table (F42X060W).
6.3.2 Prerequisites
Before you complete the task in this section:
-
Activate the Fulfillment Management system.
-
Set up Fulfillment constants in the Sales Advisor Constants program (P42X00).
-
Set up Fulfillment Management features such as scoring, service level rules, and fulfillment rules.
6.3.3 Working with Supply Monitor for Sales Order Lines in Fulfillment Management
To work with supply monitor for sales order lines in Fulfillment Management:
-
Access the Enter New Order form.
Form Name Form ID Navigation Enter New Order W42101D Sales Order Processing (G4211). Select Create Sales Order - Detail First.
On the Manage Existing Order form, click the Add button.
-
On the Enter New Order form, enter order header and detail information.
For order lines that enter into the fulfillment management process, the system displays a check mark in the In Fulfillment field. After the order lines are released from fulfillment, the system does not display icons in the Supply Monitor field.
When you tab off the order line, the system displays a green, yellow, or red icon in the Supply Monitor field to indicate the real-time potential to allocate inventory to the order.
-
The green icon (circle) indicates that the potential to allocate inventory to the order line is high.
-
The yellow icon (inverted triangle) indicates that the potential to allocate inventory to the order line is moderate.
In the Sales Advisor Constants program, you can specify the tolerance percentage used during the fulfillment potential process. The tolerance percentage determines how much of the available inventory the system considers possibly available.
-
The red icon (square) indicates that the potential to allocate inventory to the order line is low.
Caution:
The functional design of the Supply Monitor application does not support the Fulfillment Management custom functions. If you are using a custom function for service level rules, the system may or may not render the icons and graphics. If the system does render icons and graphics, the information may or may not be accurate.The circumstances in which the system does not display an icon in the Supply Monitor field include:
-
The order line is in Fulfillment Management, but is not eligible for processing through the Auto Fulfillment (R4277701) batch program. Examples include a kit parent or component, and order lines on hold.
-
Viewing the order line in change mode without modifying the line or selecting Evaluate Supply Monitor from the Row menu.
Note:
If you enter an invalid version of the Auto Fulfillment Processing program (R4277701) in the Sales Advisor Constants program and the Fulfillment Management system is activated, the system does not process Supply Monitor and does not display the Supply Monitor icon. Also, the system does not display an error message. -
-
To display the Supply Monitor - Fulfillment Potential form, click the icon on a sales order line which you want to see supply monitor information.
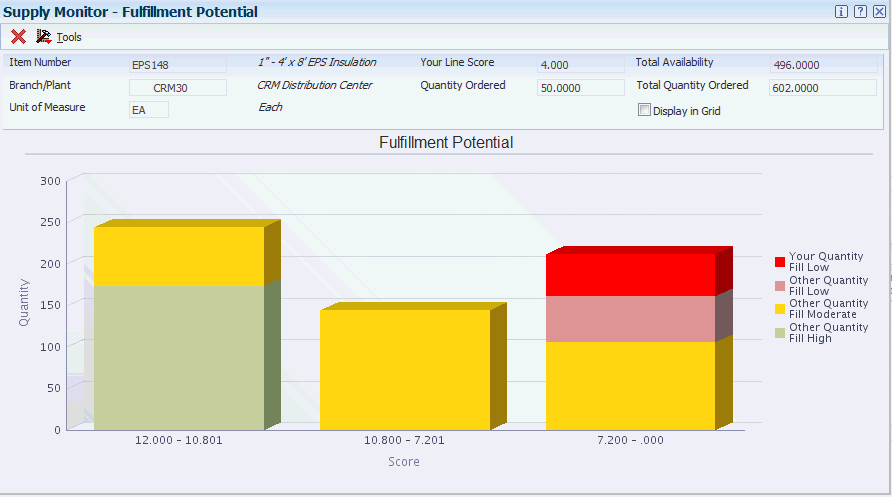
The chart displays the available quantity on the y-axis and score ranges on the x-axis. Additionally, the chart displays a maximum of ten score ranges in a bar graph. Each bar in the graph represents the amount of quantity ordered that falls within the score range. The quantity represented by each bar combine to equal to the total quantity for all order lines for the specified item. The colors on the bars represent the potential to fill your order quantity and the quantity for other orders lines. The ranges are based on scoring setup and the number of sales orders that the system is considering at the moment. If you do not set up the system to score order lines, the system displays icons and graphics based on a zero score.
The chart also displays a legend to describe the potential to fill your order line quantity in relation to the potential to fill other quantities for the same item. For example, in Figure 6-7 the bar with the score range 7.2 - 0 indicates the following information:
-
The total quantity ordered for order lines with item EPS148 in this scoring range is approximately 200.
-
The red shaded area of the bar represents your order quantity (50) and indicates that the potential to allocate inventory to your order line is low.
-
The light red shaded area of the bar represents the quantity (50) of a portion of the other order lines and indicates that the potential to allocate inventory to this portion of other order lines is low.
-
The yellow shaded area of the bar represents the quantity (100) of a portion of the other order lines and indicates that the potential to allocate inventory to this portion of other order lines is moderate.
As other transactions occur such as an increase in inventory, canceled order lines, new order lines and so; the potential to fill your order might change from low to moderate (yellow) or high (green).
Note:
The lighter shades of red, yellow and green represent quantities related to other order lines. Dark shades of red, yellow, and green represent quantities related to your order line.- Item Number
-
Displays the item number from the selected sales order line.
- Branch/Plant
-
Displays the branch/plant from the selected sales order line.
- Unit of Measure
-
Displays the unit of measure for the selected sales order line.
- Your Line Score
-
Displays the line score for your selected sales order line. The system calculates a line score based on how you set up the JD Edwards EnterpriseOne Fulfillment Management system to score order lines.
- Quantity Ordered
-
Displays the quantity ordered. This is the quantity ordered for the line item.
- Total Availability
-
Displays the amount of quantity available for the line item in the displayed branch/plant. The available quantity might consist of the on-hand quantity minus commitments, reservations, and backorders.
- Total Quantity Ordered
-
Displays the total quantity ordered for the item across all sales orders.
- Display in Grid
-
Select this option to have the system hide the graph and display the information in a grid format.
-
-
On the Supply Monitor - Fulfillment Potential form click the Display in Grid option.
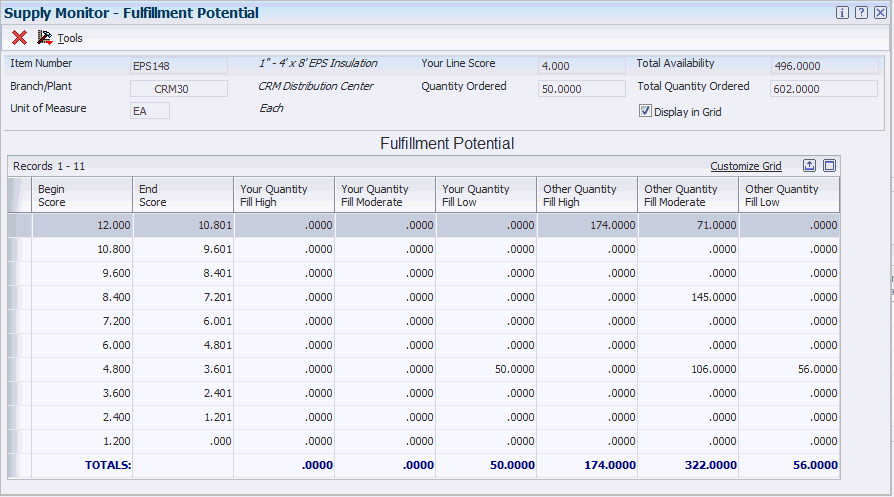
In grid format, the system displays ten scoring ranges regardless of the number of bars in the bar graph. The ranges are based on scoring setup and the number of sales orders that the system is considering at the moment.
The system displays the total quantity of your sales order line across three columns - Your Quantity Fill High, Your Quantity Fill Moderate, and Your Quantity Fill Low. The system displays your quantities in the row that represents the scoring range for your line score. For example, Figure 6-8 shows that you ordered 50 EA of item EPS148. Your actual line score is 4.000 and falls within the scoring range of 4.800 to 3.601. Based on the current demand, total item availability, your line score, and the scoring for other sales order lines; the potential to allocate inventory to your order line is low.
- Begin Score
-
Displays the beginning score range (ascending or descending) to define data on a point in the fulfillment graph represented as a number.
- End Score
-
Displays the ending score range (ascending or descending) to define data on a point in the fulfillment graph represented as a number.
- Your Quantity Fill High
-
Based on your line score, the system displays the current quantity of your sales order line that has a high potential to be filled.
- Your Quantity Fill Moderate
-
Based on your line score, the system displays the current quantity of your sales order line that has a moderate potential to be filled.
- Your Quantity Fill Low
-
Based on your line score, the system displays the current quantity of your sales order line that has a low potential to be filled.
- Other Quantity Fill High
-
Based on the line scores of other sales order lines, the system displays the current total quantity of other sales order lines that have a high potential to be filled.
- Other Quantity Fill Moderate
-
Based on the line scores of other sales order lines, the system displays the current total quantity of other sales order lines that have a moderate potential to be filled.
- Other Quantity Fill Low
-
Based on the line scores of other sales order lines, the system displays the current total quantity of other sales order lines that have a low potential to be filled.
-
After reviewing the order information, click the Save and Submit button.
-
On the Manage Existing Order form, inquire on your sales order.
-
To display the Edit Sales Order form, select an order line and click the Select button.
When you initially access the Edit Sales Order form, the form does not display icons in the Supply Monitor field.
-
Select the order lines for which you want to evaluate supply monitor.
-
Select Evaluate Supply Monitor from the More Row Actions menu and click the Go button.
The system displays the icons in the Supply Monitor field.
