18 Building a Report with Graphics, Text, and Color
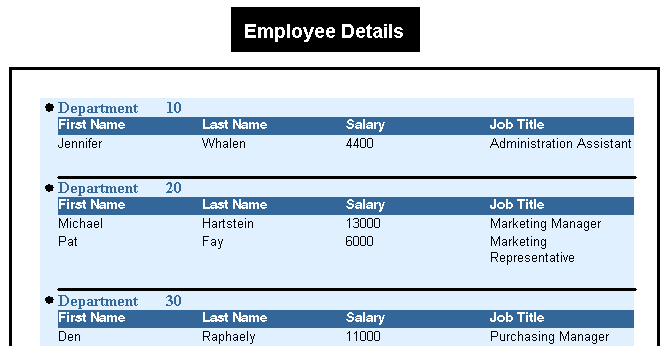
In this chapter, you will learn about reports that include graphics, text, and color. By following the steps in this chapter, you can generate the report output shown in Figure 18-1.
Figure 18-1 Graphics, text, and color report output

Description of "Figure 18-1 Graphics, text, and color report output"
-
Reports Builder enables you to modify the look of your report in multiple ways. In this example, you will build a report and enhance it by adding an image to the margin, a title, and a border. You will also change the look of the report by applying different fonts and text styles.
-
This report shows you how to enhance your reports with graphics by:
-
For more information on enhancing the appearance of your reports, refer to the Oracle Reports online Help.
This is a one-query group left report.
This report uses a Group Above layout, which you will modify in the Paper Layout view to make room for the title and company logo. Then, you will import the logo, create the report title, and the rest of the graphics shown in the image above.
As you build this example report, you will:
-
Create a Simple Report Definition using the Report Wizard to create one query that selects all the columns for this report, and assign a column to a new break group.
-
Modify the Report in the Paper Layout View to:
-
Change the font size and style using the Font dialog box.
-
Add bullets to your report using the tool palette.
-
Display a line between each record using the Line tool.
-
Add a title to your report using the Fill Color tool and other layout tools.
To see a sample report with graphics and highlighted text, open the examples folder named graphics, then open the Oracle Reports example named graphics.rdf. For details on how to open it, see "Accessing the Example Reports" in the Preface.