4 Monitoring Oracle Fusion Middleware
Oracle Fusion Middleware provides a variety of technologies and tools that can be used to monitor Server and Application performance. Monitoring is an important step in performance tuning and enables you to evaluate server activity, watch trends, diagnose system bottlenecks, debug applications with performance problems and gather data that can assist you in tuning the system.
This chapter contains the following sections:
-
Section 4.1, "About Oracle Fusion Middleware Management Tools"
-
Section 4.2, "Oracle Enterprise Manager 11g Fusion Middleware Control"
-
Section 4.3, "Oracle WebLogic Server Administration Console"
-
Section 4.7, "Oracle Process Manager and Notification Server"
4.1 About Oracle Fusion Middleware Management Tools
After you install and configure Oracle Fusion Middleware, you can use the graphical user interfaces or command-line tools to manage your environment.
You can use the following tools to manage your Oracle Fusion Middleware installations:
-
Oracle Enterprise Manager Fusion Middleware Control. See Section 4.2.
-
Oracle WebLogic Server Administration Console. See Section 4.3.
-
Oracle WebLogic Diagnostics Framework (WLDF). See Section 4.4.
-
Oracle WebLogic Scripting Tool (WLST). See Section 4.5.
-
DMS Spy Servlet. See Section 4.6.
-
Oracle Process Manager and Notification Server. See Section 4.7.
-
Oracle Enterprise Manager 11g Grid Control. See Section 4.8.
-
Operating System Performance Commands. See Section 4.9.
-
Network Performance Monitoring Tools. See Section 4.10.
Use these tools, rather than directly editing configuration files, to perform all administrative tasks unless a specific procedure requires you to edit a file. Editing a file may cause the settings to be inconsistent and generate problems.
Both Fusion Middleware Control and Oracle WebLogic Server Administration Console are graphical user interfaces that you can use to monitor and administer your Oracle Fusion Middleware environment. You can perform some tasks with either tool, but, for other tasks, you can only use one of the tools.
For more information on using WebLogic Server Administration Console for monitoring your domain, see the Oracle Fusion Middleware Administrator's Guide.
4.1.1 Measuring Your Performance Metrics
Metrics are the criteria you use to measure your scenarios against your performance objectives. You can use performance metrics to help locate bottlenecks, identify resource availability issues, or help tune your components to improve throughput and response times. After you have determined your performance criteria, take measurements of the metrics used to quantify your performance objectives.
For example, you might use response time, throughput, and resource utilization as your metrics. The performance objective for each metric is the value that is acceptable. You match the actual value of the metrics to your objectives to verify that you are meeting, exceeding, or failing to meet your performance objectives.
When you manage or monitor an Oracle Fusion Middleware component or application with Fusion Middleware Control, you may see performance metrics that provide insight into the current performance of the component or application. In many cases, these metrics are shown in interactive charts; other times they are presented in tabular format. The best way to use and correlate the performance metrics is from the Performance Summary page for the component or application you are monitoring.
The next sections of this chapter provide an overview of the Oracle Fusion Middleware technologies and tools that can be used to monitor Server and Application performance. If you are new to Oracle Fusion Middleware or if you need additional information about monitoring your environment using the Performance Summary pages, see "Viewing the Performance of Oracle Fusion Middleware" in the Oracle Fusion Middleware Administrator's Guide. In addition, the Fusion Middleware Control online help provides definitions and other information about specific performance metrics that are available on its management and monitoring pages. See Section 4.2.1, "Viewing Performance Metrics Using Fusion Middleware Control".
4.2 Oracle Enterprise Manager 11g Fusion Middleware Control
Fusion Middleware Control is a Web browser-based, graphical user interface that you can use to monitor and administer a farm. Fusion Middleware Control organizes a wide variety of performance data and administrative functions into distinct, Web-based home pages for the farm, domain, servers, components, and applications. The Fusion Middleware Control home pages make it easy to locate the most important monitoring data and the most commonly used administrative functions—all from your Web browser.
In addition, Fusion Middleware Control provides a set of MBean browsers that allow you to browse the MBeans for a WebLogic Server or for a selected application and perform specific monitoring and configuration tasks from the MBean browser.
See Also:
"Getting Started Using Oracle Enterprise Manager Fusion Middleware Control" in Oracle Fusion Middleware Administrator's GuideUse Fusion Middleware Control to:
-
Monitor and administer a single Fusion Middleware Farm
-
Monitor all elements of the farm - including deployed applications and Fusion Middleware components such as:
-
WebLogic Domain
-
Cluster and Managed Servers
-
SOA components
-
Web Center
-
Web Cache
-
Oracle HTTP Server
-
Oracle Identity Management
-
-
Monitor the state and performance of each of these targets by providing out-of-the-box performance metrics
-
Monitor CPU usage, heap usage, Work Manager, JMS servers, and JDBC and JTA usage for Oracle WebLogic Server
-
Monitor JVM performance in terms of heap versus non-heap usage, garbage collection, and threads performance
-
Monitor applications and Web services deployed to WebLogic Server
-
Monitor a wide range of application metrics for servlets, JSPs, and EJBs are available, as well as Web services metrics for faults, invocations, and violations. Such metrics are accessible from a target's home page.
-
Access customizable performance summary pages to help administrators monitor performance and diagnose problems. These charts can be modified to display content that is relevant to your domain. A target or component might be added to the chart so that you can compare the performance information for two targets in one chart.
See Also:
For more information about monitoring your environment using the Performance Summary pages, see "Viewing the Performance of Oracle Fusion Middleware" in Oracle Fusion Middleware Administrator's Guide.4.2.1 Viewing Performance Metrics Using Fusion Middleware Control
When you manage or monitor an Oracle Fusion Middleware component or application with Fusion Middleware Control, you often see performance metrics that provide insight into the current performance of the component or application. In many cases, these metrics are shown in interactive charts; other times they are presented in tabular format. The best way to use and correlate the performance metrics is from the Performance Summary page for the component or application you are monitoring.
Use the Fusion Middleware Control online help to obtain a definition of a specific performance metric. There are two ways to access this information:
-
Browse or search for the metric in the Fusion Middleware Control online help.
-
Navigate to the Performance Summary page for your Oracle Fusion Middleware component or application and do the following:
-
Click Show Metric Palette.
-
Browse the list of metrics available for the component or application to locate a specific metric.
-
Right-click the name of the metric and select Help from the context menu.
-
If you encounter a problem, such as an application that is running slowly or is hanging, you can view more detailed performance information, including performance metrics for a particular target, to find out more information about the problem.
Oracle Fusion Middleware automatically and continuously measures run-time performance. The performance metrics are automatically enabled; you do not need to set options or perform any extra configuration to collect them. If you are interested in viewing historical data, consider using Oracle Enterprise Manager Grid Control. For more information see "Middleware Management" in Oracle Enterprise Manager Concepts.
4.3 Oracle WebLogic Server Administration Console
Oracle WebLogic Server Administration Console is a Web browser-based, graphical user interface that you use to manage an Oracle WebLogic Server domain. It is accessible from any supported Web browser with network access to the Administration Server.
See Also:
For general information on using the WebLogic Server console, see "Getting Started Using Oracle WebLogic Server Administration Console" in Oracle Fusion Middleware Administrator's Guide.Use the WebLogic Server Administration Console to:
-
Configure, start, and stop WebLogic Server instances
-
Configure and Monitor WebLogic Server clusters
-
Configure and Monitor WebLogic Server services, such as database connectivity (JDBC) and messaging (JMS)
-
Configure security parameters, including creating and managing users, groups, and roles
-
Configure and deploy Java EE applications
-
Monitor server and application performance
-
View server and domain log files
-
View application deployment descriptors
-
Edit selected run-time application deployment descriptor elements
Oracle WebLogic Server contains a Java Management Extensions (JMX) server implementation and provides its own set of Management Beans (MBeans). Oracle management tools described in this chapter use the MBeans provided by WebLogic Server to allow you to configure, monitor, and manage WebLogic Server resources.
Additional WebLogic Server Console Resources:
For details on the content contained in each summary table, see "Monitor Servers" in WebLogic Administration Console Online Help.
For detailed information on using the WebLogic Server to monitor your domain, see the Oracle Fusion Middleware Performance and Tuning for Oracle WebLogic Server.
The Oracle Technology Network at http://www.oracle.com/technology/index.html provides product downloads, articles, sample code, product documentation, tutorials, white papers, news groups, and other key content for WebLogic Server.
4.4 WebLogic Diagnostics Framework (WLDF)
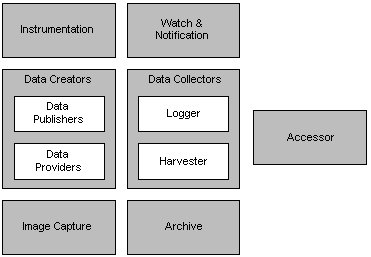
The WebLogic Diagnostic Framework (WLDF) is a monitoring and diagnostic framework that can collect diagnostic data that servers and applications generate. The WLDF can be configured to collect the data and store it in various sources, including log records, data events, and harvested metrics.
WLDF includes several components for collecting and analyzing data:
-
Data Creators— data publishers and data providers that are distributed across WLDF components.
-
Diagnostic Image Capture—Creates a diagnostic snapshot from the server that can be used for post-failure analysis.
-
Archive—Captures and persists data events, log records, and metrics from server instances and applications.
-
Instrumentation—Adds diagnostic code to WebLogic Server instances and the applications running on them to execute diagnostic actions at specified locations in the code. The Instrumentation component provides the means for associating a diagnostic context with requests so they can be tracked as they flow through the system.
-
Harvester—Captures metrics from run-time MBeans, including WebLogic Server MBeans and custom MBeans, which can be archived and later accessed for viewing historical data.
-
Watches and Notifications—Provides the means for monitoring server and application states and sending notifications based on criteria set in the watches. (A watch rule can monitor log data, event data from the Instrumentation component, or metric data from a data provider that is harvested by the Harvester. The Watch Manager is capable of managing watches that are composed of several watch rules.)
-
Logging services—Manage logs for monitoring server, subsystem, and application events.
The relationship among these components is shown in Figure 4-1.
All of the framework components operate at the server level and are only aware of server scope. All the components exist entirely within the server process and participate in the standard server lifecycle. All artifacts of the framework are configured and stored on a per server basis.
Note:
For more information on the WebLogic Diagnostics Framework and how it can be leveraged for monitoring Oracle Fusion Middleware components, see Oracle Fusion Middleware Configuring and Using the Diagnostics Framework for Oracle WebLogic Server.4.5 WebLogic Scripting Tool (WLST)
The Oracle WebLogic Scripting Tool (WLST) is a command-line scripting environment that you can use to create, manage, and monitor Oracle WebLogic Server domains. It is based on the Java scripting interpreter, Jython. In addition to supporting standard Jython features such as local variables, conditional variables, and flow control statements, WLST provides a set of scripting functions (commands) that are specific to WebLogic Server. You can extend the WebLogic scripting language to suit your needs by following the Jython language syntax.
You can use any of the following techniques to invoke WLST commands:
-
Interactively, on the command line
-
In script mode, supplied in a file
-
Embedded in Java code
See Also:
4.5.1 Using Custom WLST Commands
Many components, such as Oracle SOA Suite, Oracle Platform Security Services (OPSS), Oracle Fusion Middleware Audit Framework, and MDS, and services such as SSL and logging, supply custom WLST commands.
To use these custom WLST commands, you must invoke WLST from the Oracle home in which the component has been installed. See "Using Custom WLST Commands" in the Oracle Fusion Middleware Administrator's Guide for more information.
4.5.1.1 Using WLST Commands for System Components
In addition to the commands provided by WLST for Oracle WebLogic Server, WLST provides a subset of commands to monitor and manage system components. These commands are:
-
startproc(componentName [, componentType] [, componentSet): Starts the specified component. -
stopproc(componentName [, componentType] [, componentSet): Stops the specified component. -
status(componentName [, componentType] [, componentSet): Obtains the status of the specified component. -
proclist(): Obtains the list of components. -
dumpMetrics([servers,] [format]): Displays available metrics in the internal format, PDML, or in XML. -
displayMetricTables([metricTable_1], [metricTable_2], [...,] [servers] [variables]): Displays the content of the DMS metric tables. -
displayMetricTableNames([servers]): Displays the names of the available DMS metric tables. The returned value is a string array containing metric table names.
Note:
Thedmstool command has been replaced with the following commands: dumpMetrics, displayMetricTables, displayMetricTableNames. For more information on DMS WLST commands, see "DMS Custom WLST Commands" in Oracle Fusion Middleware WebLogic Scripting Tool Command Reference4.6 DMS Spy Servlet
The DMS Spy servlet provides access to DMS metric data from a web browser. Data that is created and updated by DMS-enabled applications and components is accessible through the DMS Spy Servlet.
4.6.1 Viewing Performance Metrics Using the Spy Servlet
The DMS Spy Servlet is part of the DMS web application. The DMS web application's web archive file is dms.war, and can be found in the same directory as dms.jar: <ORACLE_HOME>/modules/oracle.dms_11.1.1/dms.war.
The DMS web application is deployed by default as part of a JRF-enabled server instance. The URL is: http://host:port/dms/Spy.
Only users who have Administrator role access can view this URL as access is controlled by standard Java EE elements in web.xml.
4.6.2 Using the DMS Spy Servlet
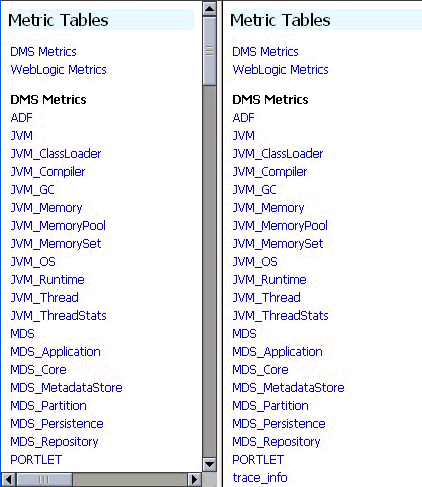
Figure 4-2 shows the initial page of the Spy servlet: both sides show the same list of metric tables.
Figure 4-2 Spy Servlet Page - Metrics Tables
Description of "Figure 4-2 Spy Servlet Page - Metrics Tables"
Note that the Spy servlet can display metric tables for WebLogic Server and also for non-Java EE components that are deployed.
For metric tables to appear in the Spy servlet, the component that creates and updates that table must be installed and running. Metric tables for components that are not running are not displayed. Metric tables with ":" in their name (for example, weblogic_j2eeserver:app_overview) are aggregated metric tables generated by metric rules.
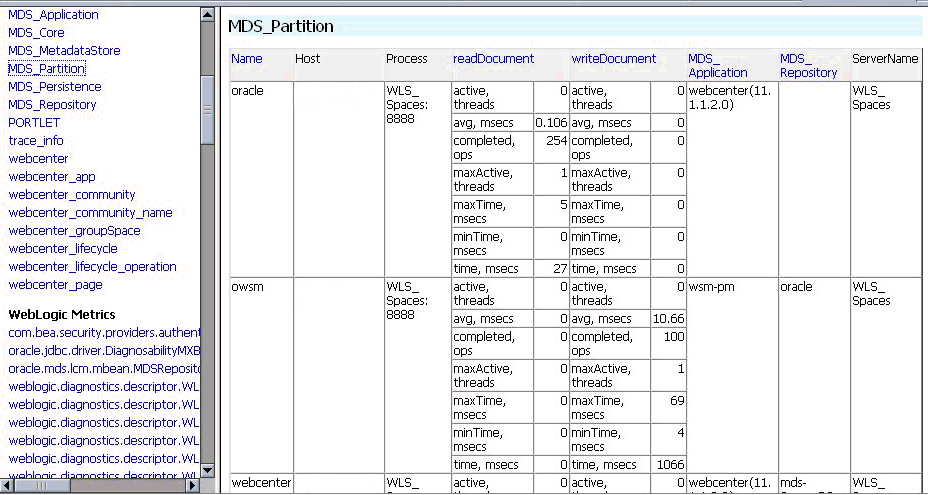
To view the contents of a metric table, click the table name. For example, Figure 4-3 shows the MDS_Partition table.
To get a description of the fields in a metric table, click the Metric Definitions link below the table.
4.7 Oracle Process Manager and Notification Server
Oracle Process Manager and Notification Server (OPMN) monitors the status of Oracle Fusion Middleware components. You can also start and stop system components, monitor system components, and perform many other tasks related to process management. For example, you can use OPMN to start and stop OPMN-managed processes, such as Oracle HTTP Server and Oracle Web Cache. For more information on OPMN commands, see "Section 5.5.4, "Monitoring Oracle HTTP Server".
Note:
For more information on using OPMN, refer to Oracle Fusion Middleware Oracle Process Manager and Notification Server Administrator's Guide.4.8 Oracle Enterprise Manager 11g Grid Control
While Fusion Middleware Control provides real-time performance monitoring for a single Fusion Middleware Farm, Oracle Enterprise Manager 11g Grid Control enables you to centrally manage multiple farms, in addition to the rest of your data center (such as the underlying host and operating system, databases, packaged applications such as Oracle E-Business Suite and Siebel, and third party products such as F5 BIG_IP Local Traffic Manager).
Note:
Grid Control is not provided out-of-box with the Fusion Middleware installation; it requires a separate installation. Refer to the Oracle Enterprise Manager 11g Grid Control Installation and Advanced Configuration Guide for further details on how to install Grid Control.Key features available from Grid Control that are applicable to and relevant in monitoring Fusion Middleware performance include the following:
-
Monitor multiple WebLogic Server Domains from a single console.
-
Out-of-the-box availability and performance monitoring
-
Monitor availability and performance in real-time as well as from an historical perspective
-
Specify warning versus critical thresholds for key performance metrics
-
Receive email and/or page notifications when metric thresholds are reached
-
Perform trend analysis on collected performance information
-
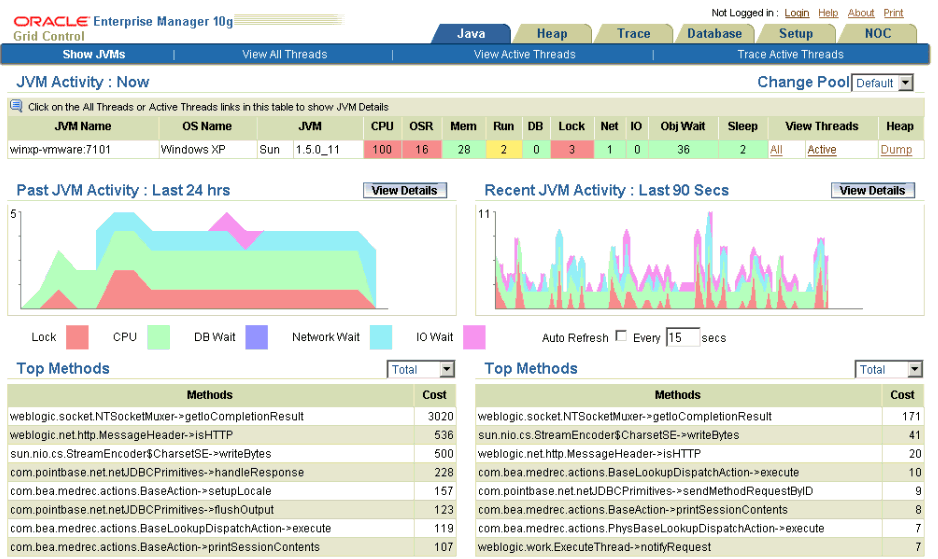
Application Diagnostics for Java (AD4J) which provides production diagnostics with no application instrumentation. The AD4J screen is shown below.
Description of the illustration ad4j.gif
Key features of AD4J include the following:
-
Full method, stack and thread state visibility
-
Quick ranking of high-cost code being executed for bottleneck identification
-
Line-of-code granularity
-
Cross-tier database and EJB/RMI correlation
-
Java thread lock and synchronization detection
-
Thread activity tracing
-
Heap snapshot and analysis
-
Differential heap analysis to quickly isolate memory leaks
-
Threshold based alerting
-
Alert actions through SNMP traps, SMTP, or HTTP request
-
-
Composite Application Monitor and Modeler (CAMM) provides application service management for complex composite services such as Portal, BPEL, ESB, OSB, and Web Services. The CAMM screen is shown below.
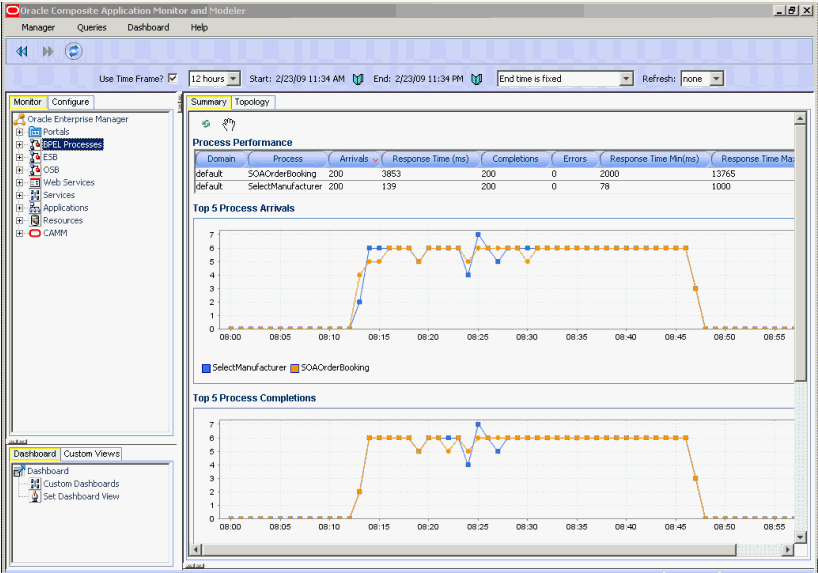
Description of the illustration camm.gif
Key features of CAMM include the following:
-
Automated discovery of complex services (Portal, BPEL, ESB, OSB, Web Services)
-
Automatic metadata analysis and monitoring instrumentation configuration
-
run time dependency analysis between SOA services and endpoints
-
Metadata model presents monitored targets using native terminology
-
Invocation metrics based on both arrival and completion of inbound request
-
Response time mean, max, and min metrics
-
Tiered data aggregation for long term storage and trending
-
Historical views into arbitrary date/time ranges
-
Comparative views to compare any two arbitrary date/time ranges with simultaneous scrolling
-
Custom views to combine arbitrary graphs, tables, and functional views
-
Customizable hierarchy of custom views
-
Threshold based alerting on any metric, both individual and aggregate
-
Alert actions through SNMP traps, SMTP, logging, or custom scripts
-
-
Real User Experience Insight (RUEI) provides insight into the real end-user experience for your applications. No application instrumentation is required. The RUEI screen is shown below.
Key features of RUEI include the following:
-
Replay of poor performance
-
Executive dashboards
-
Extensive KPI and SLA monitoring
-
Full alerting capabilities
-
Quick bottle-neck analyses
-
Transaction performance analyses
-
Customized reporting
-
Trend analyses
-
Full data integration through XML
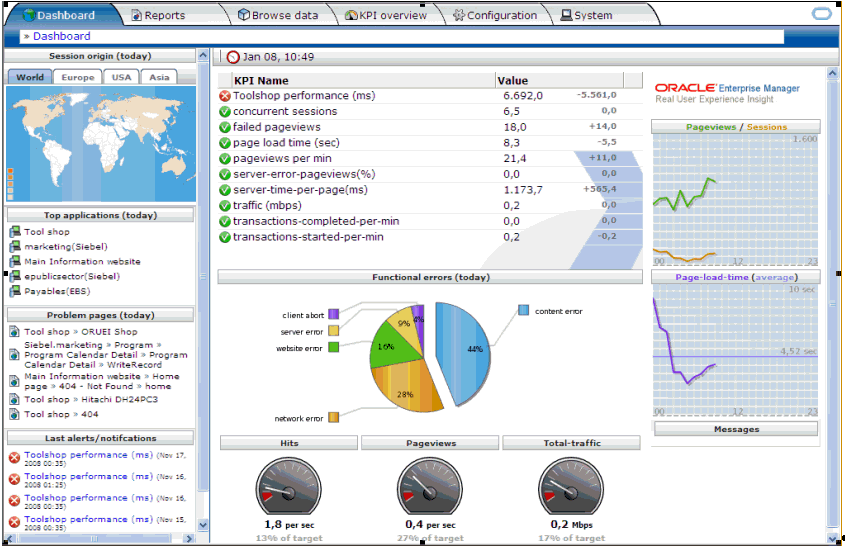
Description of the illustration reui.gif
-
Note:
For more information on the monitoring features available in Oracle Enterprise Manager 10g Grid Control, refer to the Oracle Enterprise Manager 10g Grid Control documentation available on the Oracle Technology Network here:http://www.oracle.com/technology/documentation/oem.html.4.9 Native Operating System Performance Commands
Each operating system has native tools and utilities that can be useful for monitoring purposes. Native operating system commands enable you to gather and monitor for example CPU utilization, paging activity, swapping, and other system activity information.
For details on operating system commands, refer to the documentation provided by the operating system vendor.
4.10 Network Performance Monitoring Tools
Your operating system's network monitoring tools can be used to monitor utilization, verify that the network is not becoming a bottleneck, or detect packet loss or other network performance issues. For details on network performance monitoring, refer to your operating system documentation.
