4 User Interface
The user interface (UI) displays a consolidated view of the physical and virtual managed resources in your data centers. You can view dashboards, graphs, and charts for a high-level view of the managed assets in your data center, or drill down to details as granular as power usage and CPU status. Multiple users can log in to the console at the same time to manage one or more remote data centers. While the software does provide CLI and API commands, the UI provides the most robust functionality. The following graphic is the home page, which includes a dashboard summary of all of your managed assets. Information and tasks are organized in the left Navigation pane. Expand a section to see the available options and view details in the center pane. The Jobs pane on the bottom of the page provides details about operations that are scheduled, in progress, and completed. For example, to create a report, expand the Reports section and select the report. When you run the report, a job is launched and the job status appears at the bottom of the UI.
Figure 4-1 High-level View of the User Interface
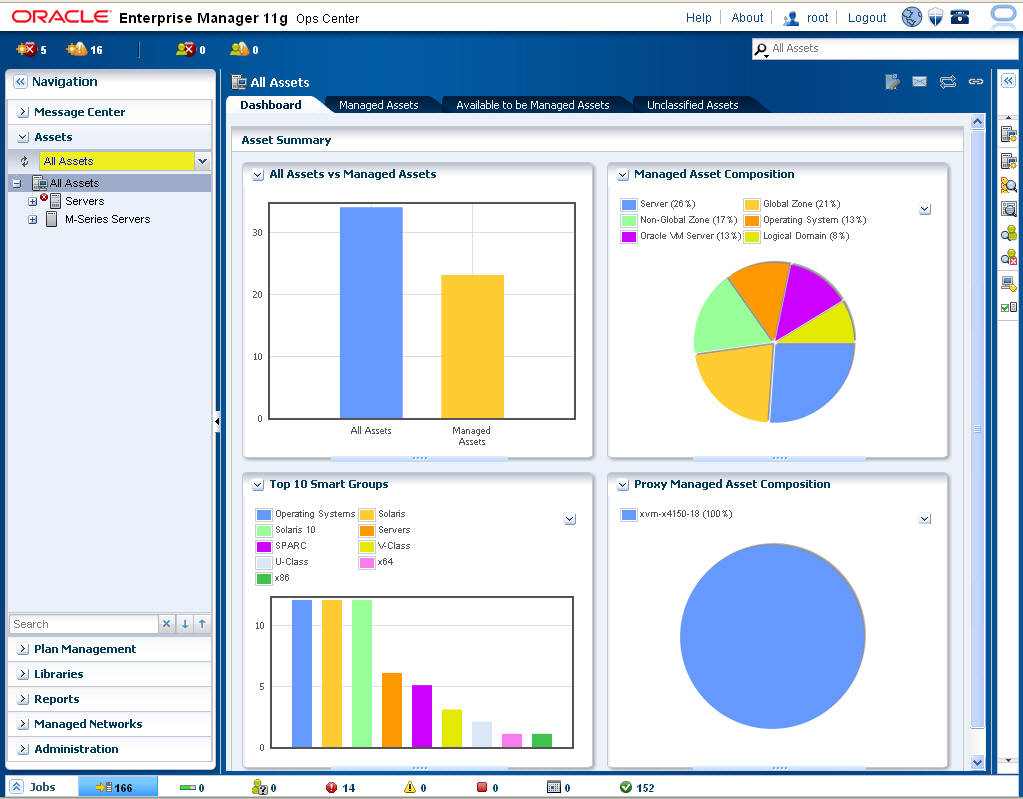
Description of "Figure 4-1 High-level View of the User Interface"
Navigation Pane
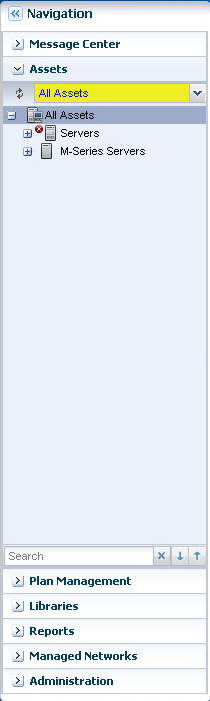
The Navigation pane, which is the left pane, provides first level navigation. It gives you access to the following information:
-
Message Center – Displays problems, service requests, and notifications.
-
Assets – Lists all assets that are known to Enterprise Manager Ops Center. You can view all managed assets from this pane, or drill down to a specific group of assets, such as operating systems.
-
Plan Management – Access pre-defined deployment plan templates, your customized plans, profiles, and policies. The Problems Knowledge Base is also accessed from Plan Management.
-
Libraries – Store your firmware and OS images, OS update components and metadata, local content, and virtualization content. Local content is information, such as updates, software, or other files that you upload into Enterprise Manager Ops Center are available in the Software Libraries section. Oracle VM Server for SPARC virtualization content, including logical domains, ISO images, and backup images, are available in the Storage Libraries.
-
Reports – Create reports or report templates, including OS update, firmware, hardware, and asset reports.
-
Managed Networks – View details about the virtual networks defined for Enterprise Manager Ops Center.
-
Administration – Perform administrative functions, such as defining users and user roles, and managing the Enterprise Manager Ops Center components.
Expand a section in the Navigation pane to see details. In the following graphic, the Assets section is expanded to display the asset groups. Expand a group to see the hardware, storage devices, operating systems, and guests that are managed in Enterprise Manager Ops Center.
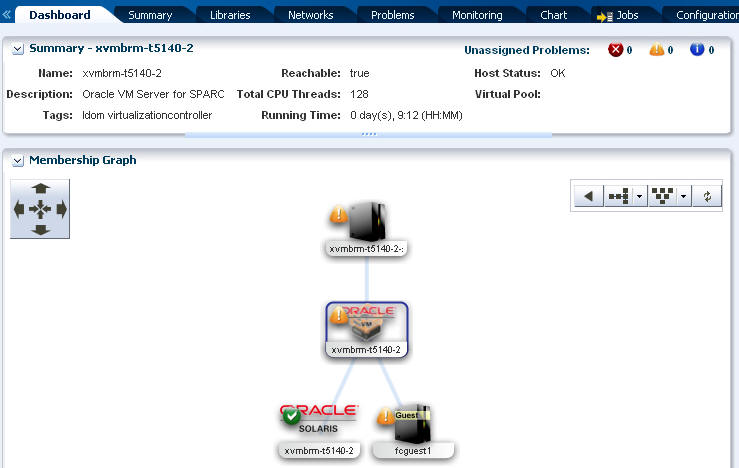
Center Pane
The center pane displays the details of the item that you selected in the Navigation pane. This pane contains tabs to further define the information presented. In many cases, the first tab is a Dashboard that contains a summary of the information available for the selection. The graphic below shows a Dashboard displayed in the center pane. The dashboard shows the physical and virtual relationships between the managed assets. For example, if an Oracle VM Server for SPARC is selected, a summary appears at the top of the dashboard, including a summary of any known problems. Below the summary is a membership graph that shows all physical and virtual associations, including operating system, logical domains, networks, and hardware.
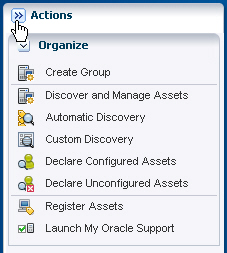
Actions Pane
The Actions pane, which is the right pane, contains a list of actions appropriate for the selected resource, such as defining an new OS update job. Many actions launch a pop-up wizard page that guides you through the task. In some cases you can schedule the job to start performing the task during non-peak hours or you can create a recurring schedule. When you finish defining the task, the job is started and the job name is appears at the bottom of the Actions pane.
Jobs Pane
The Jobs status pane, which is at the bottom of the UI, contains job status icons for all submitted jobs. You can expand this pane to see a list of all scheduled jobs. The graphic below shows the expanded jobs pane with the status and owner for each job.
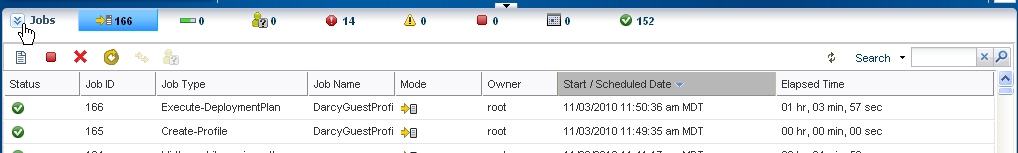
Use the jobs pane to check on job status and progress. Double-click on a job to drill down for more job details and logs.