1 Using the Browser User Interface
Enterprise Manager Ops Center is an integrated solution for managing all aspects of the data center. From a single console, you can discover, provision, patch, manage, and monitor the physical and virtual assets in one or more of your data centers. The operations you perform cover a wide range of Enterprise Manager Ops Center's capabilities:
-
You bring assets into Enterprise Manager Ops Center's management , using several types of discovery, and organize them.
-
You monitor all the assets, both physical and virtual.
-
You communicate status for all problems and take preventative or corrective actions.
-
You create reports of assets' performance and utilization.
To perform these tasks, you need a comprehensive knowledge of the types of assets and product features. This chapter describes the product's browser interface:
Overview of the User Interface
The user interface has a rich set of features that are designed to let you observe and control your data center's assets. These features present the range of information from a high-level overview of your data center to the low-level details of a specific asset. This information is presented in the center pane of the UI and is the result of your selections in the Navigation pane and in the Actions pane.
Figure 1-1 Enterprise Manager Ops Center User Interface.
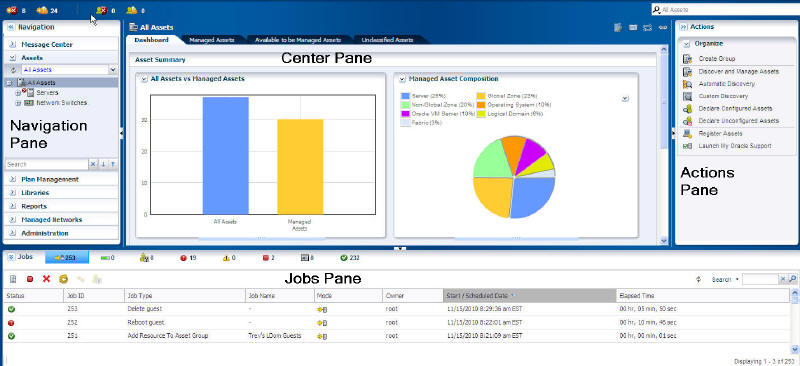
Description of "Figure 1-1 Enterprise Manager Ops Center User Interface."
Navigation Pane
The Navigation pane gives access to the following sections:
-
Assets – List of all assets that are registered in Enterprise Manager Ops Center.
-
Managed Networks – Contains details about the virtual networks defined for Enterprise Manager Ops Center.
-
Libraries – Stores all images, policies, and profiles.
-
Reports – List of reports that you can create, such as update and firmware reports.
-
Administration – Contains administrative functions, such as user administration, logs, and the status of service, including the version and upgrades available for the Agent.
Click on the right-arrow next to the section title to open the section and see its available resources and options. You can only open one section at a time.
Figure 1-2 Opening a section of the Navigation pane
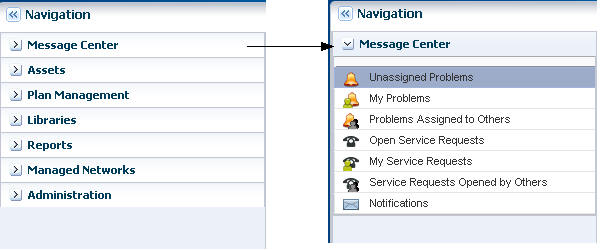
Description of "Figure 1-2 Opening a section of the Navigation pane"
The Navigation pane's Asset section lists every asset that is managed by Enterprise Manager Ops Center, grouped by its type and by other criteria that you provide. In even the smallest data center, refine the list of assets to show only the assets of interest. Choose one of the views in these categories:
-
Standard Views to organize the assets by type.
-
Resource Management View to list assets that share resources and are treated as nodes.
-
User-Defined Groups to organize assets according to your site's definitions. When a group is created, this customized list becomes the new default view. A list can show hierarchy of assets so when you see a + symbol in the list, click on the symbol to display the subordinate or individual assets.
If you know that Enterprise Manager Ops Center's information is changing and you do not see an asset, click the Refresh symbol in the Navigation pane. For example, if Enterprise Manager Ops Center discovers a new asset, the Asset list in the Navigation pane might not be current.
Each asset and its status is represented by an icon. These icons are an aid to help you distinguish one type of asset from another type and to see the condition of each. A quick scan of the asset hierarchy shows you which servers are running a Linux OS and which ones are running an Oracle Solaris OS or finds any unconfigured assets.
The Navigation pane shows not only all the assets, but all the other elements managed by Enterprise Manager Ops Center: plans and profiles, networks, libraries of images and data, reports, and administrative functions. Click on the title bar's right arrow to display a hierarchy of these items.
Your selections in the Navigation pane change the display in the center pane. The center pane is where you do most of your work. To increase the size of the center pane, close the Navigation pane. In the Navigation pane's title bar, click the left double-arrow to collapse the pane. When you want to select another asset, expand the pane again by clicking on the right double-arrow.
Center Pane
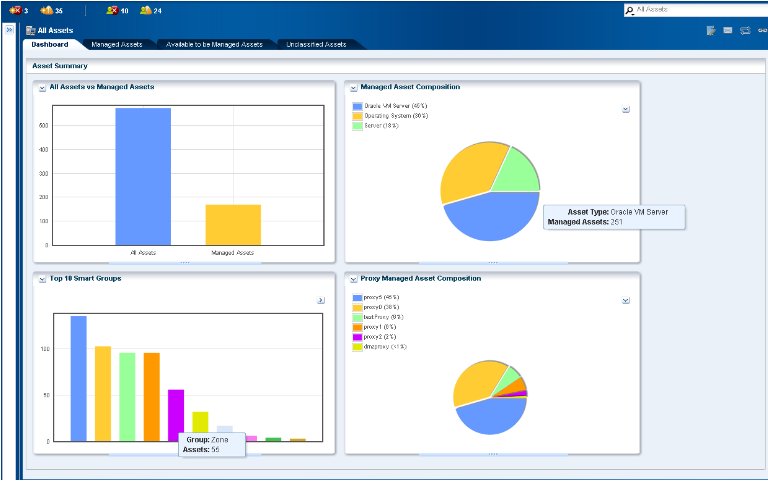
The initial display, in which no asset is selected, gives an overview of the assets managed by Enterprise Manager Ops Center. Each subpane represents the types of assets in a different type of chart. To identify the asset or asset type, hover the mouse of that portion of the chart.
Any selection in the Navigation pane changes the display in the center pane. Depending on the complexity of your selection, allow time for the information, especially in the Membership Graph , to finish loading.
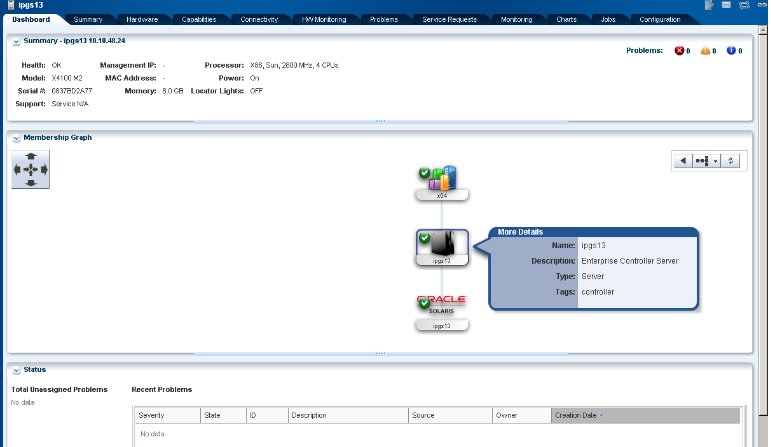
For most types of assets, the center pane shows a dashboard of standard information about the selected asset, a membership graph that shows its relationships, and a status summary. Use the scroll bars to bring all the information into view. For some types of assets, you need to click on the right double-arrow button to see all the tabs.
Some types of assets have additional sub-panes such as Services and File Systems. If any of this information is not of interest, you can collapse these sub-panes to hide the display and to prevent the information from refreshing. Click on the down-arrow in the corner of the sub-pane to hide the sub-pane. Click on the resulting right-arrow to reveal the sub-pane.
At any time, when you know that information is changing and you do not see the new information, click on the Refresh symbol in the upper-right corner of the center pane.
Membership Graph
The membership graph is the default display in the center pane and shows the relationships of the selected asset. Depending on what you select in the Navigation pane and on your data center's organization, the membership graph can have a single object or many objects. To control the view, you have these options:
-
Use the scroll bars to move the display, bringing assets in large graphs into view
-
Use view controls to move the membership graph left and right, and up and down. These view controls are two sets of arrows: four inward arrows and four outward arrows. Click on one of the outward arrows to move the membership graph. Click on one of the inward arrows to center the graph in the center pane.
-
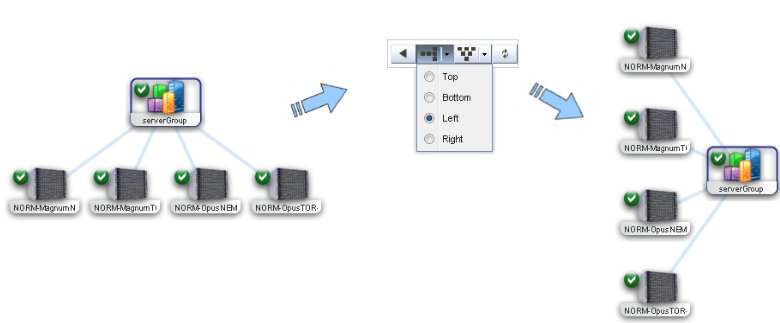
Change the orientation of the graph. The hierarchy can be presented from the top down or from the bottom up. If the hierarchy is flat and wide, a more convenient display might be to change to a horizontal display so that the top is now on the left or right. Click the left arrow to restore the display.
-
Drill into the graph. If you choose assets or a group at the top of a hierarchy, the membership graph consolidates the display of the assets so that the graph is not unwieldy. Click in the graph to show the actual members.
Figure 1-5 Changing Orientation of Membership Graph
Description of "Figure 1-5 Changing Orientation of Membership Graph"
In addition to showing the relationship among members, the lines that connect two members show the status of the relationship. A blue line is working connection and a red line is faulted or disconnection.
Actions and Jobs
You use the Action pane to manipulate assets and to issue commands. Your selections in the Navigation pane or center pane change the display in the Actions pane. Depending on the asset you select, the set of available actions change. An action is not available for these reasons:
-
You have not selected an asset that can perform that action. For example, you intend to perform an action on a server's operating system so you select the server. The action is not available until you select the operating system asset that is listed under the server.
-
Your user account's role does not allow the action.
At any time, if you are not issuing commands, you can increase the size of the center pane by hiding the text on the Actions pane. In the Action pane's title bar, click the right double-arrow to collapse the pane. The icons for the available actions are displayed but no text. To select another action, click on its icon or expand the pane by clicking on the left double-arrow button to be able to select the names of the actions.
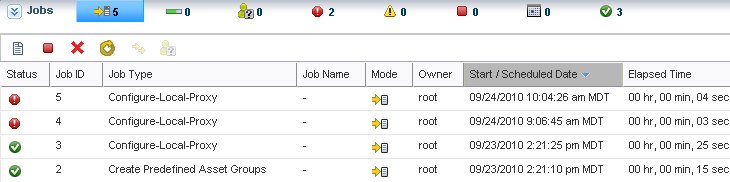
Every action creates a job. Many jobs can run at the same time and some jobs take longer than others to complete. The Job pane is at the bottom of the user interface and its default display is a count of all jobs, according to each one's status. To see the status type, hold or hover the mouse over the job icon. Some jobs have many steps and to follow the progress of a particular job, display the job details. Click on the Jobs title bar to expand the pane, click on the job, and then select the View Job Details icon.
Some actions creates the job immediately but, in many cases, you need to provide more information to specify the job. These actions launch a wizard to guide you through constructing the job. The last step of every wizard is a Summary page so that you can review your specifications before you create the job.
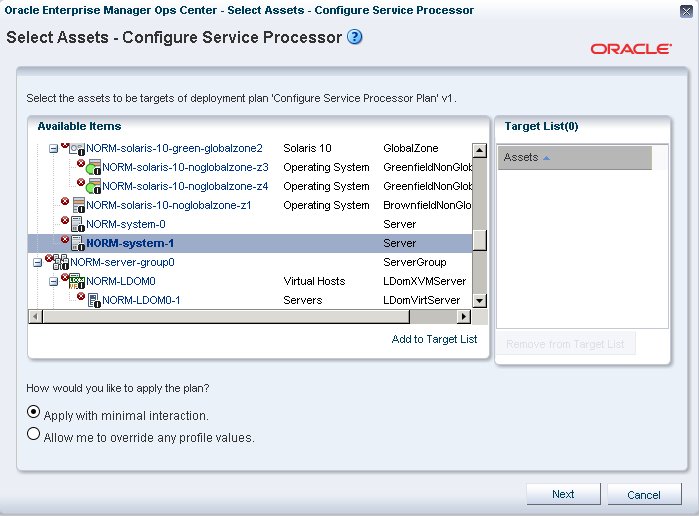
Complex operations or operations that you want to repeat many times are accomplished through plans. The actions are defined in the profiles that make up the steps of the plan. The Apply Deployment Plan wizard prompts you to identify an existing plan and then select the targets of the plan. Targets are the assets that you want the plan to act on. In the wizard, you select assets from the list of appropriate assets and click the Add to Target List button to include these assets in the Target list. You can select multiple assets or select them one at a time.
Tabs and Dashboards
The default display in the center pane is the Dashboard or a Summary, depending on the asset type.
Dashboards are a high-level overview of an individual asset or a group of assets. The information displayed is determined by the asset or group. Every group and managed asset has a dashboard that provides a summary, a membership graph, and the monitoring status. Additional information might be displayed, depending on the type of group or asset.
The Summary tab provides information on all members of a group and charts to identify the most active and least active members. To learn more information about the asset or details about information in the default display, click on one of the tabs. These tabs vary, depending on the asset type, and are explained in other sections of this guide. If there are too many tabs to fit into the center pane, click on the right double-arrrow button to bring the remaining tabs into view. Hold or hover the mouse over the value in the table to see its definition.
Charts are included in the Dashboard, Summary, and the Charts tab. These charts give you access to the information that Enterprise Manager Ops Center is collecting about all the assets all the time. Hold or hover the mouse over a portion of the chart to see the value it represents. On the Dashboard, you can hide the legend for a chart and you can hide the chart itself. You hide the legend if it is taking too much room and you want to see more detail in the chart. You hide the entire chart if it is not of interest at the time and you want to focus on another part of the center pane. Click on the down-arrow button to hide and click the right-arrow button to show. On the Charts tab, several charts are displayed. When you right-click on one of the charts, a submenu of the following actions is displayed so that you can change the chart:
-
Select to pick a point on the line and display its values.
-
Zoom to concentrate on a portion of the chart.
-
Move to change the location of the chart.
-
100% to restore the original chart.
-
Select All
-
Property to display a table of all the values in the chart You can control the scope of the chart by increasing or decreasing the time period of the data collection.
Group Dashboards
For a group of assets, the Dashboard tab displays a summary of the members of the group, how the members relate to each other and other managed assets in Enterprise Manager Ops Center, and a summary of known problems and their severity levels. You can drill down for more group details by clicking the Membership tab and the Problems tab.
A group dashboard contains the following information:
-
Group summary, including the type of group, the location, description, number of members, and a high-level summary of unassigned issues.
-
Membership graph, which provides a graphical representation of the group members and their relationships, and the monitoring status of each member.
-
Status, including a pie chart representation of all unassigned problems for the group, and a table of recent problems.
-
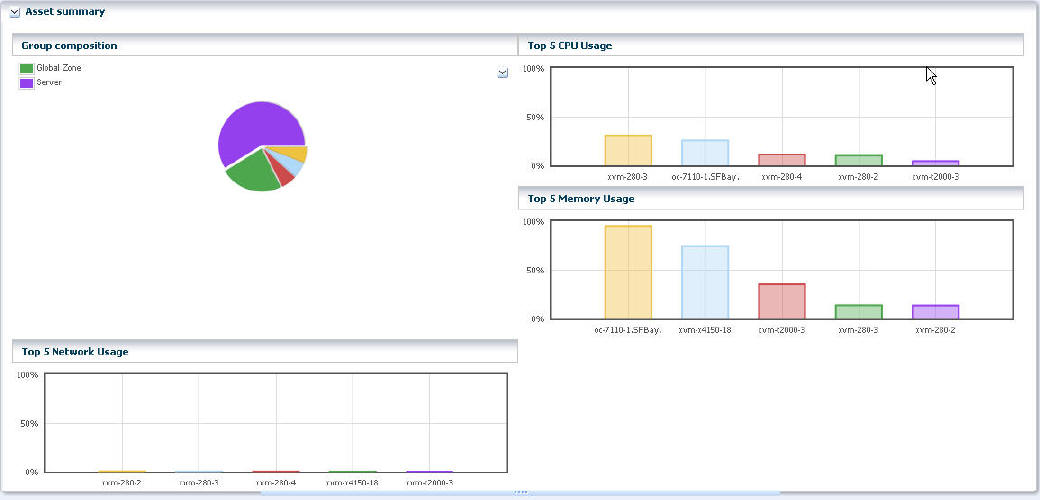
Asset Summary contents are determined by the asset type. The asset summary usually includes the group composition and the largest consumers of resources. For example, the summary might include the top five users of CPU, memory, network, and power.
Figure 1-8 shows the summary and membership graph sections of a dashboard. The summary includes group details and known problems. In this case, two warnings and three informational problems were detected for the group. The Membership Graph uses the problem status icons to indicate the member status. The Status section displays the unassigned problems, by severity, as a percentage of the total number of unassigned problems. It includes a pie chart representation of all unassigned problems for the group, and a table of recent problems. The information in this section includes the group composition and a graphical representation of the resources consumed by the top five assets. The resources displayed in these tables is determined by the type of asset. In this figure, the summary displays the top five users of CPU, memory, and network and the percentage used.
To view a higher level of detail about the group members, click the Membership tab. To view a higher level of detail about problems, click the Problems tab.
Asset Dashboards
For an asset, the Dashboard tab displays a summary of the managed asset, the relationships for the asset, and a summary of known problems and problem severity levels. You can drill down for more details by clicking the tabs in the center pane.
An asset dashboard contains the following information:
-
Asset summary, including the type of group, the location, description, and number of members
-
Membership graph, which provides a graphical representation of the relationships for the asset
-
Status, including a pie chart representation of all unassigned problems and a table of recent problems.
-
Compliance reports, which display the latest firmware and OS compliance reports that have been run on the asset.
Figure 1-9 shows the summary and membership graph sections of a dashboard for an operating system. The summary includes OS details and a summary of the unassigned problems. Some tabs are asset-specific and others are standard across asset types. The Dashboard, Summary, Problems, Monitoring, and Jobs, are standard.
Figure 1-9 Summary and Membership Graph of an OS Asset
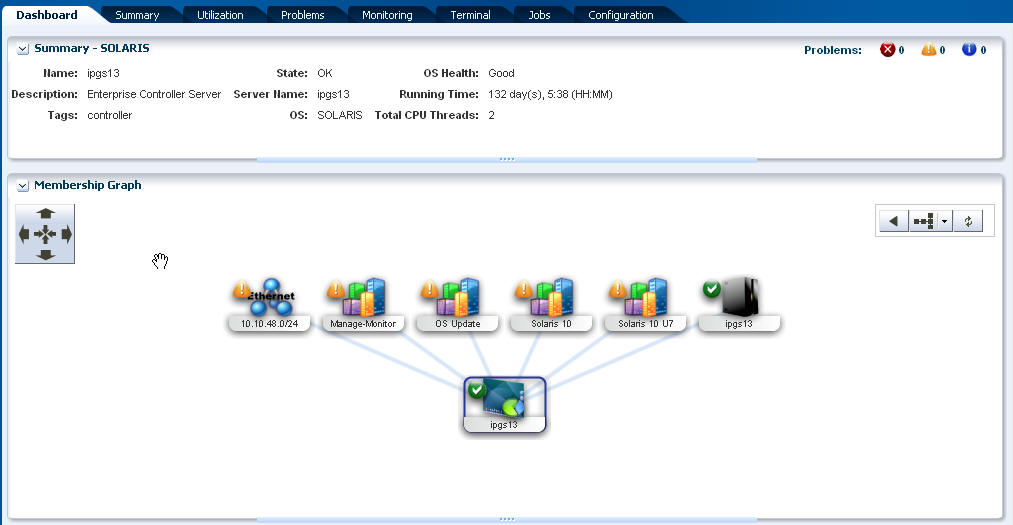
Description of "Figure 1-9 Summary and Membership Graph of an OS Asset"
You can drill down for more details by clicking one of the tabs in the center pane.
Viewing a Dashboard
-
Click Assets in the Navigation pane.
-
If you have user defined groups, the filter defaults to All User Defined Groups. To change the view, select an option, such as All Assets, from the drop-down menu.
-
Select a group or an individual asset. The Dashboard displays in the center pane.
-
(Optional) Click a tab to view greater detail. The Summary tab provides a high-level view of the asset's attributes. More details are available on the subsequent tabs.
Status of Your Session
Some icons are always displayed to show you the current status. In the title bar, icons report on the session. Some icons such as Help, current account, and Logout are familiar to users of any application.
The others show you the mode of the session:
-
Connected to or disconnected from Internet access
-
Connected to or disconnected from Knowledge Base Service
-
Connected to or disconnected from Enterprise Manager Ops Center Hosted Interface and Service Request
Below the title bar, a set of icons summarizes the Problems status. The number next to an icond indicates the number of assets reporting that condition. Hold or hover the mouse cursor over the icon to see information that identifies the most recent problem. These icons keep you updated while you perform other operations. To see information about the problems, click on the icon to change the display: the Message Center opens in the Navigation pane and the center pane shows the tables for that problem category.
Searching in Enterprise Manager Ops Center
The user interface provides several search functions:
-
In the Navigation pane, you can search for the asset that matches the string you enter. The first result is highlighted in the asset tree for your selection. The up and down arrows show you the next matching asset.
-
When All Assets is selected in the center pane, search fields are displayed in the Managed Assets, Available to be Managed Assets, and Unclassified Assets tabs. These search fields search only within the specified category.
-
The global search field, in the upper-right corner of the user interface, can search for any Managed Network, Storage Library, or Asset.
-
In the Jobs pane, you can search for the job that matches the string you enter.
Checking the Version Number of the Product Software
You might need to report the version number of the software. This version number is also the version of the Enterprise Controller. At any time, click on Administration in the Action pane. The center pane's default display is the Configuration tab for the Enterprise Controller and it displays the complete version number of the software, including the build number.