10 Monitoring the Topology Using Oracle Enterprise Manager Grid Control
Oracle Enterprise Manager Grid Control 11g with Oracle WebLogic Server Management Pack Enterprise Edition's capabilities include Exalogic-specific management tools to monitor Oracle software deployed in the Exalogic environment.
These monitoring capabilities expand on the existing Oracle WebLogic Server management features that span the following:
-
Application performance management
-
Configuration management
-
Service-level management and operations
These features improve the performance and availability of Java applications and web services, avoid downtime, and reduce cost by automating manual and error-prone operations.
The following are the new Exalogic-specific features offered by Oracle Enterprise Manager Grid Control:
-
View an Exalogic dashboard that shows the overall health, availability, and performance of all applications, Oracle WebLogic domains, and hosts running on Oracle Exalogic machine.
-
Drill down into application deployments to identify metrics and set thresholds.
-
Display alerts, policy violations, and incidents hierarchically across the Exalogic environment and provide operations with instant notifications in relation to service levels and thresholds.
-
Contextually drill down from the Exalogic dashboard and underlying menus into the detailed component and JVM-level performance metrics, configuration management, and provisioning and cloning that provide end-to-end management for operations and administrators.
This chapter includes the following topics:
-
Section 10.1, "Accessing Oracle Enterprise Manager Grid Control 11g"
-
Section 10.3, "Using Exalogic-Specific Pages in Oracle Enterprise Manager Grid Control 11g"
10.1 Accessing Oracle Enterprise Manager Grid Control 11g
You can access Oracle Enterprise Manager Grid Control 11g by navigating to the following URL:
http://<hostname.domain>:<port>/em
For example:
http://exalogic.mycompany.com:1159/em
The Resource Center is your central access point to Enterprise Manager documentation as well as the comprehensive technical resources of the Oracle Technology Network (OTN).
10.2 Discovering an Oracle Exalogic Target
You must discover the system targets for your Oracle Exalogic in the Enterprise Manager. To do so, complete the following steps:
-
Log in to Oracle Enterprise Manager Grid Control web interface. The home page is displayed.
-
On the home page, click the Targets tab, and then Systems.
The Systems page is displayed.
-
Scroll-down and select Exalogic Elastic Cloud next to Add.
-
Click Go.
The Discover Exalogic Elastic Cloud page is displayed.
-
Enter the following details:
-
Enter a unique name for the Oracle Exalogic target you want to monitor in the Name field. For example: Exalogic Enterprise Deployment
-
Select your Exalogic ID for the Oracle Exalogic machine you want to monitor. This ID is generated when you install Oracle Exalogic Machine.
-
-
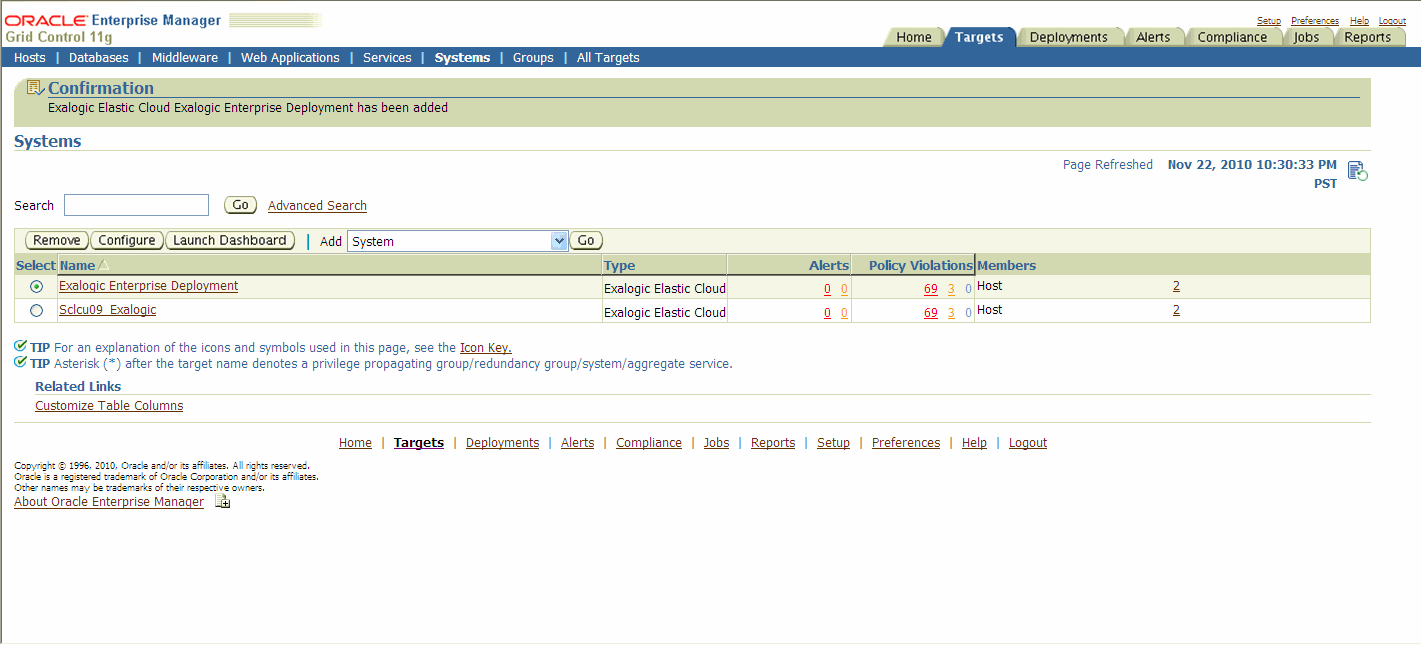
Click Finish.
A Confirmation page is displayed (Figure 10-1).
10.3 Using Exalogic-Specific Pages in Oracle Enterprise Manager Grid Control 11g
To navigate to the Exalogic-specific pages in Oracle Enterprise Manager Grid Control 11g, do the following:
-
Log in to Oracle Enterprise Manager Grid Control web interface. The home page is displayed.
-
On the home page, click the Targets tab, and then Systems.
The Systems page is displayed.
-
On the Systems page, select the target name for your Oracle Exalogic machine, such as
Exalogic Enterprise Deployment. This is the Target you have created in Section 10.2, "Discovering an Oracle Exalogic Target".The Oracle Exalogic Home page is displayed (see, Figure 10-2). This is the landing page for all Exalogic-specific monitoring and control operations, including configurations, application deployments, WebLogic domains, and metrics pages.
Figure 10-2 Oracle Enterprise Manager - Oracle Exalogic Home Page
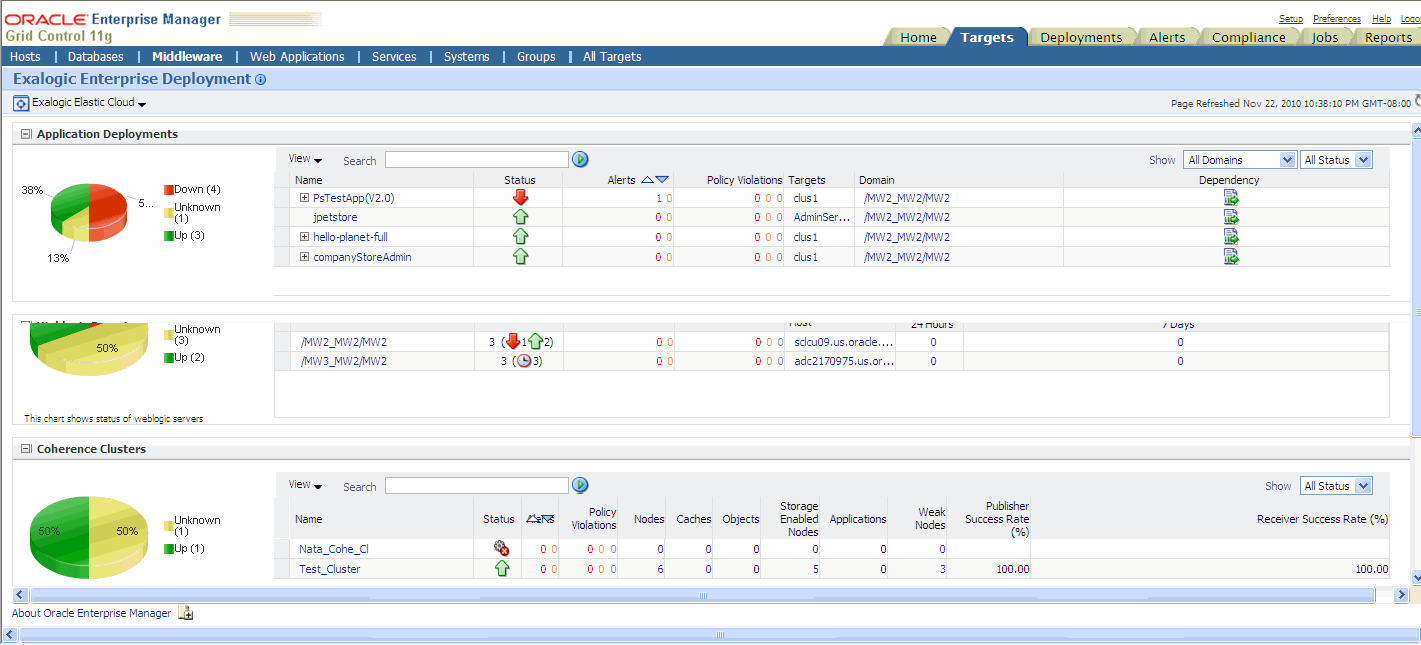
Description of "Figure 10-2 Oracle Enterprise Manager - Oracle Exalogic Home Page"
Oracle Enterprise Manager displays comprehensive metrics for Oracle Exalogic. When these metrics are displayed in tabular format, you can sort them in ascending or descending order. This feature enables you to find highest and lowest values easily.
The Oracle Exalogic home page, which is shown in Figure 10-2, displays various portlets. These portlets are described in the following sections:
10.3.1 Application Deployments
From Exalogic Elastic Cloud, click Application Deployments. The Application Deployments page is displayed.
Use the Application Deployments page to do the following:
-
View general information
-
View servlets, JSPS. and EJBs
-
View Work Manager
-
View alerts and policy violations
10.3.2 WebLogic Domains
From Oracle Exalogic, click WebLogic Domains.
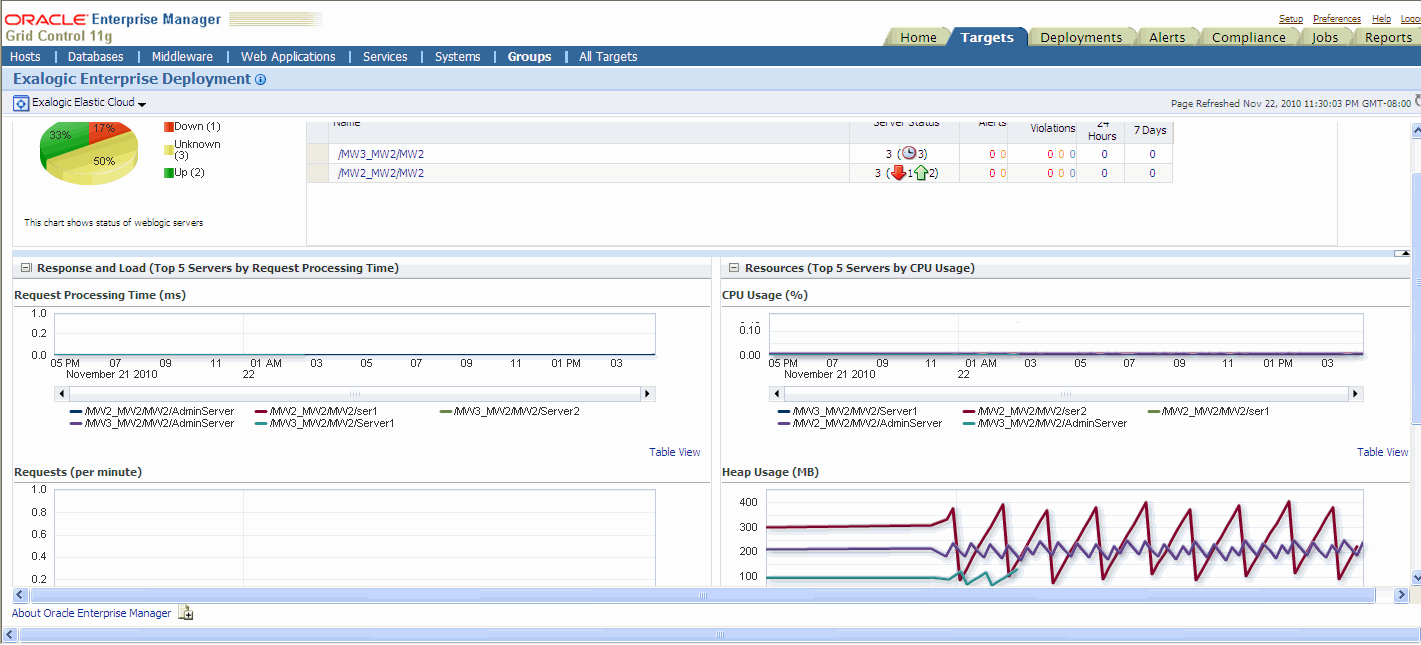
The Oracle WebLogic Domains page is displayed (Figure 10-4).
Use the Oracle WebLogic Domains page to do the following:
-
View information about the domain, such as status, alerts and policy violations, and configuration changes
-
View response and load information of the top 5 servers by average response times
-
View the resource usage of the top 5 servers by CPU usage percentage
-
See useful performance data related to JMS/JDBC/EJBs/JSPS and servlets of all servers across all domains
10.3.3 Coherence Clusters
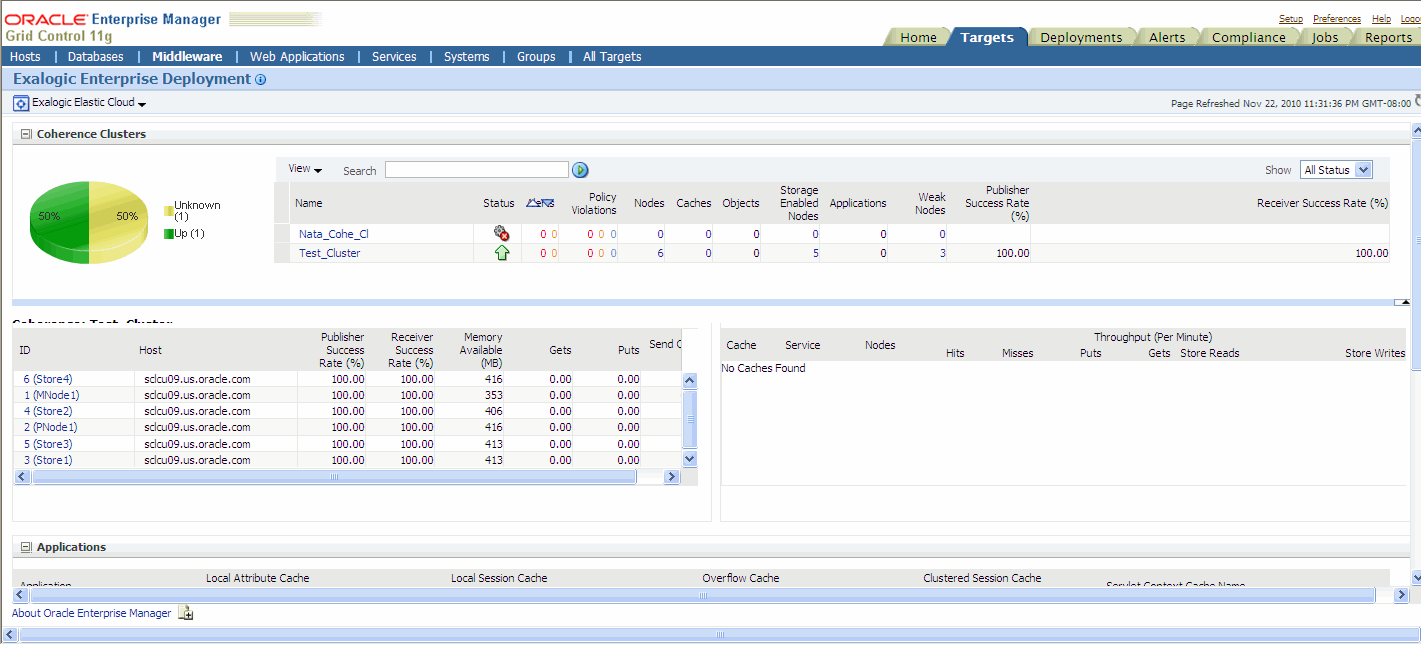
From Oracle Exalogic, click Coherence Clusters. The Coherence Clusters page is displayed (Figure 10-5).
Use the Coherence Clusters page to do the following:
-
View the Coherence Cluster name
-
View status, alerts, and policy violation
-
View number of nodes, caches, objects, applications, and weak nodes
-
View Storage Enabled Nodes
-
View publish success Rate and receiver success rate
10.3.4 Hosts
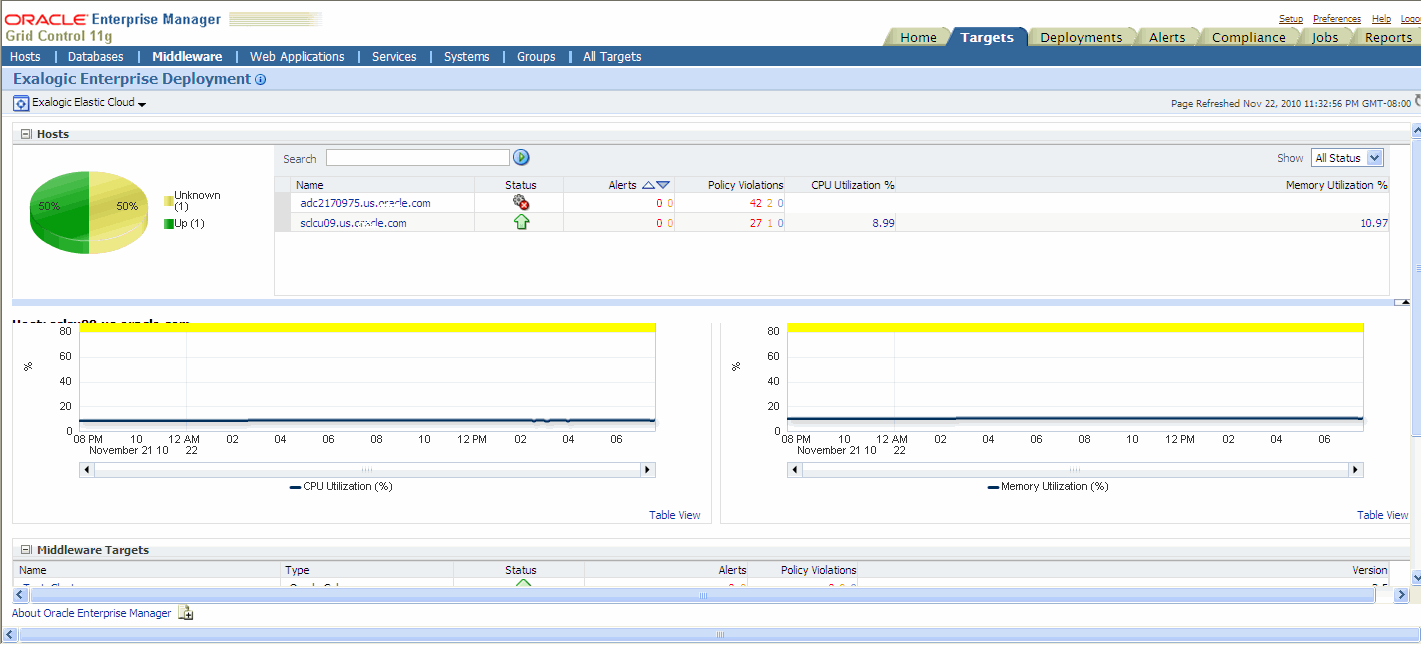
From Oracle Exalogic, click Hosts. The Host page is displayed.
The Host Home page provides a glimpse of the vital statistics for this host, which is part of the greater Enterprise Manager environment.
In the Host page, select the Host you want to monitor from the table. Details specific to the host you selected is displayed (Figure 10-6). Using the Host Home page, you can:
-
Drill down to view detailed statistics about this host
For example, by clicking the Local File Systems metric in the Configuration section, you can see a summary of the local file system space being used. On the ensuing page, when you click the percentage associated with a mount point, the Metric Detail page for that mount point appears.
-
Study the policy violations for the host
-
Study all the alerts associated with this host
-
Analyze the job activity
-
Determine whether there are outstanding patch advisories
-
Determine the last security evaluation of the host
-
Investigate further the health of the host
