Core Concepts
This chapter explains worksheets and other basic concepts.
This chapter covers the following topics:
- Worksheets
- The Basic Input Data
- Time Resolution
- Levels
- Combinations
- Series
- Filtering and Exceptions
- Methods
- Security
- Forecasting
Worksheets
A worksheet (sometimes known as a query) is the primary user interface to Demantra data. A typical worksheet might look like this:
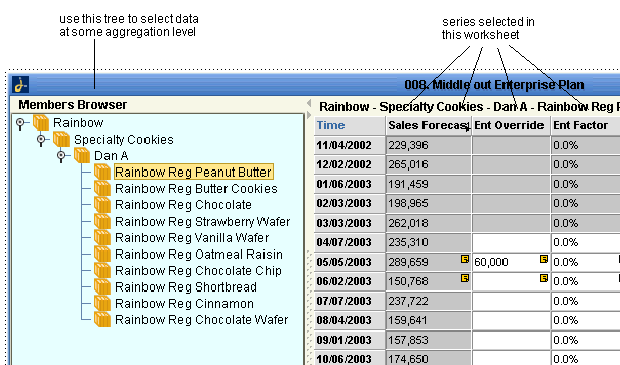
Within a worksheet, a user can examine and edit data as needed, view the forecast, run simulations, and save changes back to the database, for the benefit of other users and downstream operations. The precise details vary from application to application, but worksheets share the following characteristics:
-
Most of the worksheet data is usually based on imported data.
-
The data is organized in a set of multi dimensional hierarchies that enable users to slice and dice data in any way. These hierarchies are completely configurable and are easily extended.
-
A worksheet displays series of data, usually time-dependent data for specific items and locations. Some series are editable, and other are not.
-
A worksheet can display series at an aggregated level, based on any of the hierarchy levels in the system.
-
A user can zoom in and out in time, viewing data aggregated into different buckets of time.
-
At any given time, the worksheet uses a single unit of measure, which applies to some or all of the displayed series (some series do not include units). The worksheet can also use a financial index or exchange rate. The user who is working with the worksheet can switch to another unit of measure or another index as needed.
-
A worksheet can be filtered. In addition, users generally have access to only some of the data, and that filters the data further.
-
Multiple users can access the data, depending on their authorization.
For details, see “Worksheets”.
The Basic Input Data
When fully configured, Demantra imports the following data, at a minimum, from your enterprise systems:
-
Item data, which describes each product that you sell.
-
Location data, which describes each location to which you sell or ship your products.
-
Sales history, which describes each sale made at each location. Specifically this includes the items sold and the quantity of those items, in each sale.
-
For Promotion Effectiveness: Historical information about promotional activities.
Demantra can import and use other data such as returned amounts, inventory data, orders, and settlement data.
For details, see “Data Assumptions and Requirements”.
Time Resolution
Sales data is typically available at the daily (or sometimes hourly) level, but demand plans do not usually go down to that level of detail. When sales data is imported into Demantra, it is automatically binned into time buckets corresponding to the base time unit, depending on how you configure the system.
Specifically, when the sales data is imported, each sale date is changed automatically to the start date of the appropriate time bucket. For example, suppose you use a weekly base time unit, starting on Monday. If a sale actually happened on Wednesday, May 7, the sale date in Demantra is changed to Monday, May 5.
The base time unit is specified during configuration to a length that is appropriate for your planning cycle. Oracle provides three sizes of base time unit (day, week, or month) and can support hourly time units if needed.
Oracle also provides larger time units for use in worksheets, and you can define additional time units. You specify the time unit to use in a given worksheet, and the worksheet shows data for the time buckets that correspond to that time unit.
For details, see Time Units.
Levels
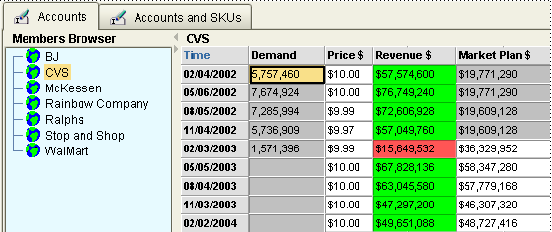
The first interesting feature of any worksheet view is the aggregation level or levels that it uses. For example, you might want to view data at the account level, as follows:
The worksheet might include a drop down list instead of this tree control.
For example:
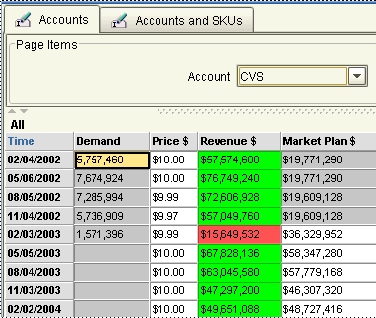
In either case, you can view data for any account. For example, for the quarter that started on February 3, 2003, the Demand for the CVS account was 1, 571, 396 units, and the unit price was $9.99. You can edit any data that is shown in white, such as the price and market plan.
In generic terminology, the word member refers to a unit within a level. For example, CVS is a member of the account level.
Levels are also used in import and export, security, and forecasting.
For details, see “Levels”.
Combinations
When users explore their sales data, they generally examine data associated with some item (or aggregation of items) at some location (or aggregation of locations). Each possible pairing of item and location is known as a combination.
Note: In theory, some implementations may have more than two chief dimensions. For example, you might track sales for items, locations, and demand types. In this case, a combination is an item, a location, and a demand type.
Combinations are central to Demantra. At any given time, a worksheet displays data for one combination at any aggregation level, for example:
-
Low fat items in Northeast stores
-
SKU PLLF202FCPB at CVS 0051
-
Private Label Brand cookies at the account Retailer D
-
Ice cream, aggregated at all locations
Selecting Combinations
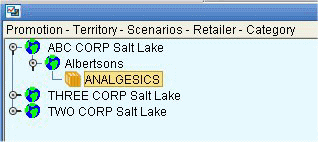
Apart from completely aggregated worksheets, each worksheet provides a way to select the combination to view. Demantra provides two equivalent mechanisms, as in the following examples.
Members Browser (available only in Web worksheets)
Drop down lists
![]()
In either case, the selected combination is “Low fat products at the BJ account.” The rest of the worksheet shows data for that combination.
In some cases, you view data that is aggregated across one dimension. For example, if the worksheet contains only the product family level, and you select the Low Fat member, that means that you have selected the combination “Low fat products at all locations.”
Combination Status
Not all items are sold at all locations. By default, Demantra stores only those combinations that have actual sales, and the Analytical Engine considers only those combinations. You can enable users to create new combinations, for simulation purposes; to do so, they use tools called Member Management and Chaining Management.
The Analytical Engine also considers the relative age of each combination, as well as other combination-specific details. For the details, see “Combination-Specific Settings”.
Series
A series is a set of data that represents some value that varies over time or that varies between item-location combinations (or most commonly, that varies in both ways). A worksheet displays the series data in a table, or in a graph, or both. The following shows an example of a worksheet table:
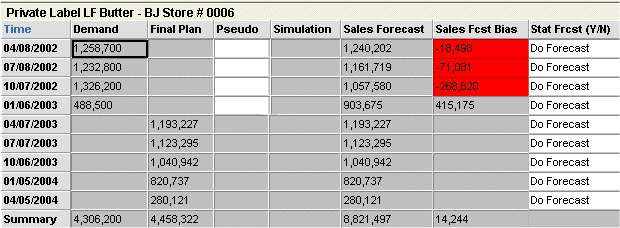
The example here shows series at the lowest level, but you can generally view data for any given series at any aggregation level. The definition of the series controls how the data is aggregated. Data can be aggregated in various ways, for example by totalling it, or by taking the maximum or the minimum value.
Series have many properties, including the following:
-
It is editable or non editable. Some series are editable only within certain spans of time or when certain conditions are met.
-
The data type: numeric, string , or date.
-
The series type. Most series apply to sales data, which means that the series data can be different for each item-location combination at each time bucket. Demantra provides other types of series as well; see “Types of Series”.
-
The series may or may not be stored in the database.
-
Its definition specifies how data for that series is to be calculated at any level or at any higher level time aggregation.
The Analytical Engine directly populates the data used in some of the base series:
-
For Demand Management, Demand Planner, and Demand Replenisher, these series include information about the forecast and related information such as markers that indicate regime changes, outliers, and so on.
-
For Promotion Effectiveness, these series include information about the forecast and switching effects that describe the impact of various promotions.
For details, see “Series”.
Filtering and Exceptions
Both filters and exceptions both limit the members that users can see. Filters act directly, and exceptions act indirectly.
Filters
Filters specify the members that users can see. When you apply a filter, you specify the following:
-
An aggregation level. You can filter data at any level in any dimension.
-
Specific members of that aggregation level that are allowed through the filter; other members are not included.
The net result is that a filter allows Demantra to display only certain item-location combinations.
Demantra uses filters in various contexts. In all cases, it uses a standard user interface to display a filter. In the following example, the filter blocks data for all brands except for the Rainbow brand.
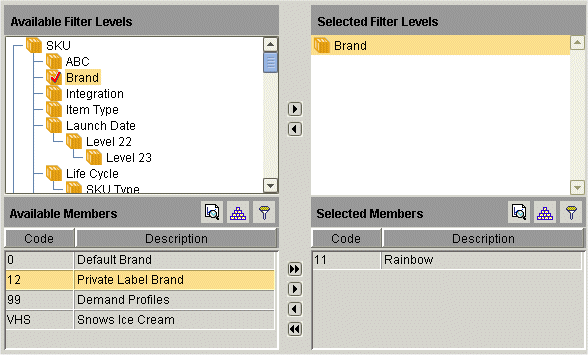
As a result, the worksheet will display only those item-location combinations that are associated with the Rainbow brand. You can filter data at any level, whether or not it is chosen as an aggregation level of the worksheet.
Exceptions
Exceptions (or exception filters) indirectly control which members the users can see. When you apply an exception, you specify a true/false expression that specifies a series, an operator, and a value, for example: Sales > 50000. A combination is displayed only if this expression is true for at least some of the time buckets in the time range of interest.
You can specify multiple expressions and relate them by logical AND or logical OR.

Methods
You can define level methods, which the user sees as ordinary right-click menu options in Demantra (either in worksheets or in Members Browser content panes). Each level can have its own set of methods. Demantra provides a set of default methods (Create, Edit, and Delete) that you can redefine or disable as needed.
Each method runs a workflow. In Demantra, a workflow is a logically connected set of steps. Each step can be automated or can require interaction from one or more users or groups. Demantra provides a set of workflow steps, each with predefined behavior.
Workflows can also be used for general automation purposes.
For details, see “Methods and Workflow”.
Security
The Demantra data and menus are secured, so that not all users have access to the same data and options. The security model includes the following features:
-
The Oracle license controls which menus are secured, so that not all users have access to the same data and options. The security model includes the following features:
-
The data is partitioned into components, which generally correspond to organizational roles. In the definition of a component, you can control the following:
-
The levels that can be seen
-
The degree of access for members of each level: no access, read-only access, read/write access, or full control (including the ability to delete members)
-
The series that can be seen
Each component has an owner, who acts as the administrator and who can create additional users:
-
-
Within a component, you can restrict each user to a subset of the data associated with that component. You can control the same data elements as previously described.
-
You can control access to menu items at the component level, the group level, or the user level. This includes both the menu bar and the right-click menu.
-
You can define program groups, or sets of menu items, and apply security at that level, for greater convenience.
For details, see “Security”.
Forecasting
The Analytical Engine reads data from the database, generates a forecast and performs other analyses, and writes the forecast to the database. This section provides a brief overview of the concepts.
Demand and Causal Factors
The forecast considers both the historical demand and the causal factors (such as seasons, price changes, and specific events such as promotions).
In a Demantra solution, the demand data is ultimately imported from external systems. Typically, the data that is actually imported needs to be adjusted by the forecasters, as they apply their own knowledge to better describe the history.
Causal factors provide information about historical events that are expected to recur in the future. Causal factors cause demand to deviate from a trend. More specifically, a causal factor is a time-varying quantity (such as promotions, price, season, or day of the week) that affects demand. Demantra requires historical data for causal factors, as well as future data that describes expected occurrences that will affect demand.
In the case of Promotion Effectiveness, you also configure promotional causal factors, influence ranges, and influence groups, all of which control how the Analytical Engine determines the effects of promotions on the forecast.
Engine Coefficients
As a result of the forecasting process, the Analytical Engine calculates a set of coefficients that describe how each causal factor affects demand for each item-location combination, over time. The Analytical Engine then uses those coefficients, along with future values for the causal factors, to calculate the forecast. The Promotion Optimization module also makes use of these coefficients.
Forecasting Models and the Forecast Tree
The Analytical Engine uses a set of mathematical forecast models. When forecasting, the engine follows a specific process of examining the data, checking for outliers and so on, evaluating the usefulness of each model, and generating the forecast.
In general, forecasting is most accurate when it can be performed at the lowest possible allowed aggregation level. However, sometimes there is not enough data at that level for all combinations. For those combinations, the Analytical Engine aggregates the data to a higher level and tries to generate a forecast there. The purpose of the forecast tree is to organize data for this process. Each node in the forecast tree aggregates both by items and by locations. The following example shows a small part of a forecast tree.

The bold boxes show the nodes at which the Analytical Engine is forecasting in this example.
Parameters and Engine Profiles (PE)
Demantra provides parameters to control both the theoretical models and the overall engine flow.
The engine uses engine profiles, which are sets of engine parameters with specific values. Demantra provides some predefined profiles for different purposes, and you can define additional engine profiles, as needed. When you run the engine, you specify the engine profile to use.
Batch and Simulation Modes
The Analytical Engine runs in two modes:
-
When a forecast is made in the batch mode (in the background), the Analytical Engine creates a forecast for all item-location combinations within the forecast tree. You configure Demantra to run the Analytical Engine periodically, usually after importing new data.
-
If the Analytical Engine is running in simulation mode, it waits for simulation requests and then processes them.
From within a worksheet, a user submits a simulation request to create a tentative forecast for a subset of the data. The user can then accept or reject the results of the simulation. In this mode, the user is usually performing a “what if” analysis. That is, he or she has made some changes within the worksheet and then performs the simulation to see whether those changes have the desired effect.
See Also
“Introduction to the Analytical Engine”.