Series
This chapter covers the following topics:
- Introduction
- Main Series Options
- Data Types of Series
- Types of Series
- Update Field
- Editability
- Series Calculation: Server Expressions
- Series Calculation: Client Expressions
- Series Calculation: Using Both Server and Client Expressions
- Series Calculation: Proportionality Option
- Summary of Calculation Options
- Display Properties
- Color Expressions
- Display Precision and Format
- Display-Only Summaries
- Configuring the Display-Only Summary
- Other Basic Series Options
- Advanced Series Options
- Preserving Promotional Data While Moving or Copying
- The Aggregated Base Level Option
- Extra From and Extra Where
- Note and Promotion Indicators
- Series Groups
- Configuration Notes
Introduction
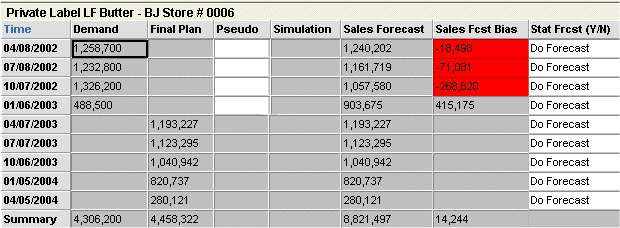
A series is a set of data that can be displayed in a worksheet table or graph, at any aggregation level. The following example shows several series displayed at the lowest level:
Main Series Options
When you define a series, you specify many options. To start, the following list gives an overview of the main, interrelated options:
-
An external and an internal identifier. The external identifier appears in worksheets, and you use the internal identifier when you refer to the series in server expressions.
-
The data type of the series.
-
An option that controls the type of series. For example, some series are associated with sales; these series potentially have different values for each time bucket and each item-location combination. (If you are familiar with database terminology, note that this property determines the primary key of the series.)
-
An option that controls whether the series is stored in the database or not. If a series is stored in the database, the series has an update field, which is the database column that stores the series data.
-
Options that control whether the series is editable, and if so, under what conditions.
-
Options that control how the series is calculated at any aggregation level and how series data is split to the lowest level. These options include the server expression, the client expression, the proportionality option, and the proportions reference series.
The following sections discuss these options. Additional options are discussed later in the chapter.
Data Types of Series
Demantra supports the following data types for series:
-
Numeric
-
String
-
Date
Note: The desktop products (Demand Planner and Demand Replenisher) can display only numeric series.
Types of Series
Demantra supports the following types of series:
Note: The desktop products (Demand Planner and Demand Replenisher) can display only sales and matrix series.
Update Field
A series may or may not be stored in the database. If it is stored, its data is saved in the series update field. This option is known as the update field because it refers to the field that is updated when changes are saved to the database.
When you use the Business Modeler to configure a series, it automatically adds the update field if needed.
Although you generally should avoid working directly in the database, when you configure series, you need to write SQL expressions to aggregate data from the tables in which the series are stored. Depending on the type of series, the update field is in one of the following tables:
| For sales series | sales_data |
| matrix series | mdp_matrix |
| promotion series | promotion_data (not promotion as implied by the Business Modeler) |
| For level series | Table associated with the level. |
Demantra provides an alias (branch_data), which you can use to refer to sales_data or promotion_data.
Editability
You control whether a series is editable in a combination of the following ways:
-
You can make an entire series editable or non-editable with a single setting.
-
You can control the time periods during which a series is editable. To do so, you specify whether the series is associated with history, forecast, or history and forecast. For an editable series:
-
If the series is configured as history, then it is editable only in the current time bucket and previous time buckets.
-
If the series is configured as forecast, then it is editable only in the current time bucket and future time buckets.
-
If the series is configured as history and forecast, then it is editable for all time buckets.
-
-
You can apply an edit-lock expression to the series to further restrict editing. An edit-lock expression evaluates to true or false; for each cell where the expression is true, that cell is locked.
Series Calculation: Server Expressions
A server expression must be an aggregating SQL expression that returns to a value with length greater than zero for each element. (If you never plan to use the series within a cached worksheet, it can return null or a zero-length value; but you may not be able to prevent the series from being misused.)
A server expression must have one of the following forms:
aggregate_function (branch_data.database_column * #UNIT#)
aggregate_function (branch_data.database_column)
aggregate_function (mdp_matrix.database_column * #UNIT#)
aggregate_function (mdp_matrix.database_column)
aggregate_function (other_expression)
Here:
-
aggregate_function is one of the SQL aggregating functions, most commonly sum.
-
database_column is a column of the branch_data or mdp_matrix table, most often the update field that corresponds to this series. That is, if SeriesA is associated with branch_data.SeriesA, then the server expression for SeriesA could be sum(branch_data.SeriesA)
Note: branch_data is a synonym for the sales_data table or the promotion_data table.
-
#UNIT# represents the unit conversion factor. Within a worksheet, this token is automatically replaced by the conversion factor that corresponds to the unit that the worksheet is currently using.
In turn, other_expression can be made up of some or all of the following components:
-
Other SQL functions.
-
Constants and expressions that have numeric, string, date, and true/false values.
Note: Enclose any literal negative value within parentheses, as in this example: (-0.33)
-
Operators such as +-*/.
-
Demantra tokens such as #UNIT#.
-
Columns of the branch_data and mdp_matrix tables.
Note: These column references must explicitly have the table name (or branch_data) included.
You can use parentheses to control the precedence of calculations, according to standard algebraic rules.
Caution: SQL expressions have a limit of 3000 characters. To avoid reaching this limit, use small field names.
For information on the supported operators, tokens, and SQL functions, see “Server Expression Functions and Operators”.
Forecast Versions
Each time the Analytical Engine runs, it generates a forecast. Each forecast is associated to the engine profile used to create it. The default profile being used is the Batch profile. In addition, each forecast generated receives a forecast version. The most recent forecast is version 0, the previous one is version 1, and so on.
Each series can be implicitly or explicitly associated with a specific forecast profile and version, or possibly with several. Typically, the large majority of series are associated with the most recent forecast generated using the base profile, but it is often useful to configure some series to capture information associated with a previous forecast, or to compare forecasts generated using different profiles.
You can include forecast profiles and versions, if needed, in the server expression for the series. When you specify a server expression, you should specify the forecast version and engine profile used to generate it. To do so, you use the #FORE@<Version>@<Engine Profile># token. The worksheet mechanism will dynamically replace this token with the appropriate forecast. For example, #FORE@0@25# is replaced by the current forecast version generated by using engine profile 25, and #FORE@1@52# is replaced by the most recent previous forecast version generated using engine profile 52. If the engine profile is not designated in the token, the token will default to the base forecast profile.
The server expression can refer to multiple forecast versions, for example, to compare them.
In the case of Promotion Effectiveness, the forecast details are more complex, because the Analytical Engine decomposes the forecast into multiple effects. Therefore, Oracle Demantra provides tokens such as #SW_BRAND@<Version>@<Engine Profile># and #SW_CHANNEL@<Version>@<Engine Profile># for these separate effects. See “Server Expression Functions and Operators”.
Note: Within the hint message for a series, you can include the token #FDATE@<Version># to refer to the date on which a forecast version was generated. This can be very useful to the users of the worksheets.
Units of Measure
You can include the #UNIT# token, if needed, in the server expression for the series. At any time, a worksheet uses one unit of measure, which is used by most of the numeric series in that worksheet. The user can switch to another unit of measure, and all those series are correspondingly scaled by the appropriate conversion factors.
Note: You can instead hard code the unit into a series definition, so that it expresses, for example, the buyback per case. Whatever your choice is, be sure to give useful names and hints to the series.
For more information on units, see “Introduction”.
Series Calculation: Client Expressions
A client expression uses Demantra functions. The client expression can be made up of some or all of the following components:
-
Constants and expressions that have numeric, date, true/false or null values.
Note: Enclose any literal negative constant within parentheses, as in this example: (-0.33)
-
Demantra functions.
-
Operators such as +-*/.
-
References to other series. To refer to a series, you use the name of the series.
-
References to series at other time periods. Here, you use the following syntax:
series_name [relative-time-bucket]
An expression like this is sometimes called a vertical formula. For example: Sales [-1] refers to the Sales series for the previous period. Sales [1] refers to the Sales series for the next period. [0] is not allowed.
Here relative-time-bucket must be any of the following:
-
An integer
-
A series name
-
A simple expression using integers, series names, and the basic mathematical operators.
For information on the supported operators and functions, “Client Expression Functions and Operators”.
Time-Shifted Client Expressions (Vertical Formulas)
When a client expression includes a reference to another series, by default, Demantra uses data from the same time bucket. You can refer to data from earlier or later time buckets, however. The following example shows three series, each of which has a client expression that refers to the Example series.
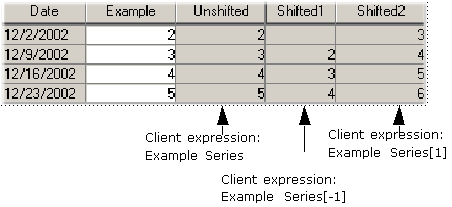
Notice that the series Shift1 is null for 11/25/3002. This is because this cell refers to the Example series at a time bucket that is not displayed in the worksheet.
Null Sales Records and Time-Shifted Client Expressions
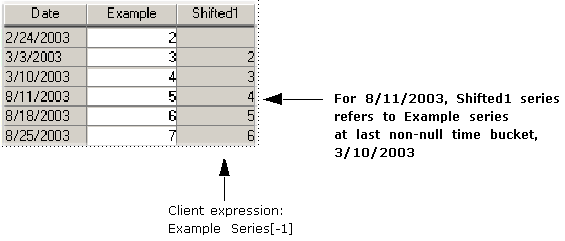
You do not typically have sales records for all combinations for all dates. This affects client expressions that refer to series at other time buckets. When a client expression refers to a time bucket that does not have sales data, Demantra automatically uses the next available non-null sales data. The following figure shows an example:
Using Expressions to Refer to Time Buckets
The previous examples have used the simplest syntax for time-shifted client expressions, in which you use an integer to refer to the relative time bucket. You can instead use simple expressions that include series names, integers, and mathematical operators. For example, if you have series A, B, C, and D, the client expression for D could be something like the following: A[B+C]
For example, suppose you want to know how much inventory your warehouse will contain on a given date. The date is determined relative to today based on both the production lead time and the transportation lead time. That is, you want to know Inventory[Production lead time + Transportation lead time].
Precedence of Calculations for Client Expressions
The following rules apply for the recalculation order, and will be performed recursively:
-
The system looks for vertical formulas, which use data in other time buckets. Such as formulas either use a function such as FSUM or they reference data in time buckets: Demand [2].
-
The system calculates the data series that are the source for those in the Step 1.
-
The system calculates the data series of Step 1.
-
The system calculates the series that use the series in Step 1 as source.
-
The system calculates the series that are the result of Step 4, and so on.
Series Calculation: Using Both Server and Client Expressions
It is important to understand how server and client expressions are used in combination. All series must have a server expression, although the expression is not always important. The client expression always takes precedence. That is, the client expression, if present, is evaluated, displayed, and stored in the database, instead of the server expression.
If a series has a client expression, the series should be configured in one of the following ways:
-
The server expression is trivial. For example, it is a constant such as 0. Because this value is never meant to be seen or stored, the specific value is irrelevant.
-
The server expression is meaningful and useful in some cases. In this case, the client expression consists of a conditional expression of the following general form:
If (condition, client-expression-value, series-name)
Here series-name is a reference to the same series to which this client expression applies. This reference directs Demantra to the server expression that this series uses. Depending on whether the condition is true for a given cell, this expression returns either the client expression value or server expression value.
Note: In some cases, it is useful for a client expression to null out data in the worksheet table in situations where the data might be confusing.
There is another important difference between server and client expressions, as far as end users are concerned. Server expressions are evaluated in the background and the resulting changes are not available instantly in the worksheets. Client expressions, on the other hand, are evaluated immediately.
In many cases, a server expression and a client expression can be mathematically equivalent, but the client expression might be more user-friendly.
Series Calculation: Proportionality Option
When you define a series as proportional, you need to choose the proportional by series from a series dropdown. For a series to show up in the dropdown, it must have a non-zero/not null server expression It does not have to be proportional; a proportion by series does not need to be proportional itself.
In general, the definition of a series also specifies how to calculate data at the lowest level, in the case when data changes at a higher level. Data can potentially change at a higher level either when it is imported at a higher level or when users edit a series while displaying data at a higher level.
Each series can be configured as proportional or non-proportional.
-
If a series is proportional, the parent value is split among the child members according to the proportions of those child members.
-
If a series is non-proportional, the value for each child member is set equal to value of parent.
When you configure a series as proportional, you also specify a proportions reference series. For best performance, Oracle recommends the following:
-
Proportions from the same table are better than proportions from a different table.
-
If the proportions are not in the same table that stores the series that uses those proportions, consider caching the proportions into the same table that stores the series. For example: create a cache of GLOB_PROP in sales_data and promotion_data.
-
Use PROPORTION_COLUMN when the proportions are from the same table and do not require a server expression.
-
Use a series that is not empty (most of the time) for the proportion reference.
Supported Proportion Configuration
The series available in the proportional series dropdown depend upon the table on which the series is defined.
The series listed in the dropdown are also filtered by the table on which the proportional series exists:
-
Series on sales_data: Can be split by any series with Item or Location levels, for example, sales_data, and mdp_matrix,
-
Series on a data table: For example, promotion_data can be split by sales_data, mdp_matrix, Item or Location levels, and its own base level.
-
Series on level: All levels with the same base level as the level and lower or equal aggregation to the series level.
-
Series on mdp_matrix: Can be split by any series with Item or Location levels, for example, mdp_matrix except for sales_data,
Summary of Calculation Options
When you configure a series, you have many options to set, and not all the combinations are useful. This section summarizes the useful combinations of the most important series options.
Combinations of Key Series Options
The following table summarizes the combinations of the most important series options:
| Expression | Update field | Proportional | Editable |
|---|---|---|---|
| Server only or Server and client | Yes | Depends on the nature of the server expression | Editable or non-editable* |
| No | Non-proportional only | Probably should be non-editable. | |
| Client only (server expression is trivial and its value is never seen) | Yes | Depends on the nature of the client expression | Non-editable only |
| No | Non-proportional only | ||
| *Depending on how the series is configured, it may be necessary to ensure that data changes only at the lowest level. Apart from those cases, these series can be either editable or non-editable. |
When to Configure a Series as Proportional
The following table indicates when to make a series proportional:
| Update field | Form of expression* | Proportional | Editable | If data changes at a higher level... |
|---|---|---|---|---|
| Yes | SERVER: sum (table_name.update_column_name) |
Should be proportional | Editable or non-editable | Lower levels are calculated by splitting the higher-level value according to the proportions in the Proportion Calculation series. |
| SERVER: avg (table_name.update_column_name) max (table_name.update_column_name) or min (table_name.update_column_name) |
Should be non-proportional | Editable or non-editable | Value for each lower level is set equal to value of parent level. | |
| Any other expression | Should be non-proportional | Should not be editable except at lowest level | Undesirable behavior occurs. | |
| CLIENT: Name of a proportional series |
Should be proportional | Non-editable | Lower levels are calculated by splitting the higher-level value according to the proportions in the Proportion Calculation series. | |
| CLIENT: Any other expression |
Should be non-proportional | Non-editable | Value for each lower level is set equal to value of parent level. | |
| No | Any | Must be non-proportional | Non-editable | Undesirable behavior occurs. |
| *Where table_name.update_column_name is the update field for this series. In all cases, the expression can also include the token #UNIT#, which represents the unit conversion factor. For example: sum (table_name.update_column_name * #UNIT#) |
Useful Series Configurations
For any series, data can safely be changed at the lowest level. Depending on how the series is configured, it may or may not be safe to change data at higher levels.
The following table indicates which series configurations support data changes at higher levels:
| Update field | Form of expression* | Proportional | If data changes at a higher level... |
|---|---|---|---|
| Yes | Server expression: sum(table_name.update_column_name) |
Should be proportional | Lower levels are calculated by splitting the higher-level value according to the proportions in the Proportion Calculation series. |
| Server expression, any of the following: avg (table_name.update_column_name) max (table_name.update_column_name) or min (table_name.update_column_name) |
Should be non-proportional | Value for each lower level is set equal to value of parent level. | |
| Any other expression | Should be non-proportional | Undesirable behavior occurs. | |
| Client expression: Name of a proportional series |
Should be proportional | Lower levels are calculated by splitting the higher-level value according to the proportions in the Proportion Calculation series. | |
| Client expression: Any other expression |
Should be non-proportional | Value for each lower level is set equal to value of parent level. | |
| No | Any | Must be non-proportional | Undesirable behavior occurs. |
| *Where table_name.update_column_name is the update field for this series. In all cases, the expression can also include the token #UNIT#, which represents the unit conversion factor. For example: sum (table_name.update_column_name * #UNIT#) |
Series That Can Be Changed at Any Level
For any series, data can safely be changed at the lowest level. Depending on how the series is configured, it may or may not be safe to change data at higher levels.
The most common series are the ones that are configured so that the data can be changed at any level. Remember that data can change for many reasons, by editing within a worksheet, by importing changed data, or by changing data from which the series is derived.
| Update field | Proportional | Form of expression | *If data changes at a higher level... |
|---|---|---|---|
| Yes | Proportional | SERVER: sum (table_name.update_column_name) Where table_name.update_column_name is the update field for this series. |
Lower levels are calculated by splitting the higher-level value according to the proportions in the Proportion Calculation series. |
| CLIENT: Name of a proportional series |
|||
| Yes | Non-proportional | SERVER: avg (table_name.update_column_name) max (table_name.update_column_name) or min (table_name.update_column_name) |
Value for each lower level is set equal to value of parent level. |
| CLIENT: Any other expression |
*Where table_name.update_column_name is the update field for this series. In all cases, the expression can also include the token #UNIT#, which represents the unit conversion factor. For example: sum (table_name.update_column_name * #UNIT#)
Series That Must Be Changed Only at the Lowest Level
If a series is configured in the following ways, it should be edited or changed only at the lowest level:
| Update field | Form of expression | Proportional |
|---|---|---|
| Yes | Any expression other than the ones in “Series That Can Be Changed at Any Level”. | Should be non-proportional. Otherwise, undesirable behavior occurs. |
| No | Any | Must be non-proportional. |
Calculating Data at Lower Levels
For a series that has a server expression and that is stored in the database, Demantra needs to know how to calculate data at lower levels if data changes at a higher level. When you configure a series, you specify whether the series is proportional. The following table shows which series should be proportional and explains how these series behave.
| Form of server expression | Proportional | If data changes at a higher level... |
|---|---|---|
| sum (table_name.update_column_name) Where table_name.update_column_name is the update field for this series. |
Series should be proportional. | Lower levels are calculated by splitting the higher-level value according to the proportions in the Proportion Calculation series. |
| avg (table_name.update_column_name) max (table_name.update_column_name) or min (table_name.update_column_name) Where table_name.update_column_name is the update field for this series. |
Series should be non-proportional. | Value for each lower level is set equal to value of parent level. |
| Any other expression | Series should be non-proportional. | Data should not be changed except at lowest level. |
Display Properties
You can control how Demantra displays each series in a variety of ways.
Color Expressions
Any series can have a color expression, which controls the background color of the series when displayed in a worksheet table.
Display Precision and Format
For each numeric series, you can specify the format that worksheet tables should use when displaying the series. By specifying this format, you are also implicitly specifying the maximum possible size of numbers in the series.
For example, if the display format of a series is ##,###.##, the maximum size of a number in this series is 99999.99.
Display-Only Summaries
Summary rows may appear in a worksheet as either rows or columns, or both as shown in the example below:
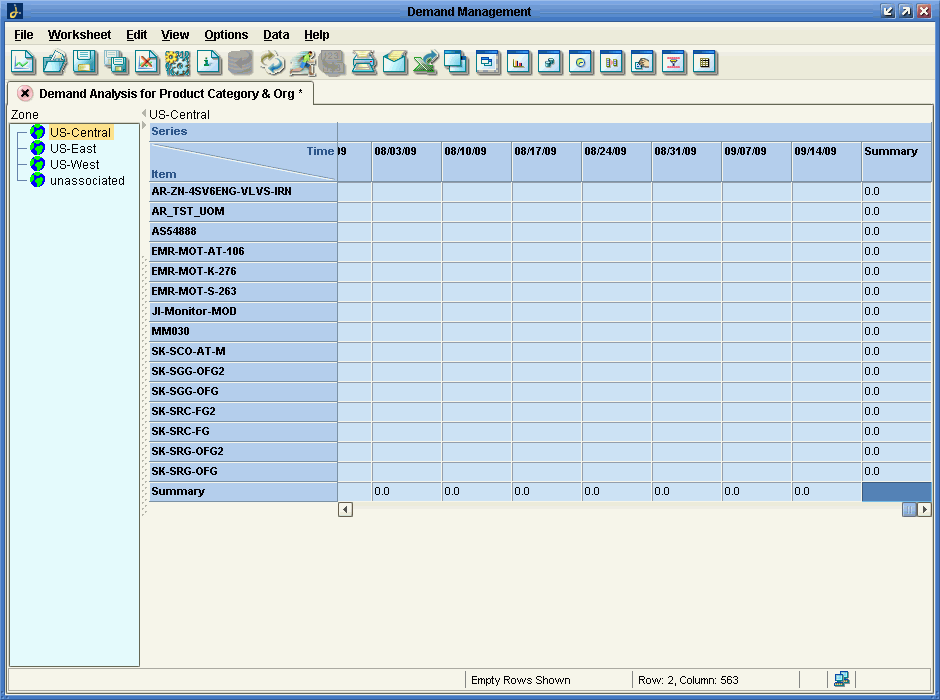
For each series, you also can specify a summary function or expression for use only within the worksheet. The following figure shows examples of Total and Average, in a worksheet:
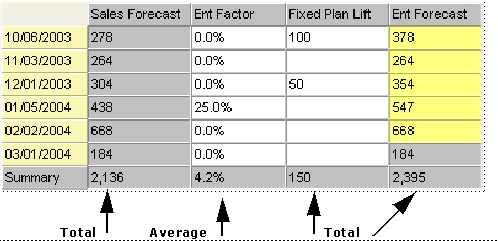
The summary is only for display and the results are not stored in the database. However, to avoid user confusion, you should probably summarize data in a manner consistent with the server or client expressions you define for this series; see “Series Calculation: Using Both Server and Client Expressions”.
For example, if you define this series by a server expression that sums data, the summary function should probably be Total.
The worksheet table may also include subtotal rows. The following shows an example:
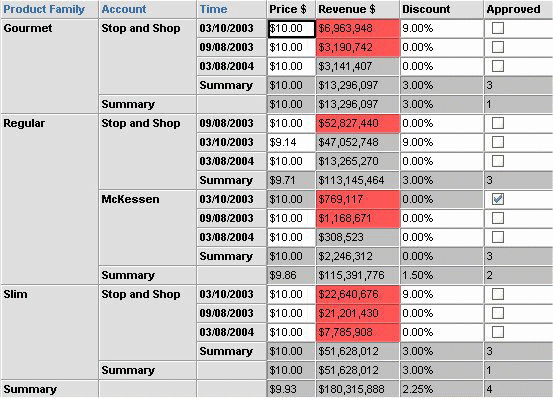
A given series can be summarized in different ways within a single worksheet table, although that usually means that the series is useful only within that worksheet.
Configuring the Display-Only Summary
You can customize the summary line to provide flexibility in cross tabulating columns/rows, and reporting purposes. These customizations include:
-
Hiding or showing the summary
-
Freezing the summary in a particular place on the worksheet
-
Setting the summary location
To toggle the Summary Line
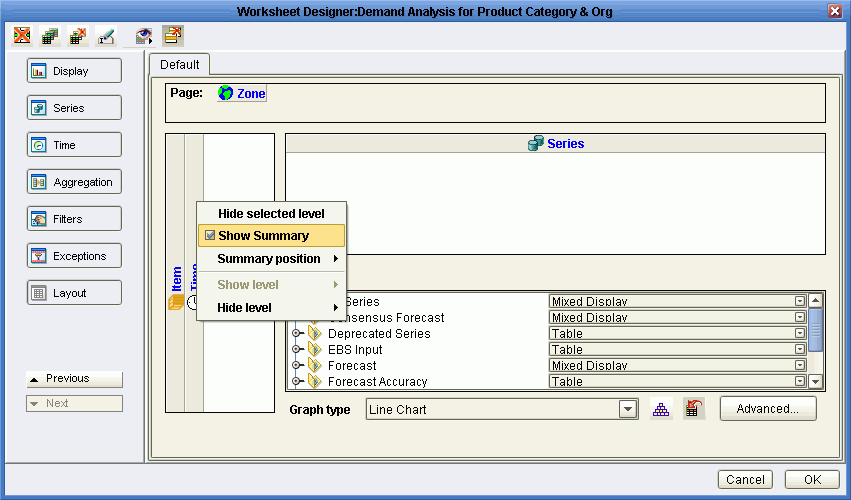
It is often desirable to eliminate the summary line within a given section of the cross-tabulated worksheet. For example, you may not wish to see a summary of all promotions within a scenario because a separate view is used for this purpose.
-
From the Collaborator Workbench, open the worksheet whose summary line you want to configure.
-
From the Worksheet menu, choose Layout Designer.
The Worksheet Designer appears.
-
Click the Layout button.
-
Right-click on the series that you want to configure, and either enable or disable the Show Summary check box.
-
Click Ok.
The worksheet is refreshed to show or hide the summary line.
Freezing the Summary Line
If there are many rows in a table, it is useful to display the worksheet summary as the top row and then freeze that row so that it remains in position as you scroll down the page. Only the overall summary of a worksheet is freezable. The overall summary corresponds to the outermost summarized level. Only summary rows on the top row or left-most row can be frozen. Otherwise, the menu option is disabled.
-
From the Collaborator Workbench, open the worksheet whose summary line you want to configure.
-
From the View menu, choose Freeze Overall Summary.
To set the Summary Line position
-
1. From the Collaborator Workbench, open the worksheet whose summary line you want to configure.
-
2. From the Worksheet menu, choose Layout Designer.
The Worksheet Designer appears.
-
Click the Layout button.
-
Do one of the following:
-
To set the summary row to the right or left of the worksheet, right-click on a series in the horizontal series list and then choose Summary Position> Left or Right.
-
To set the summary row to the top or bottom of the worksheet, right-click on a series in the vertical series list and then choose Summary Position> Top or Bottom.
The worksheet refreshes to display the summary position in its new location.
-
Other Basic Series Options
This section discusses other basic options you can use when configuring series.
Drop-down Lists
A series can be configured as a drop-down list, which means that when the series is displayed in a worksheet, each series cell includes the same drop-down list of choices. When a user includes the series in a worksheet, he or she can set the value of a series element by selecting from the list, if the series is editable.
Typically each list element is a text string that has a corresponding numeric value. When the user chooses a list element, Demantra finds the corresponding numeric value and sets the series value equal to that.
To configure the drop-down list for a series, you can use any of the following:
-
A table that exists in the Demantra database.
-
A level.
-
A list that you enter directly in the Business Modeler for use by this series.
All three variations behave in the same way.
Scaling
If the series is numeric, it can be configured as scaled. At any time, a given worksheet uses a single scaling factor. The user chooses this factor and Demantra automatically divides all numbers in the worksheet by that factor, except for any series that are marked as "unscaled".
Caching by Item
A series can be cached (aggregated by item and cached in the branch_data_items table). This improves performance of worksheets that are aggregated across locations and that do not have any location or matrix filtering.
Advanced Series Options
On occasion, you may need to consider the more advanced options for series.
Preserving Promotional Data While Moving or Copying
When you copy and paste a promotional level, Demantra copies data for the promotional series, as well. The span of time of time of the new copy might not be the same as the span of time of the original, so the definition of each series needs to specify how to perform the computation. Similarly, when a user changes the length of a promotion, Demantra adjusts the associated promotional series data.
There are two preservation types:
-
Copy/Paste preservation type
-
Move preservation type
The settings should be consistent with the rest of the settings for the series. The following guidelines are suggested:
| Option | Meaning | Suggested Series Type | Suggested Aggregation Function |
|---|---|---|---|
| As Is Preservation | Demantra shifts the data to the new dates but makes no other changes. If the new date range is longer than the original date range, Demantra uses nulls for the dates at the end. If the new date range is shorter than the original date range, Demantra omits the “extra” dates. | Any | Any |
| Do Nothing | Demantra ignores the series during the copy/paste and move operations. Use this option to retain values of any price series of a promotion when using the Refresh Population method and workflow. | Any, suggested | Any |
| Most Common | Demantra ensures that the pasted data closely resembles the source data. Use this setting for any kind of series; the other settings apply only to numeric series. | Any, but not usually appropriate for proportional numeric series | Any function other than Sum |
| None | Demantra does not copy the data for this series. | Any | Any |
| Percentage Preservation | Demantra first aggregates the data according to the Aggregation Function of the series. It then ensures that the pasted data generally has the same level, over time, as the source data. | Numeric; not proportional | Any function other than Sum |
| Volume Preservation | Demantra first aggregates the data according to the Aggregation Function of the series. It then ensures that in the pasted data, the overall volume is the same (area under the curve) as the volume of the source data. Choose Volume Preservation for the Copy/Paste Preservation option when you use a Refresh Population method and workflow to realign promotion data after an item is moved from one promotion group to another. This option works in conjunction with the CopyPasteIntersect system parameter. | Numeric; proportional | Sum |
For most series, you will want to use the same setting for both options. However, for some series, it does not make sense to copy the data when you create a new promotion (so you would use the setting None for copy/paste), although it does make sense to preserve the data if you are just moving a promotion. In such cases, it is useful to have two separate options.
The following figure shows examples of series that are configured with each of these preservation types:
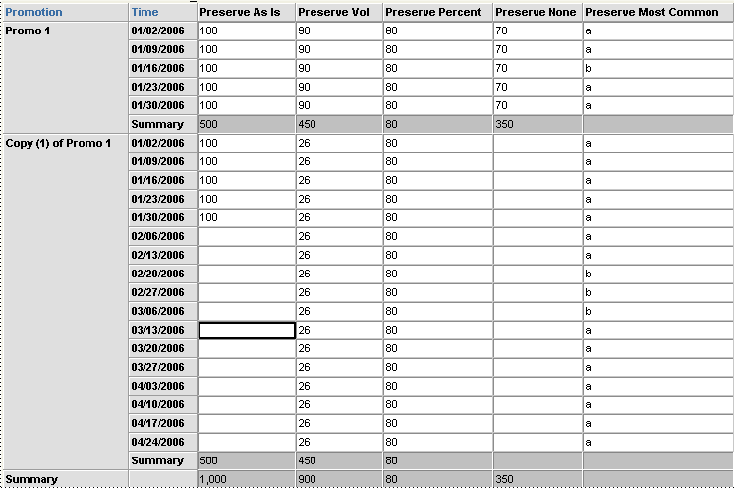
This worksheet table shows two promotions, Promo 1 and a copy which spans more time. Notice the following in the copy:
-
The Preserve As Is series contains the same numbers for the first five time buckets, which the length of the original promotion. After that, this series is null in the promotion copy.
-
For the Preserve Vol series, the level of this series is lower in the copy so that there is the same overall volume as in the original.
-
For Preserve Percent, the pasted data is at the same level as the original, and is extended for the length of the pasted promotion.
-
For Preserve None, there is no pasted data.
-
For Preserve Most Common, the pasted data mimics the original data in overall pattern.
See Also
-
"System Parameters" for more information about the CopyPasteIntersect system parameter that works in conjunction with the Copy/Paste Preservation series configuration.
-
"Specifying Data Properties of a Series Table" for additional information about configuring series.
The Aggregated Base Level Option
This option lets you specify how this series is aggregated in a worksheet that includes a promotion level:
-
If you choose sales_data, this series is aggregated by the items, locations, and dates selected in the worksheet. Most series are aggregated this way in a typical implementation.
-
If you choose promotion, this series is aggregated by the items, locations, dates, and promotions selected in the worksheet. That is, when the series is aggregated, any data that is not associated with a promotion is ignored.
Within a worksheet that does not include a promotion, the series is aggregated based on the series setting; that is, it is aggregated by the items, locations, and dates if it aggregates by sales_data only, and additionally by promotions if aggregated by promotion.
The following shows two series that are defined almost identically. The Orders series is aggregated by sales_data and the Orders for Promotions series is aggregated by promotion.
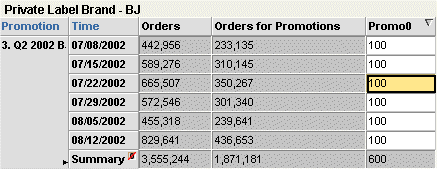
This worksheet is aggregated to the Brand, Account, and Promotion levels. The worksheet is filtered to show only the Private Label brand and two specific BJs locations (these locations are children of the Account level):
-
BJ 0005 ran a promotion on all Private Label products during the time span of the worksheet.
-
BJ 0003 did not run any promotion.
Notice that the values are greater for Orders than for Orders for Promotions. This is because only one of the locations ran the promotion.
Extra From and Extra Where
Normally the server expression can refer only to fields in the following tables:
In rare cases, you may need to refer to data in other tables. In such a case, use the Extra From field. In this field, specify an optional list of additional tables (separated by commas) that contain data relevant to this series.
If you include a table here, the server expression can refer to columns in that table.
Note: Internally, these tables are added to the From clause in the SQL query that retrieves data for this series.
If you need to filter the data further, use the Extra Where field. The syntax of this field is as follows:
table.column operator other_table.other_column
Here operator is a comparison operator, one of the following
:=
<>
>
>=
<
<=
and table.column and other_table.other_column are key columns in the database.
Note: Internally, the Extra Where field is added to the WHERE clause in the SQL query that retrieves data for this series.
Note and Promotion Indicators
Within a worksheet, a user can attach a promotion (in the case of Promotion Effectiveness) or a note to a given item-location combination, at a given date. Depending on how the series was configured, the series will be displayed with an indicator in all worksheet cells that correspond to that item-location combination and date.
You control these indicators when you define components, within the Business Modeler
Note: If your solution uses other types of general levels, you can associate an indicator for any general level that does not have child levels.
Series Groups
You can define optional groups of series, in order to make the lists of series more manageable, especially in cases where there are a large number of series. For example, the Worksheet Designer includes a screen like the following.
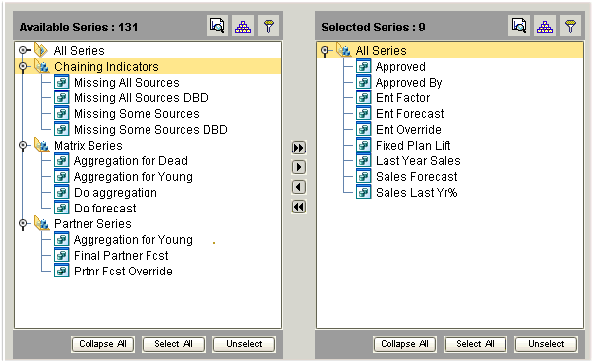
Well-defined series groups can make it easier to place related series on a worksheet.
A series can belong to any number of groups.
You define, modify, and delete series groups in the Business Modeler. The series groups are visible in the Worksheet Designer, within in the Web-based products (Demand Planner Web, Promotion Effectiveness, and Settlement Management).
Note: Series groups are not visible in the desktop products (Demand Planner and Demand Replenisher).
Configuration Notes
This section contains configuration notes related to series.
Dependencies
Before you can configure series, you will need to load some sample data for items, locations, and sales (and promotions, if you want to create promotion series).
Before creating a dropdown-type series, you must consider where to look up the dropdown choices. You may need to create the table for the lookup data and then load that data (as indicated in “Loading Supplementary Data”). Or you can use an existing level or you can enter the choices directly in the Business Modeler.
Series can be added fairly easily throughout implementation and later as needed.
Tools
Demantra provides the following tools for creating and configuring series:
| Tool* | Purpose/Notes |
|---|---|
| Data Model Wizard | Can define series, although this wizard provides only a small subset of the series options. |
| Configure > Series option | Defines series. |
| Configure > Series Group option | Defines series groups. |
| Components > Open/Create Component option | Creates components. Among other things, a component defines the associations between series and indicators. |
| *These options are in the Business Modeler. |