Working with Plans
This chapter covers the following topics:
- Service Parts Planner’s Worksheet
- Supply/Demand Analysis Worksheet
- Creating Comments
- Plan Actions (Exception Region)
- List of Exceptions in SPP
- Replan Options Window
- Plan Summary Dashboard
- Actions Summary Window
- Creating Planner’s Work Lists
- Windows Available from the Worksheet Tools Menu
- Defining User Groups
- Executing a Planner Work List
- Viewing Planner Work List Results
- User Preferences Window - Main Tab
- User Preferences - Plan Summary Tab
- Pegging in SPP
- Queries
- Viewing Supersession Notes
- Review Workflow Notifications
- Re-order Point Based Planning
Service Parts Planner’s Worksheet
The Planner's Worksheet provides the Supply and Demand Analysis and Forecast Analysis information used for decision making. This chapter describes how to use Planner's Worksheet user interface elements while performing analysis of the plan, performing incremental planning, analyzing supply chain details, analyzing and correcting exceptions in the plan, and executing action messages.
Worksheet Menu and Toolbar
This section describes the menu and toolbar icons that planners can access at any time from the Planner’s Worksheet. The following menu items appearing above the toolbar are the same as in ASCP/DRP. For more information about these menu items, see General Navigation in the Planner Workbench chapter of the Oracle Advanced Supply Chain Planning Implementation and User Guide.
-
File
-
Edit
-
View
-
Folder
-
Window
-
Help
The following menu items include options that are unique to Service Parts Planning:
-
Tools – Provides access to the following windows:
-
Exception Summary
-
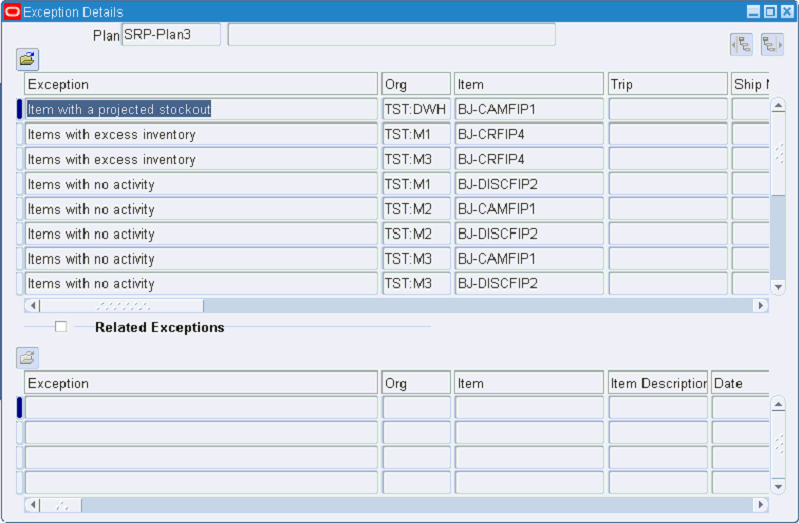
Exception Details
-
Supply and Demand Analysis
-
Order Details
-
Personal Query
-
Planner’s Work List
-
User Preferences
-
Notifications
-
Organization Lists
-
Zone Lists
-
Customer/Technician Lists
-
Work Dates
-
Close All Detail Windows
-
-
Plan
-
Replan Item
-
Save Exceptions Version
-
Plan Summary
-
Plan Names
-
Plan Options
-
-
Actions
-
Select All for Release
-
Release
-
Firm All
-
Service Parts Planning Main Toolbar Action Icons:
Click the icon to open the corresponding window.
Note: When a particular window is already open, the button related to that screen on the main toolbar is disabled, or grayed out. For example, when the planner is already on the supply and demand analysis screen, the demand and supply analysis screen button appears in gray tones.
-
Supply Demand Analysis (includes the Planner’s worksheet)
-
Choose Plan
-
Online Help
Supply/Demand Analysis Worksheet
To open the Supply Demand Analysis worksheet, from Service Parts Planning > Workbench, click the Supply Demand icon, or navigate from the Menu > Tools > Supply and Demand Analysis.
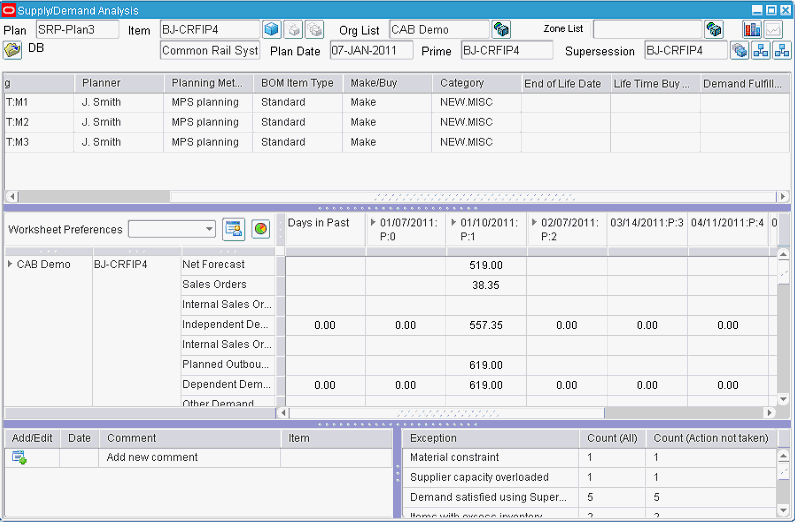
The Plan Analysis worksheet is populated with information about the selected plan at the (Item, Prime, or Supersession) aggregation level and in the (Org List or Zone List) context. The default level and context values are set in User Preferences. You can change the view by selecting different aggregation levels and contexts in the header region.
You can resize the regions of the Supply and Demand Analysis window by dragging the region boundaries.
Item – Org Selector (Header) Region
The item-org selector region includes (top first row, left to right) :
-
Plan: This read-only field displays the name of the selected plan.
-
Item: Optionally enter an item identification, or select an item from the list of values.
-
Aggregation level icons: Item, Prime, Supersession
-
Org List: If an item is selected, then an organization must be entered. The default Org List value is set in User Preferences.
-
Open Org List (icon): Opens the Organizations List window for creating or modifying Org lists.
-
Zone List: Org List and Zone List act as toggles to switch contexts.
-
Open Zone List (icon): Opens the Zones List window for creating or modifying zone lists.
-
Supply and Demand Analysis (icon): This icon places supply and demand information in the Supply and Demand View pivot table.
-
Forecast Analysis (icon): This icon places forecast information in the Forecast View pivot table.
Second row (left to right):
-
Folder: Folder functionality for the Item / Location region.
-
(Unlabeled field): When an Item is selected, this read-only field displays the description of the selected item.
-
Plan Date: Time stamp for the last time this plan was run.
-
Prime: Read only field, derived by the planning engine.
-
Supersession Item: Read only field, derived by the planning engine.
-
Supersession Chain (icon): Opens the Supersession Chain window.
-
Failure Rate (icon): Opens the Failure Rate window for maintaining failure and return rates.
-
Parts Usage (icon) – Opens the Parts Usage window for viewing information about where a part has been used. This displays the product and organization that this part goes into. This is derived from the item relationship service parts information.
Supported Item Aggregation Levels
You can view the Planner’s Worksheet using one of three item aggregation levels: Item, Prime or Supersession. The prime item and the supersession item are derived by the planning engine.
Prime Item and Supersession Item Concepts
For a given supersession chain, the supersession item is defined as the latest item in the supersession chain. The prime item is defined as the highest bilateral revision part number in the chain, or the item itself in case it does not have a bilateral segment.
For example:
A -> A1 -> A2 - >A3 <- -> A4 -> A5 <--> A6 <--> A7 <--> A8
-
For item A, the prime item is A, and the supersession item is A8.
-
For item A1, the prime item is A1, and the supersession item is A8.
-
For item A2, the prime item is A2, and the supersession item is A8.
-
For item A3, the prime item is A4 (which includes A3 and A4) and the supersession item is A8.
-
For item A4, the prime item is A4, and the supersession item is A8.
-
For item A5, the prime is A8 (which includes A5, A6, A7 and A8) and the supersession item is A8.
Supported Contexts
Independent controls for organization and zone drill-down are provided. The Organization drill down can be done at any node of the zone. Relevant organizations belonging to the expanded zone node appear.
The two seeded zone nodes are Global and Local. The Global node represents the item level of the global product population forecast. It is not zone-specific. On expanding the global node, the organization to which the global forecast was distributed appears. The Local node represents local forecasts. On expanding the local node, the organizations for which local forecasts exist appear.
The Org List includes one or more organizations and groups of organizations. The list of values lists the individual organizations in the plan, the user defined groups of organizations, and an entry representing all organizations in the plan.
For example, the Org List LOV includes:
-
Central warehouse
-
Seattle warehouse
-
Toronto warehouse
-
European warehouse
-
Main warehouse (includes Central and European warehouses)
-
Americas (includes Seattle and Toronto warehouses)
-
All orgs
To access the Organization List selection window, click the Create icon that is located in one of the following places:
-
On User Preferences, beside the field that displays the default organization list
-
On Supply and Demand Analysis, next to the Org List
-
Navigate from the Menu bar > Tools > Organization Lists
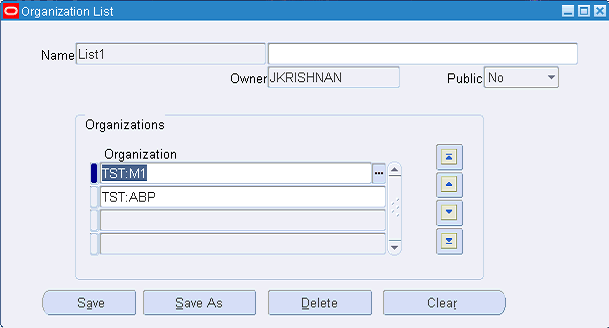
You can define and save multiple named organization selection lists. To set the sequence of organizations that appear within a list, select an organization from the list of organizations, and then use the arrows to move that organization up or down in the displayed sequence. Continue this process until the sequence is as desired. Click Save.
The Public Yes / No field determines whether the named list is accessible to other planners. If made public (Yes), the Org List is accessible to other planners from the Horizontal Plan right-click menu. The Public list of values includes only: Yes and No. The default value is No.
The seeded Org List entry named All Org” enables view across all the organizations, and cannot be deleted.
To access the Zone List selection window, perform one of the following actions:
-
On User Preferences, click the Create icon located beside the field that displays the default Zones List
-
On Supply and Demand Analysis, click the Create icon located next to the Zones List
-
Navigate from the Menu bar > Tools > Zone List
The look and feel of the Zone List window is similar to the Organization List window.
You can define and save multiple named zone selection lists.
To set the sequence of zones that appear within a list:
-
Select a zone from the list of zones
-
Use the arrows to move that zone up or down in the displayed sequence.
-
Continue this process until the sequence is as desired.
-
Click Save.
The Public Yes / No field determines whether the named list is accessible to other planners. If made public (Yes), the Zone List is accessible to other planners from the Horizontal Plan right-click menu. The Public list of values includes only: ‘Yes’ and No. The default value is No.
The seeded Zone List entry named All Zones enables view across all the zones, and can not be deleted. Thus, the drill-down of the zones starts with All Zones and then drills down into individual zones.
Org List / Zone List Context Toggle
Clicking the Org List causes the Zone List to be disabled, or grayed out. The context is organizations. By clicking the Zone List, the context changes to zone and the Org List is grayed out. Essentially the Org List and Zone List act like toggle buttons.
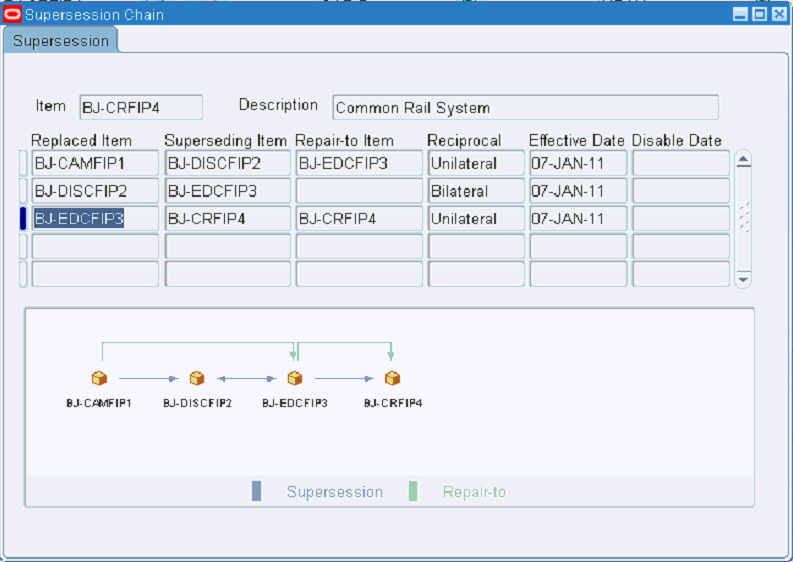
Supersession Chain Window
The Supersession Chain window is view-only. You can not implement any changes here. This window displays the Notes icon, which appears as a paperclip, if a supersession note is assigned to the item. For more information on supersession notes, see Viewing Supersession Notes.
The following figure depicts the Supersession and Repair to item relationships for an item in supply and demand analysis context.
Note: The Repair to Item relationship appears along with the Supersession Item relationship. In this example, BJ-CAMFIP1 is superseded by BJ-DISCFIP2 and BJ-DISCFIP2 is superseded by BJ-EDCFIP3. BJ-CAMFIP1 can be repaired to BJ-EDCFIP3.
Item/Location Details Region
Selecting an item and organization overrides selections made using the selector for the Product and Organization dimensions.

The Item/Location details region includes:
-
Notes: This column displays the Notes icon, which appears as a paperclip, if a supersession note is assigned to the item. For more information on supersession notes, see Viewing Supersession Notes.
-
Folder: The Item / Location region provides folder-based functionality. You can select a list of attributes for an item to be displayed as columns in the Item / Locations region.
-
Item attributes for Forecast Rule and Lifetime Buy.
-
The forecast accuracy metric.
-
Sourcing details for the supply chain at the selected location.
The sourcing rule options are Transfer, New buy, and Repair. The primary sources are displayed. Sourcing depends on the assignment set selected for the plan. For example, selecting an organization grouping displays details for the organization name that equals the group name. Because folder functionality is present in this region, you can add or remove available details.
Note: Repair lead time in the item location details is the total repair lead time. This includes time to transfer defectives in and usable parts out of the repair organization plus the actual time to repair it.
-
Separate rows (based on the item aggregation level) for all the valid combinations of items and organizations.
For example, if the Org List has 10 organizations, and the Prime has 2 parts, and both parts are valid for all ten organizations, then 20 item-organization related rows appear.
Right-Click Actions Supported in the Item / Location Region
On the Item / Location region, you can right click each valid item-organization combination to view:
-
Order details for the item-organization
-
Forecast rule assigned to this item-organization
-
Calendar
-
Forecast rule for returns
-
Failure rates
-
Supply chain details:
-
Sources
-
Supply chain bill for the item-organization
-
Destination
-
-
Notes Summary
Supply Chain Details
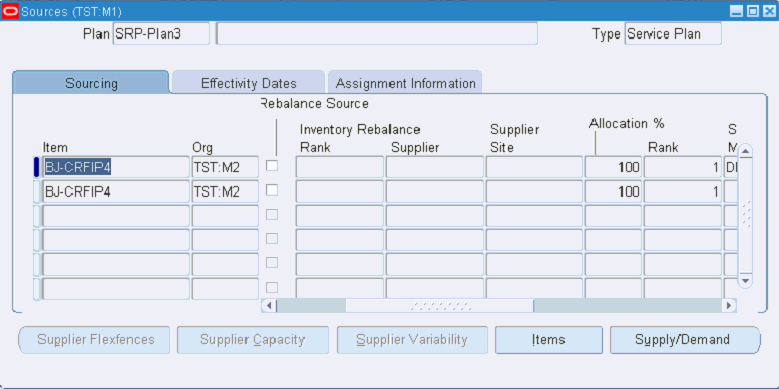
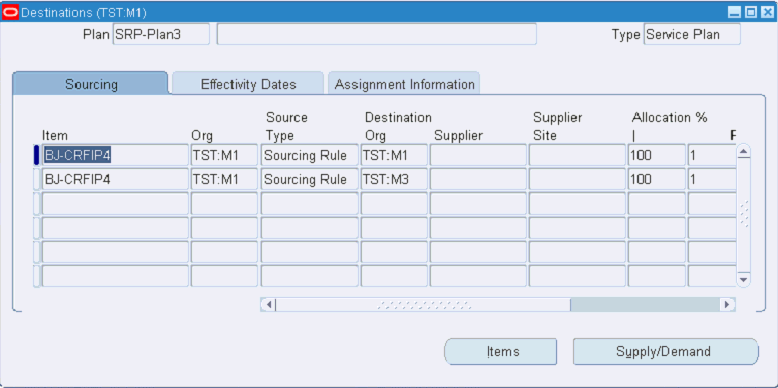
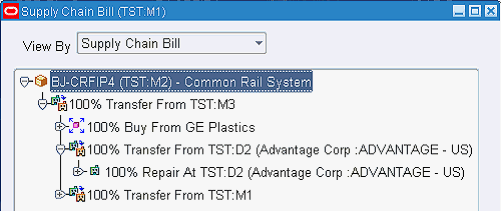
From the right-click menu, you can select Supply Chain, and then open the sources, destination, or supply chain bill for the item-organization. For each action, the appropriate window opens with the item-organization context.
Circular Sourcing in the Supply Chain Bill
In case of circular sourcing, the user interface breaks the supply chain bill after displaying the circular source. An icon in the supply chain bill indicates circular sources. Another icon represents the Repair at relationship. Further, the transfer of the defectives is shown using the transfer icon, but in red color. This helps distinguish between the forward supply chain (movement of usable parts) and the reverse supply chain (movement of defectives).
Note: The transfer rule that is related to repair actually shows the repair supplier organization.
Right-Click Actions on Supply Chain Bill
On the supply chain bill, you can click any node of the supply chain, right-click to open the Properties window, and then expand the node.
-
The Supply and Demand Analysis window is available in all nodes except the master node.
-
Supplier capacity is available only when in context to a supplier.
-
Properties window is same as the one for ASCP. For more information about the Properties window, see "Properties Window" in the "Planner Workbench" chapter of the Oracle Advanced Supply Chain Planning Implementation and User Guide.
The defective part appears as a component. The supply chain bill traverses the supply chain for the defective part supply.
Worksheet Analysis Region
Worksheet Preferences – Selecting Available Views
On the Item-Organization selector region, you can select either the Org List or the Zone List context. You use the icons located at the top right to toggle between the Forecast Analysis view and the Demand and Supply view.
-
If you select Org List, then you can select either the Forecast Analysis view or the Supply and Demand view. The default view is determined by User Preferences.
-
If you select Zone List, then only the Forecast Analysis view is available, and the Supply and Demand view toggle button is disabled, or grayed out.
-
Worksheet Preferences: You can select from the LOV to switch between named worksheet preferences.
-
Worksheet Preference Details (icon): Opens the form where you can create named sets of worksheet preferences.
-
Analysis Rows: Displayed rows are determined by Worksheet Preferences. See Saving Worksheet Preferences to Show and Hide Row Names.
-
Graph (icon): Select the graph icon to plot graphs of selected rows.
-
Time Dimension
-
In the Supply and Demand view, the bucket size is specified by the Plan Option for Demand and Supply Analysis.
-
In the Forecast Analysis view, separate regions show bucketed views of forecast and history. Bucket size is as specified by the Forecast rule.
-
Color Banding
The totals and subtotals appear in bold font with a beige color band. The total and subtotal rows are:
-
Total forecast
-
Independent demand
-
Dependent demand
-
Total demand
-
Total supply
-
Returns forecast
-
Total defective part demand
-
Total defective part supply.
Row Names in Supply/Demand Analysis
The following table lists all row types available in the service supply chain. The indented row column shows the first level to which the row opens when you double-click the row name.
| Row Name | Indented Row | Description | Click to Open Order Details Form |
|---|---|---|---|
| Net Forecast | This is the forecast used by the replenishment plan and includes the forecast after consumption and demand time fence (if enabled). | Yes | |
| Sales Orders | The open sales order in the supply chain. | Yes | |
| Internal Sales Orders – Field Organizations | The open ISOs (outbound shipments from field organizations). The collected ISO customer name field displays the technician name. | Yes | |
| Independent Demand | Internal sales order – field orgs + sales orders + net forecast | Yes | |
| Internal Sales Order | Destination | The ISO that represents the transfer material to be shipped out | Yes |
| Planned Order Demand | Destination | The planned order demand that will be converted to ISO (outbound shipments). | Yes |
| Dependent Demand | No | ||
| Other Demand | From the master demand schedule (MDS), master production schedule (MPS), and so on | No | |
| Total Demand | Independent demand + dependent demand + other demand | No | |
| Beginning On-hand | The current usable on-hand inventory | Yes | |
| In-Transit | Source of supply | The in-transit material
Note: Collected in-transit ignores the related inbound shipment. |
Yes |
| In-Receiving | Source of supply | Yes | |
| New Buy Purchase Order | Source of supply | Yes | |
| New Buy Purchase Requisitions | Source of supply | Yes | |
| Internal Repair Order | Source of supply | Transfer in from depot | Yes |
| External Repair Order | Source of supply | Purchase order to repair supplier | Yes |
| Inbound shipment | Source of supply | Does not include internal repair | Yes |
| Repair Work Order | Yes | ||
| Planned New Buy Order | Source of supply | Yes | |
| Planned Internal Repair Order | Source of supply | Yes | |
| Planned External Repair Order | Source of supply | Yes | |
| Planned Transfer Order | Source of supply | Transfer of supply from one org to the other. Planned Transfer, as distinguished from Planned External Repair Order and Planned New Buy Order. | Yes |
| Planned Repair Work Order | Yes | ||
| Planned Warranty order | |||
| Total Supply | |||
| Safety Stock (Days of Supply) | |||
| Total unconstrained demand | No | ||
| Projected Service Level | No | ||
| Target Service Level | |||
| Maximum Level | |||
| Projected Available Balance | Cumulative (total demand – total supply) | No | |
| Projected On Hand | Cumulative (total demand – current supply) | ||
| Defective Outbound shipment | Destination | Yes | |
| Planned Defective outbound shipment | Destination | Yes | |
| Defective Part demand | Defective part demand for repair order and planned repair order | Yes | |
| Total Defective Part demand | |||
| Defective On-Hand | On-hand by condition (warranty and defective) | Yes | |
| Returns | The adjusted returns forecast used by supply plan. This includes offset by global forecast and the remaining forecast after the Returns Forecast Time fence has been enabled. (Analogous to net forecast for the demand) | ||
| Defective Inbound shipment | Source of supply | Yes | |
| Planned defective Inbound shipment | Source of supply | No | |
| Defectives in transit | The in-transit supply, if the defectives are moving from one organization to another | Yes | |
| Defectives in receiving | Yes | ||
| Total Defective Supply | |||
| Projected Available Balance (Defective) | Cumulative (defective part demand – defective supply) | No |
Forecast Analysis View
In the forecast analysis view, separate regions show bucketed views of forecast and history. Bucket size is as specified by the forecast rule.
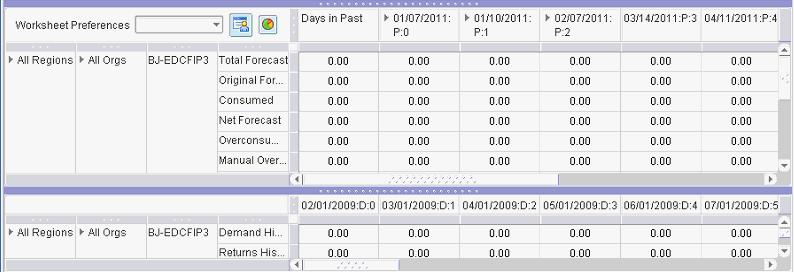
Zone to Organization Drill-Down
When analyzing a zone level forecast, you can drill down from the zone to the organizations to which the forecast has been allocated, based on global forecasting rules.
Organization to Zone Drill-Down
Similarly, when you are on an organization list that has received a zone level forecast, then you can verify the forecast numbers at the zone level.
Supersession Drill-Down
When the Forecast Analysis view opens for a prime or supersession chain, the display is aggregated at the Prime or Supersession level. You can drill down from this to view the forecasts for individual revisions of the item.
Display Range for the History Block
The history range for the last two years is displayed in periods.
| Row Name | Description | Remark | Edits allowed |
|---|---|---|---|
| Total Forecast | This is the forecast used by supply chain after consumption and forecast allocation in case of global forecast | ||
| Original Forecast | Original forecast quantity | ||
| Consumed | Quantity of forecasts that has been consumed by sales orders | ||
| Net Forecast | Remaining unconsumed forecasts | Through Order Details form | |
| Over Consumption | Excess consumption of forecasts | ||
| Manual Override | Manually entered forecast value | Populated in case manual entry of data. Overrides all other forecast values | Through Order Details form |
| Demand Schedule | Forecast entered as a demand schedule from source ERP | Through Order Details screen | |
| Part History based Forecast | Displays the Usage/Shipment/Returns history-based forecast | Because only one of the three can be used, one single row appears. | |
| Population based Forecast | Display the product population-based forecast value | If product population-based forecasting is enabled for the item | |
| Total Returns Forecast | Total returns forecast | ||
| Returns – Net Forecast | Unconsumed returns forecast | Through Order Details form | |
| Returns Manual Forecast | Manual entry value of returns forecast | Populated incase of manual entry. Overrides all other forecast values. | Through Order Details form |
| Returns Demand Schedule | Demand schedule for returns from source ERP | ||
| Returns – Part History based Forecast | Displays the Usage/Shipment/Returns history based returns forecast | Because only one of the three can be used, one single row appears. | |
| Returns – Population based Forecast | Display the Product Population based returns forecast value | If product population-based forecasting is enabled for the item |
-
In case multiple forecasting bases are selected, the values are suplied in appropriate rows. In this case, the Original forecast quantity is the sum of the forecasts generated.
-
Net forecast is the Original forecast minus the consumed forecast.
-
Overridden forecast values appear in the Manual Override column.
-
The total forecast is equal to the net forecast, unless a manual override exists. In that case, the total forecast is equal to the manual Override.
-
In case of a demand schedule from Oracle Demantra, that value is shown under the Demand Schedule column.
-
Because only one of Usage / Shipment / Returns-based forecasting can be employed, the Part History based Forecast row displays the value if any one of these are employed.
-
Similarly, the Populated Based Forecast row shows the value if product population-based forecast is enabled.
-
Interpretation of the rows for Returns forecast is similar to the interpretation of the corresponding Demand rows.
-
In case of a global forecast, the portion of the forecast distributed to the organization appears under the appropriate column when the All Orgs drill-down is opened to the appropriate organization.
-
When you are drilling down from All Zones, in addition to the nodes for individual zones, Global and Local nodes are available. These show global forecast not belonging to any zone, and local forecasts not belonging to any organization, respectively.
-
Refer to Levels of Output for more details.
| Total Forecast |
If (ManualOverride=NULL,NetForecast, ManualOverride) |
| Original Forecast |
DemandSchedule+HistoryBasedForecast+PopulationBasedForecast |
| Consumed |
Consumed Forecast |
| Net Forecast |
Original Forecast - Consumed |
| Over Consumption |
If(Consumed>OriginalForecast,Consumed-OriginalForecast,0) |
| Manual Override |
User Entered Forecast Value |
| Demand Schedule |
Forecast coming in as a Demand Schedule |
| Part History based Forecast |
Usage / Shipment / Returns based forecast |
| Population based Forecast |
Product Population Based Forecast |
| Total Returns Forecast |
If(ReturnsManualForecast=NULL,Returns-NetForecast, ReturnsManualForecast) |
| Returns – Net Forecast |
Original Returns Forecast - Consumed Returns Forecast |
| Returns Manual Forecast |
User Entered Returns Forecast Value |
| Returns Demand Schedule |
Returns Forecast coming in as a Demand Schedule |
| Returns – Part History based Forecast |
Usage / Shipment / Returns based Returns Forecast |
| Returns – Population based Forecast |
Product Population Based Returns Forecast |
Manual Override
You can manually override values in the forecast and demand schedule rows. For example:
| Bucket 1 | Bucket 2 | Bucket 3 | |
| Forecast | 20 | 20 | 30 |
| Manual Override | 45 | -- | 30 |
| Demand Schedule | 10 | 10 | 8 |
| Total Forecast | 45 | 30 | 30 |
Bucket 1: Total forecast is 45 where 45 overrides the statistical forecast (20) and demand schedule (10).
Bucket 2: Total forecast is 30 units, which is the sum of statistical forecast (20) and the demand schedule (10).
Bucket 3: Total Forecast will be 30 where 30 overrides the statistical forecast (30) and demand schedule (8).
-
Manual override is allowed only in the leaf node, in other words, where the forecast is actually generated, and not necessarily viewed. For example, when you are viewing the All orgs information, manual override is not allowed.
-
Further, manual override is permitted at the forecasting bucket level only. For example, if the user has forecasted at the weekly level, but is viewing the forecast in the monthly level, then override is not permitted. To edit the weekly forecast quantity, either go to the Order Details form, or go to the date of a forecast.
-
The demand schedule entry can also be updated for both date and quantity. This change is only temporary. Publishing a new scenario from the demand planning erases these changes.
Deleting Entries in the Manual Override Row
Planners can multi-select records to delete by selecting the records and then clicking the toolbar Delete button, or from the menu, select Edit > Delete. Additionally, planners can select the entire row by clicking the manual override row type, and then clicking the toolbar Delete button.
If selected cells are non-editable, then a warning appears in the bottom bar: This is not an editable value. Editing capability is provided only when the displayed bucket size is equal to the planning or forecasting bucket size.
Time Bucket Size for Forecast Analysis Worksheets
The forecast analysis worksheet derives its bucketing scheme from the forecast rules. A forecast rule is associated with each item. Planning uses the forecast rule associated with the latest revision item to determine the time bucket size for forecasting. The forecast analysis screen derives the bucket size from the forecast bucket size specified here.
Note: In case of a global forecast and the zone-to-organization or organization-to-zone drill down, the forecast bucket being used is based on the forecast rule. This is true even when the organization-specific forecast is spread; the user interface rolls up the organization forecast to the bucket specified by the global forecast.
For example:
-
The forecast bucket is periods, while the planning bucket is in weeks.
-
The forecast for zone R1 that is supported by warehouse RW1 is 100 units per period.
-
Because the planning buckets are in weeks, planning spreads the global forecast of 100 into the number of weeks in the period (for example 4), resulting in 25 units per week at RW1. In the forecast analysis for zone R1, the forecast for R1 is 100 units and the indented row shows the org RW1 with a forecast of 100 units.
In the forecast analysis for zone R1, the forecast for R1 is 100 units and the indented row shows the org RW1 with a forecast of 100 units.
| Zone | Indented | Item | Order Type | Total | Jan-05 | Feb-05 | Mar-05 |
|---|---|---|---|---|---|---|---|
| Zone 1 | Item A8 | Total Forecast | 10000 | 100 | 100 | 100 |
The indented row shows zone-to-org forecast spread
| Zone | Indented | Item | Order Type | Total | Jan-05 | Feb-05 | Mar-05 |
|---|---|---|---|---|---|---|---|
| Zone 1 | Item A8 | Total Forecast | 1000 | 100 | 100 | 100 | |
| RW1 | Item A8 | Total Forecast | 1000 | 100 | 100 | 100 |
The demand schedule could have a different bucketing policy or calendar as defined in the demand plan. The user interface takes the raw numbers and displays them based on the inline forecast bucket size. When the demand planning buckets are smaller than the inline forecast buckets, the user interface displays buckets according to inline forecasting. This gives the impression that the user interface is aggregating he forecast quantities.
For example:
-
Bucket for inline forecasting = weeks
-
Bucket for demand schedule entries = days
For the item-org, week is defined as day 1 though day 5. Then all forecast entries from the demand schedule that have day 1 to day 5 appear in the first bucket.
In case the Demand Planning scenario buckets are larger than inline forecast, the user interface places the entire quantity according to the date in the scenario and does not disaggregate the numbers.
For example,
-
Bucket for inline forecasting = weeks
-
Bucket for demand schedule entries = months
For the item-org, the first four weeks the entire demand schedule entry is placed on one of the weeks (for example, the 1st week) where forecast from demand schedule falls.
In case no inline forecast exists, the bucketing is based on periods defined by the organization that is being viewed.
Time Buckets on the Supply and Demand Worksheet
The worksheet enables you to view the time buckets at a different level of aggregation from the aggregate level defined for the plan. Users can drill down to the granular information, and then save the Worksheet Preferences with the preferred bucketing and cell width.
Note: The generated forecast that is part of the total forecast always appears at the forecasting bucket level.
The supplies and demands in daily time buckets are time stamped at the end of the shift calendar that is being used. In the case of a 24 x 7 calendar, the time stamp is shown as 23:59. Note that netting and pegging occurs at the day level. Hence you can put the time stamps at the end of the shift or day.
Saving Worksheet Preferences to Show and Hide Row Names
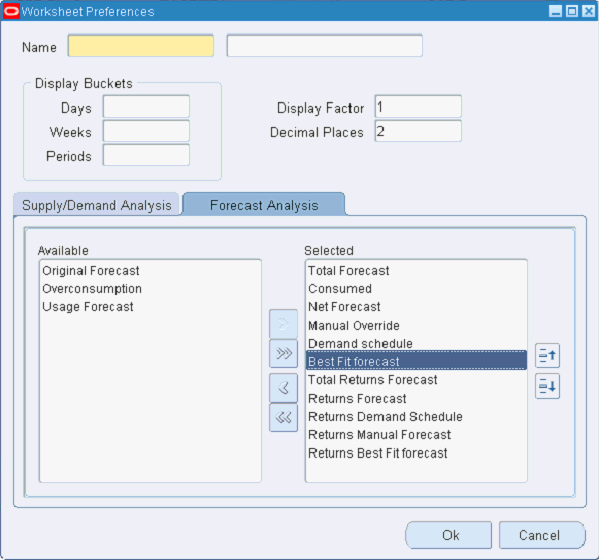
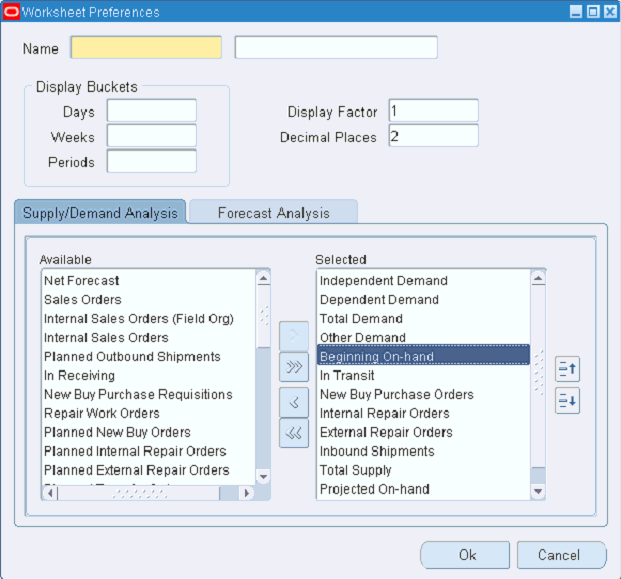
By default, the worksheet opens with a compact view of the data such that you do not need to change the worksheet column width or row height. You can create, edit, and view worksheet preferences. To do this, click the Worksheet Preferences Details icon located next to the Worksheet Preferences LOV field. This action opens the User Preference window.
The User Preferences window enables you to:
-
Choose rows to be displayed
-
Save the worksheet area and column width
-
Set the number format
-
Control colors for orders and negative values
You can select a saved worksheet preference from the Worksheet Preferences LOV. You can change the worksheet preference to display selected demand and supply rows. To do so, use the pull-down menu to select the named worksheet preference. By right-clicking, and then saving the worksheet preference that is open, you can choose to hide or show selected worksheet rows, and change the column width in the time bucket region.
Saving the worksheet also saves the geometry and layout of the various blocks. Only the changes to the current view are saved. You save the layout of the supply and demand analysis (SDA) and the forecast analysis (FA) views independently. To do this, you save changes once for the SDA view and once for the FA view.
For example, if the user makes some layout changes in the FA view, and then switches to SDA view, and then saves the changes, only the SDA changes are saved.
For Forecast analysis, several Forecast and History row types are available. You can choose the rows to be displayed, and by moving rows up and down in the Selected column, you can determine the sequence in which you want the rows to appear.
For details, refer to the table Row Names in Forecast Analysis.
The Supply/Demand Analysis tab works similarly to the Forecast Analysis tab. You can choose the rows to be displayed, and organize them according to your preferred sequence.
For details, refer to Row Names Available Supply/Demand Analysis.
Export Capability from Supply and Demand Analysis
From the menu, select File > Export to export data from the item-organization or item-zone context to external spreadsheet applications using formats such as .csv and .xls.
Graphs
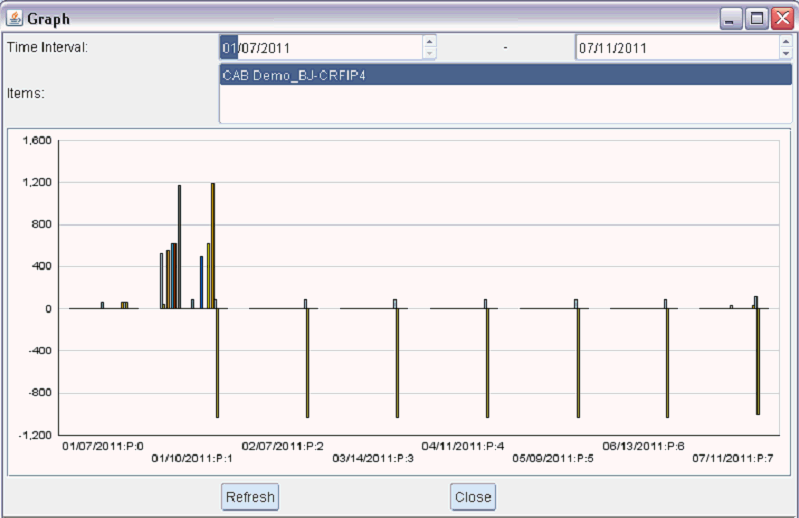
From Supply and Demand Analysis, you can click the Graph icon, and then choose the rows and the time horizon to plot. The time range (from date, to date) for plotting the graph defaults from both the:
-
History for the forecast, based on the forecast rule for the item
-
Plan horizon
Additionally, you can choose certain cells in the forecast region of the worksheet, and then click the Graph icon. In this case, the scope of the graph (time period and rows) is determined by the selected cells.
In the Planner’s Worksheet, you can display the destination and source rows for demand and supply. For outbound shipments, you can see the destination organization or for new buy supply, you can see the supplier information.
| Row | Validation | Description | Default |
|---|---|---|---|
| Graph Type | Line Graph, Bar Graph | Indicates the type of graph that is plotted. Line and bar graphs are supported. | Line Graph |
| Time Horizon From | Date | Indicates the start date from which to plot the graph. | The start date of the history |
| Time Horizon To | Date | Indicates the end date to which you want to plot the graph. | The time horizon date in case forecast horizon is greater than the planning horizon, else the plan horizon end date. |
| Description | Display description of the category selected |
The forecast rule determines the default time horizon. The forecast rule provides the history range that needs to be considered. The start date of the history range is the from date in the graph.
Graphs are available only for the SDA subset of rows. That is, if the row is not selected for display in the SDA, it is not available in the graph. You can select or switch the rows appearing in the graph by using the right-click menu, and then selecting the hide/show row option. A shuttle window with the available and selected rows appears for you to select the rows to be graphed.
Multiple rows can be viewed for a given item, however, you can view only one item at a time. If multiple items match the selection criteria for graphing, then only the top item is graphed. The list of items that match the selection criteria appear in the Items field LOV. You can select another item or multi-select from the list if needed. If you have not selected an item in the SDA before clicking the graph icon, then all the displayed rows in SDA are graphed for the item context shown in the header region.
For example, a user selects Item1, Item2, and Item3, and then clicks the graph icon. The graph for Item 1 appears. The Items drop-down list of values contains Item1, Item2, and Item3. You can select one or multi-select any combination of Item1, Item2, and Item3.
Default Graph Type and Selections
The default graph type is line graph, with horizon equal to the Plan horizon from and to dates. The selected supply and demand types include Total forecast and Blended forecast. The bucketing used for graphing is the maximum planning bucket of the selection. The colors for the graph are predetermined, except when multiple items are selected for the same row. Thus, you cannot specify the color for individual rows.
You can hide or show graph legends, and use the right-click menu option to change the graph type.
Unconstrained Demand Row
In the Supply Demand Analysis window (Menu > Tools > Supply and Demand Analysis) the Unconstrained Demand row shows demand at the organization being viewed without considering supply constraints. Double clicking on this row opens the Order Details screen, which shows information about individual demands that add up to Total Unconstrained Demand for that organization.
When viewed against the supplies planned for a given allocation bucket, the Unconstrained Demand row allows you to compare between actual (unconstrained) demand and constrained supplies using Fair Share Allocation.
For example, assume that M1 supplies D1 and D2 and the following is true:
-
Demand at D1 = 50 units on day 3
-
Demand at D2 = 50 units on day 4
-
Supply at D1 = 20 units on day 1
-
Supply at D2 = 25 units on day 1
-
Lead time = 1 day
The following table shows the times and locations of unconstrained demands. Notice that the demand times at M1 are impacted by the 1 day lead time.
| Org | Supply/Demand | Day 1 | Day 2 | Day 3 | Day 4 |
| D1 | Unconstrained Demand | 50 | |||
| Available Supply | 20 | ||||
| Unmet Demand | 30 | ||||
| D2 | Unconstrained Demand | 50 | |||
| Available Supply | 25 | ||||
| Unmet Demand | 25 | ||||
| M1 | Unconstrained Demand | 30 | 25 | ||
| Available Supply | 40 |
This does not show any pegging information. To know how the units were fair-shared, the planner can double-click on the 40 units and expand the demand pegging to see how this supply is allocated to the demands from D1 and D2.
Creating Comments
Planners can specify comments for a service part. These comments are always in context to the part.
Comments persist from one plan run to another. The comments are specific to an item and are valid across plans. Knowing in which plan the comments were entered is useful. Thus, while saving the comments, the plan name is also saved. The original plan name appears in the comments.
To enter new comments for a service part
-
Click the Add/Edit Comment icon in the Comments section of the Worksheet.
The Comments window appears. Here, you can create, view, assign, and save comments associated with the item.
Description of key fields Field Default Value Meaning Creation Date-Time Not enterable System date and time at the time of entering the comments Created By Not enterable User who entered the comments Assigned To Null You can change to any user in the system. The LOV contains all the users in the system having one of the service planning responsibilities. Due By Null You can change to any future date. LOV opens the calendar. Status Null LOV: Open, Closed, Pending, and Note. Plan Name Not enterable Name of the plan in which the comment is entered Comment Details -- Text of the comment -
To enter a new comment, click the Add New Comment icon in the main toolbar.
This adds a new row, in which you can enter comments.
-
Enter the text of your comments in the Comments Details dialog box. The comment text area displays the entire text for the currently selected comment row.
-
To erase the selected comment, click Delete.
-
To discard any changes in the Comments table and dismiss the dialog, click Cancel.
-
To save the current state of the comments table to the database, click Save.
Plan Actions (Exception Region)
Actions View within Supply/Demand Analysis
The lower-right region of Supply/Demand Analysis displays exception messages for the chosen context of items and organizations.
The display features are:
-
Exceptions for the chosen item and organization context
-
Displayed columns are shown in the following list:
-
Exception Description: A string value that is a concatenation of some of the key exception detail attributes
-
Action Taken
-
Priority
-
Age
-
Count (All)
-
Count (Action not taken)
-
-
The ability to sort on any of these columns
-
The ability to choose from the right-click menu to navigate to Exception Details
Exception Details – Taking Action
You can take action on exception messages by selecting the Action Taken check box. This Action Taken status persists across planning runs. It is also used in conjunction with the Frequency setting on the Planner Work List to either include or exclude this action from the Planner’s Work List.
The Exception Details window design is similar to that of Exception Details in DRP in that the Related Exceptions Display appears at the bottom of the window.
| Feature | Description |
|---|---|
| Display of Custom Name | When you are navigating from a Planner’s Work List record to the Exception Details window, the exceptions’ custom names appear. |
| Additional Folder Columns | The following folder columns are available to Exception Details. These folder columns appear by default when you are navigating to the Exception Details window from the Planner Work List. Generated Date: The date on which this exception was originally generated in the plan (see Exception Persistence) Age: Calculated as (Sysdate – Generated Date) Priority: The priority of this exception as calculated by the Planner Work List Action Taken Date: The date on which the exception was marked as Action Taken Action Taken By: – The user who took action on this exception Note: When the Action Taken attribute is reset to No based on planning frequency, the Action Taken By column reverts to null. |
Exception Persistence
Exceptions persist from one plan run to another. When a plan runs, you can determine whether an exception message is a new one or one that existed in the previous plan run.
-
If a message is new, it is assigned a generated date equal to the plan run date and time.
-
If the message existed in the previous version of the plan, then the Generated Date and Action Taken status are inherited from the previous version.
The primary key (PK) for each exception type used to determine whether it is new or an existing exception is specified in the section"List of Exceptions in SPP".
List of Exceptions in SPP
The following types of information are contained in this list:
-
Name of exception group and exception type
-
A long description of the exception
-
The short description of the exception (to be used in the Supply/Demand Analysis screen)
-
The related exceptions to this exception
-
The right-click menu options that are enabled from this exception
-
The attributes shown in Exception Details window
-
The attributes that should be available as filter criteria in exceptions queries and planner work lists (and those criteria that allow Group By in an exceptions query)
-
Attributes forming the primary key of the exception for persistence purposes
-
Attributes identifying severity of the exception (to be used for threshold)
In Service Parts Planning, all exceptions are related to an item supersession chain. Service Parts Planning supports the following exceptions for usable parts:
-
Past Due Forecast
-
Past Due Sales Order
-
Forecast Method/Parameter Change Recommendation
-
Forecast Accuracy Audit Required
-
Late Replenishment for Sales Orders
-
Late Replenishment for Forecasts
-
Sales Order / Forecast at Risk
-
Material Shortage
-
New Buy Supplier Capacity Overloaded
-
Repair Supplier Capacity Overloaded
-
Orders with Insufficient Lead Time
-
Order Causes Supplier Capacity Overload
-
Demand Quantity is not satisfied
-
Organization Capacity Exceeded
-
Order Violates a Business Calendar
-
Order is Firmed Late
-
Order is Firmed Early
-
Items with a Projected Stockout
-
Manual Allocation Causes Projected Stockout
-
Items below Safety Stock
-
Items with Excess Inventory
-
Orders to be Rescheduled Out
-
Orders to be Rescheduled In
-
Orders to be Cancelled
-
Sales Order Line
-
Allocation Split
-
Order Quantity Change
-
Sales Order Cancellation
-
Changes Recommended For Sales Orders
-
Past Due Returns Forecast
-
Past Due Orders
-
Demand Satisfied using Supersession Item
-
Inventory Exists for Superseded Item
-
Internal Transfer Alternate / Changed Ship Method
-
Order Uses Circular Source
-
Planned Order Sourced From Alternate Facility
-
Planned Order Sourced From Alternate Supplier
-
Items with Negative Starting On Hand
-
Items with Expired Lots
-
Items with No Activity
-
Supplier Split Percentage Violated
-
Buy Orders
-
Internal Repair Orders
-
External Repair Orders
-
Inbound Shipments
Service Parts Planning supports the following exceptions for defective parts:
-
Material Shortage
-
Order Violates a Business Calendar
-
Order is Firmed Late
-
Order is Firmed Early
-
Items with a Projected Stockout
-
Items with Excess Inventory
-
Orders to be Rescheduled Out
-
Orders to be Rescheduled In
-
Orders to be Cancelled
-
Items with Negative Starting On Hand
-
Items with No Activity
-
Outbound Shipment of Defective Item
Replan Options Window
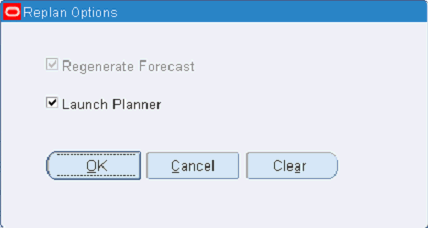
You use the Replan Options window to regenerate the plan for the entire supersession chain for this item across all organizations as specified by the plan.
To generate an incremental plan for the item being viewed
-
From the Supply Demand Analysis window click the Replan icon, or from the menu navigate Plan > Replan item.
The Replan Options window appears.
-
Click OK to submit the request.
The Replan Progress window is invoked on top of the worksheet.
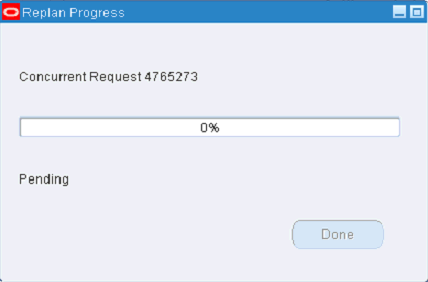
The Progress bar has the following statuses (or milestones) for the plan run:
-
Pending: This status appears while the concurrent program is waiting for a concurrent manager.
-
Running – Loading data: This status appears while the concurrent program is loading the data.
-
Running – Forecasting: When generate forecast is enabled, this status signifies forecasting in process.
-
Running – Supply Plan: When the planner is enabled, this status signifies supply planning in process.
-
Running – Exception calculations: When the planner is enabled, this status signifies exception generation.
-
Completed: This status indicates the concurrent request successfully completed.
-
Completed Warning. This status indicates that the concurrent request has finished, but with a warning.
-
Error. The concurrent request has an error.
-
Plan Summary Dashboard
The purpose of the Plan Summary dashboard is to answer the following questions:
-
What parts of the plan need my attention?
See Actions Summary and Planner Work List
-
What has the plan automated for me?
See the Order Summary.
-
Does my plan meet my targets?
See the Key Performance Indicators.
You access the Plan Summary dashboard by clicking the Plan Summary icon in the main toolbar.
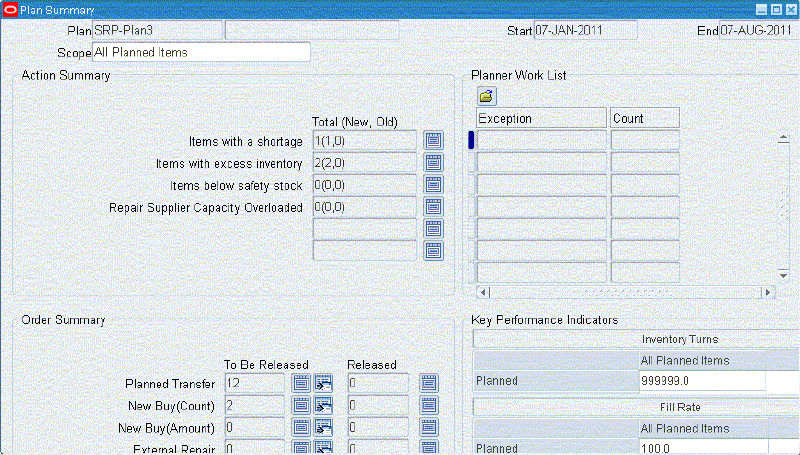
Scope
At the top of the Plan Summary window, the Scope list of values includes: All Planned Items and Items: <Planner>. One entry exists for each valid planner in this plan.
The list of valid planners for a plan is derived based on the unique list of planners as determined from the active planner work lists defined in the Plan Options.
For example, in the Plan Options, three planner work lists are defined
-
Planner Work List 1 > Access: Public > Group 1 > Planner 1, Planner 2
-
Planner Work List 2 > Access: Personal > Planner 3
-
Planner Work List 3 > Access: Personal > Planner 2
Then the planners in the drop down list are Planner 1, Planner 2, and Planner 3.
The following table describes Plan Summary region behavior based on scope.
| Region | All Planned Items | Items: <Planner Code> |
|---|---|---|
| Actions Summary | Show all exceptions | Show only those exceptions where Exception.Item.Planner = <Selection> If a certain exception type has no Item reference. then show all exceptions of that exception type |
| Planner Work List | Show the records of the current user’s planner work list | Show the records of the selected user's planner work lists |
| Order Summary | Show all orders, based on user preferences | Show only those orders where Order.Item.Planner = <Selection> |
| Key Performance Indicators | Show KPIs for all items | Show only KPIs calculated for items where Item.Planner = <Selection> |
Actions Summary
The Actions Summary section shows a set of six exceptions and their counts, summarized across the plan.
-
You can choose from the complete list which six exceptions you want to show in the Actions Summary.
-
The Actions Summary shows the total count of exceptions, split by the number of new exceptions and the number of old exceptions, as well as the total number of exceptions present in the prior run of the plan.
You can click the icon located next to the exception count to access the Exception Details window where you can view exception details.
Order Summary
The Order Summary shows a classification of orders based on order types, and the counts associated with each order type, based on the number of orders already released and those that are ready for release.
New Buy Amount = Sum of {Quantity * Purchasing Cost} across the set of New Buy Orders that fall into the Released and To Be Released buckets
Orders that fall into the To be Released bucket can be determined in two ways:
-
The specification of a time horizon. All orders with a start date within the time horizon are included in the To be Released bucket.
-
The specification of an orders query. All orders that are present in the query output are included in the To be Released bucket.
Planner Work List
An extract of records from the planner work list are shown. The default folder of the Planner Work List window is used.
See Creating Planner Work Lists.
Key Performance Indicators
This functionality provides the ability to:
-
View KPIs
-
As a Summary Chart
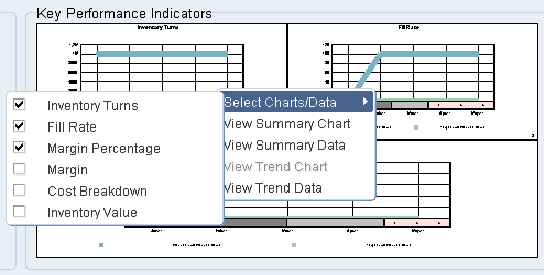
-
As a Summary Data Table
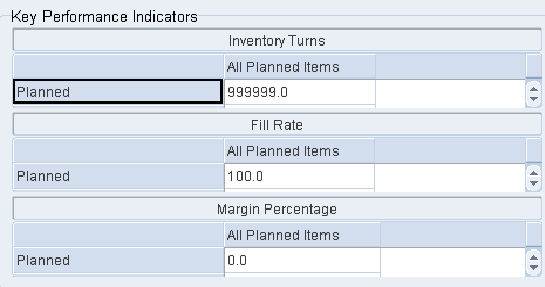
-
As a Trend Chart
-
As a Trend Data Table
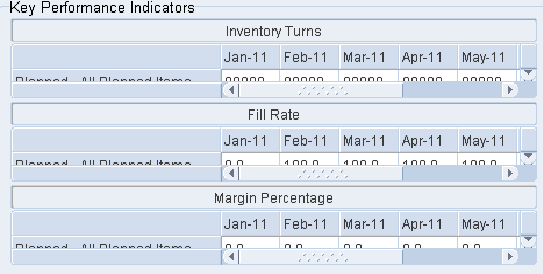
-
-
Switch between the following KPIs::
-
Inventory Turns
-
Inventory Value
-
Forecast Accuracy
-
Fill Rate
-
Margin
-
Margin Percentage
-
Cost Breakdown (Cost types are purchasing, inventory carrying, and transportation)
Note: Only three KPIs can be shown at a time. When three are selected, the other choices become disabled. To open the possibility of selecting another KPI, deselect one of the currently selected three.
-
Actions Summary Window
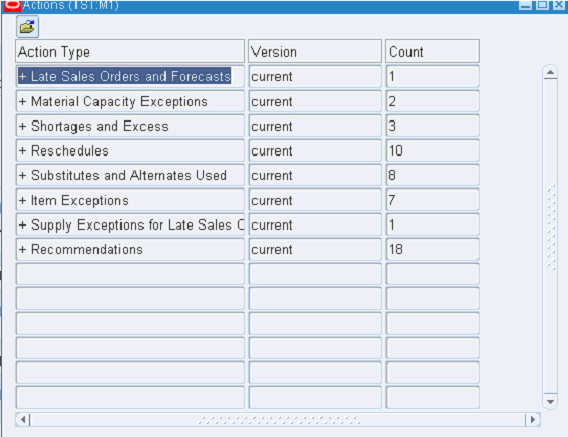
The Actions Summary window lists the action message types and quantities associated with implementing the selected plan. This summary is useful for assessing the impact of implementing alternative strategies.
To open the Actions Summary window, select the Exceptions Summary icon in the SPP toolbar
Creating Planner’s Work Lists
See also Creating an Order Query.
To create a new work list
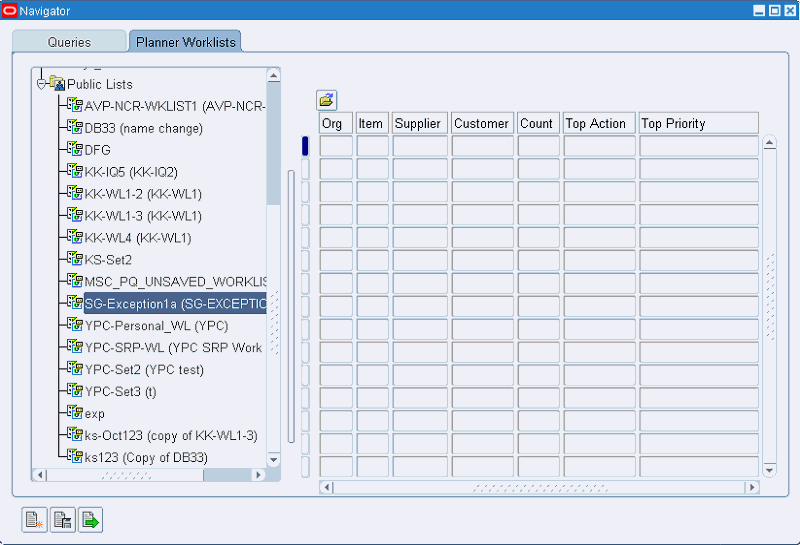
-
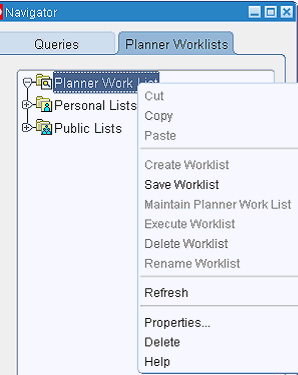
From the SPP main toolbar, click the Planner’s Work List icon, or navigate from the menu bar > Tools > Planner’s Worklist.
The Planner Work List tab appears on the Navigator window.
-
Planner Work List
-
Personal Lists: displays Planner Work List definitions that are marked as Public = No.
-
Public Lists: displays Planner Work List definitions that are marked as Public = Yes.
-
-
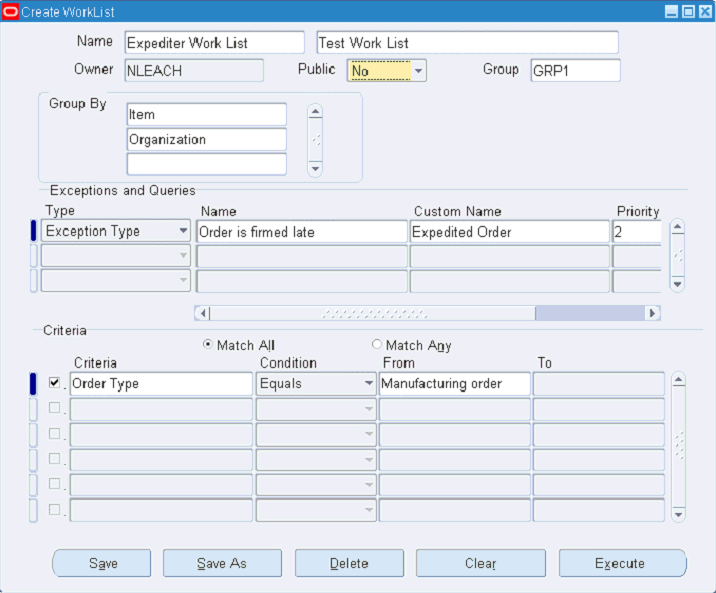
Right-click Planner Work List, and then select Create Worklist from the right-click menu.
The Create WorkList window appears.
-
Enter a name and description for the work list.
-
Determine whether this work list will be public or private.
-
Specify the group by criteria for displaying the results of the work list.
-
(Optional) Select a work group. See Defining User Groups.
-
In the Exceptions and Queries region, select the type from the list of values.
-
(Optional) Enter a customer name, priority, and frequency.
-
If you chose the Type: Exception Type, you can enter query criteria in the Criteria region.
-
To save this work list without executing it, click Save.
-
To save this work list against another name, click Save As.
-
To erase this work list, click Delete.
-
To erase selected portions of the work list, click Clear.
-
To create the work list, click Execute.
Note: To execute the work list, see Executing a Planner Work List.
Create Worklist Fields Header region Attribute Name Description Valid Values Default Values Name The name of the planner work list. The description field is shown beside name. Any String Owner Logon name of user who defined the planner work list Non enterable field Public Indicates whether this planner work list is available to just this user or to other users as well. LOV: Yes, No Depends on whether user entered this window from Public Lists (Yes) or Personal Lists (No) Group The name of a group of users. This field is enabled only if Public = No. Even though private, the work list is available to members of the specified group. See Defining User Groups. A group defined in the User Groups form. Group By region The selected criteria are used to group the results of executing the planner work list. One or more of the criteria can be selected. The available criteria are: -
Item
-
Organization
-
Supplier
-
Supplier Site
-
Customer
-
Customer Site
-
Exception Type
-
Category
-
Planner
The Group By specified in the planner work list overrides the Group By specified in the exceptions query.
Item and organization are default Group By values for a planner work list. You can change these default values in preferences.Note: Validation requires at least one Group By value.
Exceptions and Queries region Attribute Name Description Valid Values Default Values Type The type of planner work list entry Exception Type, Exceptions Query, Items Query, Orders Query Not applicable Name The name associated with the chosen type. Note: You can specify the same exception name in more than one row, provided different custom names are created.
If type = Exception Type, then LOV contains all valid SPP exceptions (including Collaborative Planning exceptions)
If type = Exceptions Query, then LOV contains all existing defined queries of type Exception (valid for this user)
If type = Items Query, then LOV contains all existing defined queries of type Item (valid for this user)
If type = Orders Query, then LOV contains all existing defined queries of type Orders (valid for this user)Not applicable Custom Name The custom name that applies to the seeded exceptions Custom Names are only specifiable if Type = ‘Exception Type’ Not applicable Priority This is the priority associated with the underlying actions once the planner work list is executed Integer >=1 Note: Although two lines within the same planner work list, or two planner work lists, can refer to the same underlying action message but with different priorities, only a single priority is maintained at the Action Message level. Overlapping results between two work lists, or between two lines in the same work list definition is an undesirable result of inconsistent setup.
When multiple planner work lists attempt to prioritize the same action message, the action message is assigned the maximum priority attempted by the multiple work lists.
Not applicable Frequency Time period, in days Integer >= 0
The frequency is used as follows:
If an exception has Action Taken, then at the time the planner work list is executed again, the following check is performed:-
Planner work list execution date > (action taken date + frequency)?
-
If Yes, this exception can cause an Item to be in the planner work list. Exception is reset to Action Taken = No.
-
If No, this exception cannot be the cause of an item being in a planner work list and will not be visible through the planner work list.
-
Zero frequency means that this exception is valid every time the planner work list is executed.0 (zero) Criteria region The criteria section lists the criteria that can be specified on an exception type.
For any exception with an Item reference All Items, query criteria is available in the Criteria section with the Item – prefix, for example, Item– Processing Lead Time. -
Windows Available from the Worksheet Tools Menu
You can navigate to the following windows from the Worksheet Tools menu.
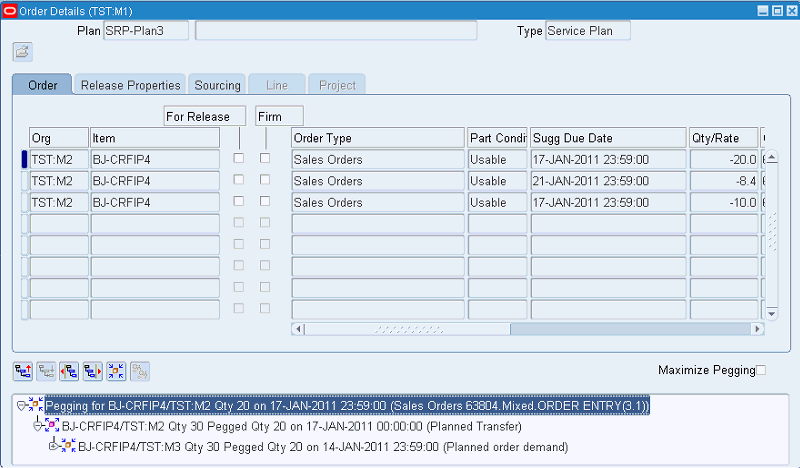
Order Details
The SPP Plan Order Details has three enabled tabs:
-
Order
-
Release Properties
-
Source.
These are similar to the corresponding tabs in ASCP and DRP. See "Supply/Demand Window" in the "Planner Workbench" chapter of the Oracle Advanced Supply Chain Planning Implementation and User Guide.
Select the Maximize Pegging check box to expand the lower pane of this window.
Parts Usage
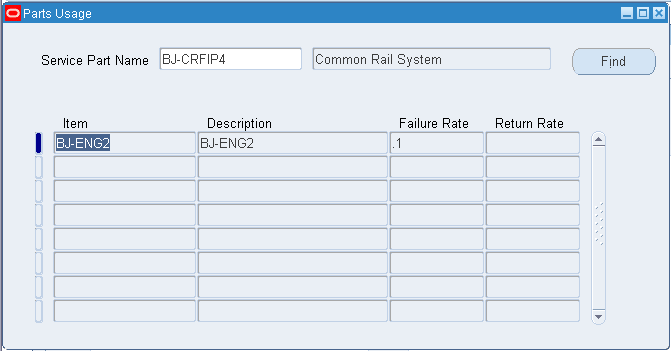
Planners can open the spare Parts Usage window in context of the selected item. This window lists all the products, or spare part modules, in which this particular part is used for maintenance or service. This is a view of what is defined in the Failure Rates window.
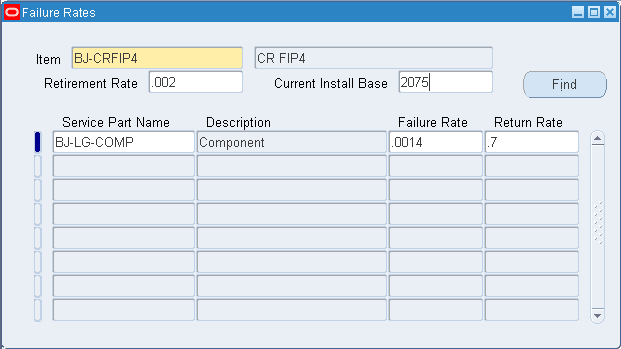
Failure Rates
In context of a product, the Failure Rates window enables you to define failure rates and return rates for product and service part combinations.
Parent product to child relationships can be collected from Spares Management. Collections pulls and displays this data in the Failure Rates window, as well as in the Parts Usage window. Failure rates can be uploaded using flat file or legacy loads. You can also manually update failure rates.
For related information, see Determine Service Part Failure Rates.
Pegging Properties
From the Order Details window, right-click the pegging tree. From the right-click menu you do one of the following actions:
-
Expand the pegging tree
-
Refresh or open the pegging properties window.
The following information is shown in the pegging properties window:
-
Item/Organization
-
Item Description
-
Source Org/Supplier
-
Supply Type
-
Supply Date
-
Need by Date
-
Quantity
-
Order Number
-
Unit Number
-
Project
-
Task
-
Lending Project
-
Lending Task
-
End Customer
-
End Item/Organization
-
End Item Description
-
End Demand Type
-
End Demand Date
-
End Satisfied Date
-
End Demand Quantity
-
End Demand Pegged Quantity
-
End Order Number
-
End Unit Number
-
End Project
-
End Task
-
End Demand Calculated Priority
-
End Demand Source Priority
-
End Lending Project
-
End Lending Task
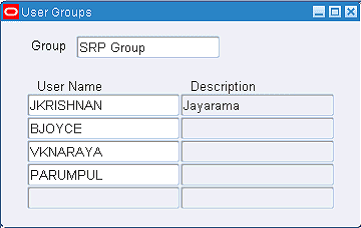
Defining User Groups
-
From the Service Supply Chain Planner responsibility, navigate to the User Groups window.
Setup > User Groups
-
A free-form group name can be entered against one or more users in the form to group them together. The User Groups form displays all users associated with the Service Supply Chain Planner responsibility.
-
Click Save. This is the group that can then be specified in the Create Work List definition form.
Executing a Planner Work List
You can execute planner work lists in two ways.
-
As part of a plan run, if this planner work list is specified through plan options. See Specifying Planner Work Lists as Part of Plan Run.
-
From the Planner Work List tab in the Navigator, select a planner work list, and then select the Execute Worklist icon.
Specifying Planner Work Lists as Part of Plan Run
A set of planner work lists as specified in the following form are precomputed as part of the plan run. The form is accessible from the Plan Options form for SPP by clicking the Planner Work Lists button in the Main tab.
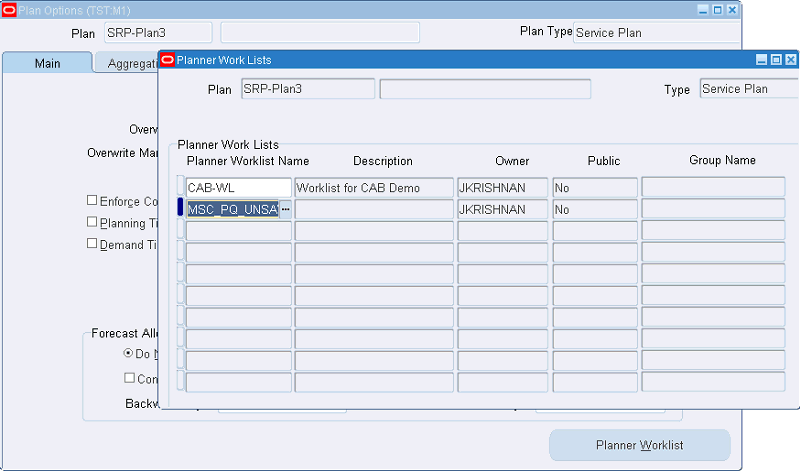
Planners can add planner work lists that they have defined, as well as planner work lists defined for user groups to which the planners belong. Further, planners can select one of the public work lists as a default work list. The default public work list is available for planners who do not have any work lists defined in User Preferences.
In interactive planning, the work lists associated with the plan are not refreshed online. An offline concurrent request is submitted to refresh the work lists. When planner accesses work lists that are in the process of being generated, the following warning message appears:
The work list is currently being refreshed. Please reopen the work list when concurrent request ______ has completed.
If the user selects Yes, then the work list is not opened. If the user selects Cancel, then the work list opens. However the data will be old or will be missing, if the previous data has already been deleted as part of the refreshing process.
Viewing Planner Work List Results
To view the results of executing a planner work list
-
Click the View Planner Work List icon in the SPP toolbar.
The default planner work list for this user appears.
-
To view a non-default work list, open the pull-down list of planner work lists that are available to you, and then select one.
The Planner Work List Results window is similar to the Query Results window. Similar to the Query Results, this portion of the window appears to the right of the Navigator. By default, the navigator is hidden
Features of the Planner Work List Results window Feature Description Folder This window is folder-enabled as well as Folder > Find-enabled. The folder columns are: -
Item
-
Org
-
Supplier
-
Supplier Site
-
Customer
-
Customer Site
-
Exception Type
-
Category
-
Planner
Default Columns When the Planner Work List window is opened as a result of executing a planner work list query, the default columns displayed always include: -
Notes
-
Top Priority
-
Top Priority Action
-
Total Count
In addition, the default columns displayed always include the columns chosen as Group By. For example, if Item and Organization are chosen as Group By, then Item and Organization columns appear by default when the planner work list is executed.Note: If the user has specified a default folder for the Planner Work List window, then the default folder definition dictates which columns to show or hide.
Notes This Notes column displays the Notes icon, which appears as a paperclip, if supersession notes are assigned to this record. For more information, see Viewing Supersession Notes. Top Priority This is the highest priority among all the actions within the chosen level of Group By for that record in the planner work list. Top Priority Action This is the action message associated with the top priority. If multiple action messages share the same top priority, then one is chosen at random. If the top priority corresponds to an items query or orders query, the corresponding query names are shown. Total Count The total count of actions for that planner work list record Right-Click Menu The right-click menu on records in the planner work list includes the usual forms right-click options plus the following:
Planner Work List - Exceptions: All the underlying flagged exceptions for this planner work list record opens in the Exceptions Details window. If this planner work list record has no exceptions associated with it, this right-click option is disabled, or grayed out.
Planner Work List - Orders: All the underlying supplies that are flagged as a result of including orders queries within the planner work list open in the Supply window.Note: A folder column called Planner Work List Priority appears in the Supply window, and is visible by default only when the Supply window is accessed using this right-click option.
Planner Work List - Items: All the underlying items that are flagged as a result of including items queries within the planner work list open in the Items window.Buttons The following enabled buttons appear at the bottom of the Navigator. -
Supply/Demand Analysis: Opens the Supply/Demand Analysis window for this item. This button is enabled only if the Group By definition includes Item.
-
Supply: Opens the Supply window to show all supplies for the chosen record using the Group By criteria as filters. For example, if Group By is item and organization, then all Supplies for the item and organization are shown. If Group By is supplier and item, then all supplies for that item and supplier combination are shown.
-
Items: Opens the Items window to show all the Items for the chosen record using the Group By criteria as filters.
-
Exceptions: Opens the Exception Details window to show all exceptions for the chosen record using the Group By criteria as filters.
-
Comments: Opens the Comments window for the chosen record. This button is enabled only if the Group By includes Item.
-
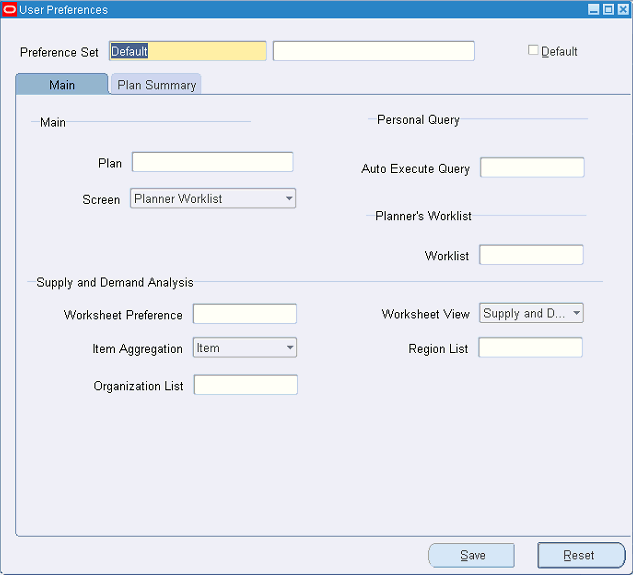
User Preferences Window - Main Tab
You can create named preference sets on the User Preferences window. On the Main tab, you can specify default preferences for:
-
Main:
-
Default Plan Name
-
Default window
-
-
Personal Query for Auto-Execution
In addition to specifying an item, exception, supplier, or resource query for auto-execution, you can specify an order query here.
-
Planner’s Work List Name
-
Supply and Demand Analysis:
-
Worksheet Preference Name
-
Worksheet View
-
Level of Item Aggregation
- Item
- Prime
- Supersession
-
Region (Zone) List Name
-
Organization List Name
-
Saving User Preferences saves the region configuration of the Supply and Demand Analysis window. For example, you minimized the Item Location and Comments regions. The worksheet shows just the Supply and Demand worksheet and the Exceptions Summary. When you save and then reopen the Supply and Demand Analysis window, the window retains this configuration.
When both the organization list and zone list are specified, when you open the Supply and Demand Analysis window, the default view is the organization context. The zone list is disabled, or grayed out. By default, all organizations appear.
User Preferences - Plan Summary Tab
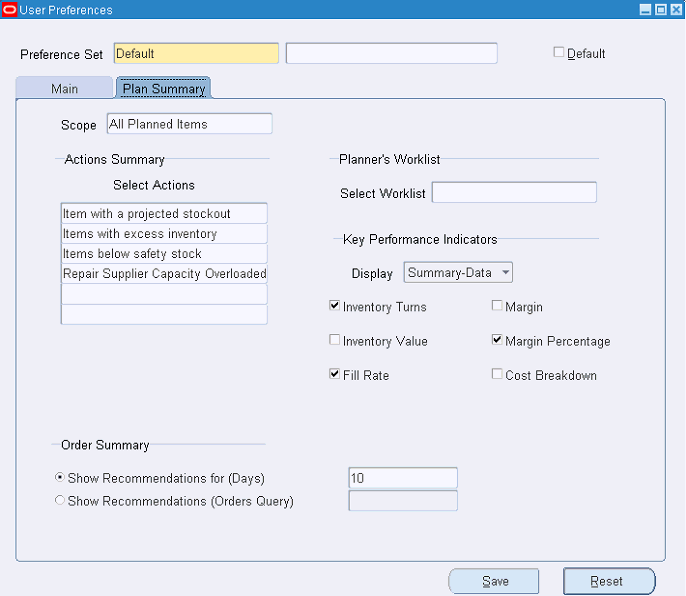
You access the Plan Summary User Preferences window by clicking the User Preferences icon in the main toolbar, or from the menu, select Tools > User Preferences. On User Preferences, select the Plan Summary tab.
The table describes the regions and fields on the Plan Summary tab.
| Region – Field | Description | Valid Values | Default Value |
| Preference Set | The name (and description) of the preference set. | ||
| Default | Indicates that the named preference set is to be the default preference set. | Yes, No | No |
| Default Scope | Determines whether the Plan Summary scope opens with the scope set to All Planned Items or to a specific Items: <Planner Code> | All Planned Items, Items: Planned Items, Items: <Planner Code> | All Planned Items |
| Actions Summary – Select Actions | Actions Summary – Select Actions | LOV exceptions See List of Exceptions in SPP. |
|
| Order Summary – Show Recommendations for (Days) | The radio button for selection enables the field for specifying the number of days to show for release recommendations. | Positive integer | 10 |
| Order Summary – Show Recommendations (Orders Query) | The radio button for selection enables the field for specifying the order query for release recommendations. | Any valid orders query name | |
| Planner Work List – Select Work List | This LOV of valid planner work lists is displayed for choosing a different planner work list. | LOV containing the list of valid planner work lists for the user. | |
| KPI Display | This LOV provides a choice of default KPI display types. | Trend-Chart, Trend-Data, Summary-Data, Summary-Chart | Trend-Chart |
| Default KPIs to show | Check boxes for selection of available KPIs | Select maximum of three KPI check boxes |
Pegging in SPP
Pegging in SPP is done level by level. You can see supply to demand pegging (and vice versa) across multiple levels of the supply chain. The supply and demands shown in the pegging user interface are the constrained supplies and demands as calculated by the planning engine. Because end-demand pegging is not supported, you do not necessarily have visibility to the exact quantity allocated to a given end demand, for a given supply, occurring at all locations in the supply chain.
Example of level-by-level pegging:
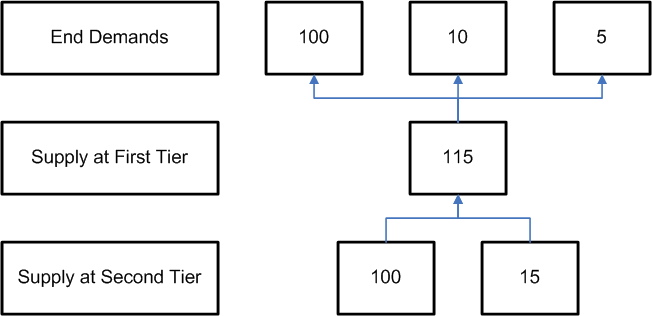
At the second tier supply node of 100, you cannot determine how many of the 100 are being allocated to each of the end demands of 100, 10 and 5. However, you can ascertain that the supply of 100 can potentially impact all three end demands that the parent (first tier) supply is pegging to.
Queries
Creating an Order Query
For SPP, the two query types are (order) queries and planner work lists. An order query is a set of conditions that, when evaluated, results in a set of orders. Order queries are similar to an item queries or exceptions queries available in the VCP suite.
-
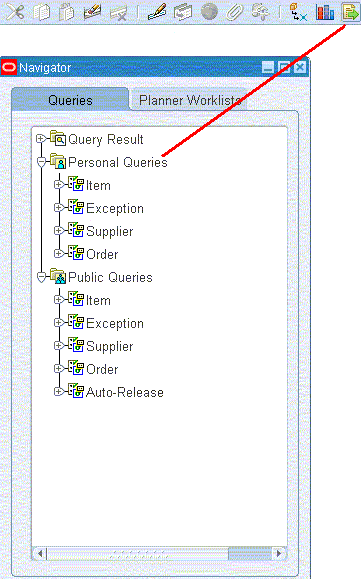
Click the Query tool in the toolbar to reveal the set of queries associated with the plan.
-
To create a new order query, right-click the Order Query tab, and then choose the Create Query option from the right-click menu.
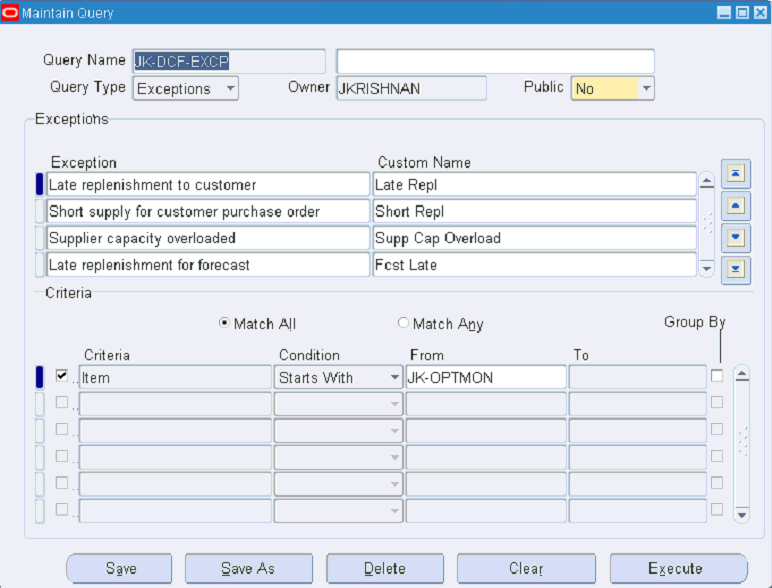
The Maintain Query window appears.
-
You use the Maintain Query window to create or edit queries.
-
To create a new query, enter the query name and optionally, the description.
-
To edit an existing query, inquire on the query name field, and then select the query.
-
-
Select the query type. The query type Order is available for SPP users.
-
The Owner field is automatically completed from the user logon information.
-
Determine whether the query will be public, or available only to the owner.
-
In the Exceptions region, select an exception from the list of values. You can use the arrows to organize the sequence of exceptions.
-
\
In the Criteria region, define the criteria for the highlighted exception. The set of allowed criteria for an order query and the associated conditions that go with them are summarized in the table Available Criteria for Order Queries.
-
Select a radio button to determine whether all or any one of the criteria specified in the query criteria need to be satisfied for an order to be displayed upon executing the query.
-
To save the query without executing it, click Save.
-
To save the query against a different name, click Save As.
-
To erase the highlighted exception, click Delete.
-
To erase the selected criteria row, click Clear.
-
To execute the query, click Execute.
Available Criteria for Order Queries
The set of allowed criteria for an order query and the associated conditions that go with them are summarized in the following table.
| Criteria | Condition | From | To |
|---|---|---|---|
| Order Type | Equals, Is not, Among, Starts with |
Order Types LOV | |
| Due date, Dock date, Ship Date, Order Date, Start Date, |
Equals, Is not, Between, Days from today, Among, Outside, Greater than, Less than |
<Value> <Value> <Value 1> <Value> <Value> <Value 1> <Value> <Value> |
<Value 2> <Value 2> |
| Quantity | Equals, Is not, Between, Less than, Greater than, Among |
<Value> <Value> <Value 1 > <Value> <Value> <Value 1> |
<Value 2> <Value 2> |
| Amount | Equals, Is not, Is less than, Is greater than, Between |
<Value> <Value> <Value> <Value> <Value 1> |
<Value 2> |
| Supplier | Equals, Is not, Among, Between, Starts with |
LOV | |
| Customer | Equals, Is not, Among, Between, Starts with |
LOV (Customers and technicians modeled as customers) | |
| Item | Equals, Is not, Among, Between, Contains |
LOV <Value> |
|
| Ship From , Ship To |
Equals, Is not, Among, Between, Starts with |
LOV Organization, Customer, Supplier |
Location Customer Site Supplier site |
| Order Number | Equals, Is not, Among, Between, Outside, Starts with, Greater than, Less than |
LOV | |
| Planner | Equals, Is not, Among, Between, Starts with, Contains |
LOV | |
| Change forecast method or parameter Late Replenishment for Sales Orders Late Replenishment for Forecasts Sales Order / Forecast at Risk Allocation Constraint New Buy Supplier Capacity Overloaded Orders with Insufficient Lead Time Order Causes Supplier Capacity Overload Demand Quantity is not satisfied Organization Capacity Exceeded Order Violates a Business Calendar Order is Firmed Late Order is Firmed Early Items with a Projected Stockout Items Below Target Inventory Level Items Above Target Inventory Level Items above Maximum Inventory Level Manual Allocation Causes Projected Stockout Items below Safety Stock Items with Excess Inventory Orders to be Rescheduled Out Orders to be Rescheduled In Orders to be Cancelled Sales Order Line Allocation Split Order Quantity Change Sales Order Cancellation Changes Recommended For Sales Orders Past Due Returns Forecast Past Due Orders Demand satisfied using Supersession Item Inventory Exists for Superseded Item Internal Transfer |
Does not exist |
Combining Existing Queries to Create a New Query
You can combine multiple existing queries, each with an associated set of query criteria, to create a new order query.
-
Choose the names of existing custom queries.
For example, consider an order query consisting of two queries and associated criteria:
-
Query 1 – Good Transfer Orders
Criteria:
Order Ship Date < 1 week from today, and
Order Type Equals Planned Transfer, and
Forecast Exception does not exist
-
Query 2 – New Buy Orders
Criteria:
Order Ship Date < 1 week from today, and
Order Type Equals New Buy
-
-
Select either Match All or Match Any to define whether all or at least one of the criteria specified in the query criteria need to be satisfied for an order to be displayed upon executing the query.
When this new order query is executed, the display includes:
-
Transfer Orders, with no Forecast Exceptions on the item transferred, which are shipping within one week from today, and
-
New Buy Orders that are shipping within a week from today.
-
Orders resulting from the execution of each custom query in this set are displayed together. This query does not display any other type of order, such as a repair order. It also filters out transfer and new-buy orders with ship dates that are beyond one week from today.
Auto-Execute Order Queries
Order queries can be automatically executed when a workbench is opened. This is defined in the Workbench Preferences, under the Main tab. In addition to specifying an item, exception, supplier or resource query for auto-execution, you can also specify an order query for auto-execution.
Order Queries and Supply Demand Find Criteria
Executing an order query retrieves a set of orders in the Supply window. If the Default folder in the Supply Demand window has any criteria for filtering the set of orders to be displayed, these criteria further filter the set of orders that result from executing the order query.
To see exactly the set of orders that result from executing an order query, disable the order FIND criteria in the Default folder. This ensures that the folder serves only as a mechanism for controlling the layout and sorting the orders in the display.
Deleting Order Queries
When an Order Query is deleted, you receive the same warning message that the system issues when you delete public and private item queries.
Creating Workbench Queries for Auto-release
An auto-release query is created like any other query (go to Service Parts Planning > Workbench, select the Queries tab in the Workbench Navigator, right click on Public Queries, and select Create Query). The Create Query form has an Auto-Release check box. Checking this allows the query to be used for auto-release by causing it to appear in the Plan Options > Release Rules screen. Also, auto-released queries will show up in the Navigator under the list category "Auto-Release."
Note: The Public drop down list automatically defaults to Yes when Auto-Release is checked. Auto-Release queries are not allowed to be Private.
If an Auto-Release Query is updated and the user unchecks the auto-release check box, a warning message will appear. This reminds the user that the query will no longer be available to the auto-release rules.
For information on associating query-based release rules to in the Plan Options, see the section Release Rules Tab in the chapter Defining Service Plans.
Queries for Halting Auto-release
You may want to include a query in the auto-release rules that measures the validity of the generated forecast, and if the result is outside a given range, halt the auto-release. Queries can therefore be based on the following criteria for determining forecast validity. These show up as query criteria options.
-
Quantity in excess of EOQ = (Planned Order Quantity – EOQ for the Item-Org)
-
% excess over EOQ = (Planned Order Quantity – EOQ for the Item-Org) / (EOQ for the Item Org)
-
Quantity in excess of Average Demand Qty = (Forecast Quantity – Average Demand for the Item-Org)
-
% excess over Average Demand Qty = (Forecast Quantity – Avg Dmd the Item-Org) / (Avg Dmd for the Item-Org)
Using Demantra Metrics
The following query criteria options can also be used for halting auto-release when interfacing with Demantra.
| Metric in Demantra | Name in SPP |
| SPF MAPE (In Sample) | Mean absolute Percentage Error |
| SPF MAPE (Out of Sample) | Forecast to Actuals Deviation % |
| SPF Forecast Volatility | Forecast Volatility % |
| SPF Average Demand | Average Demand Qty |
-
SPF MAPE (In Sample) - Shows how well the generated forecast fits the actual historical data displayed as a percentage
-
SPF MAPE (Out of Sample) - Compares the actual sales data as it becomes available in the system to the forecast for a specified time period, and displays the difference as a percentage.
-
SPF Forecast Volatility - Calculates the difference between the previous and current forecast periods, and displays this value as a percentage
-
SPF Average Demand – Calculates the average demand for an item during the period.
Viewing Supersession Notes
Customers often require the ability to add free-form notes associated with a supersession relationship definition. These notes usually contain more detailed information about the relationship (for example, a case where the supersession is for dangerous goods, or when there is a complex supersession).
While these notes are created Oracle Spares Management application, SPP provides the ability to collect supersession notes. Once collected, the notes can be displayed within SPP so that the planner is aware of them and can view them. For information performing supersession notes collection, refer to Collecting Supersession Notes.
Note: Supersession notes (attachments) are created in Oracle Spares Management and are collected to Service Parts Planning only for display. Use Oracle Spares Management to create, modify or delete supersession notes. Refer to Oracle Spares Management User Guide for information on supersession notes.
To view supersession notes
-
Navigate to one the following windows to access supersession notes:
-
Planner Worklist tab in the Planner’s Workbench
-
Supply Demand Analysis
-
Supersession Chain
-
-
Right-click on a row that displays Notes icon (paperclip) and select Notes Summary.
The Notes Summary window appears and displays the following the read-only information:
-
From Item - For a supersession attachment type, this field represents the from-item of the supersession.
-
To Item - For a supersession attachment type, this field represents the to-item of the supersession.
-
Attachment Type - Displays Supersession to indicate that this is supersession note.
-
-
To view the note, right-click on a row and select Notes Details.
The Notes Details window appears. The note information appears at the bottom of the window.
-
If multiple lines appear in Notes Details window, select the row to display the note for that supersession.
Review Workflow Notifications
Oracle SPP's powerful collaboration features enable you to automate and streamline your interactions with customers and suppliers.
You can automate the processing of exceptions which lets you take corrective action more quickly and efficiently, driving overhead costs out of your process.
You can define the process that a Workflow Notification should follow which includes the routing for the exception notifications, actions available to the recipient of the notifications, and the approval steps. The messages can be viewed either in Applications or via E-mail. Certain response actions may be required.
This table shows the standard workflow processes which generate various types of exceptions.
| Process | Exception Types |
| Item Workflow |
|
| Rescheduling Workflow |
|
| Sales Order Workflow |
|
| Material Workflow |
|
Workflow Notifications and Activities
You can automatically forward exceptions (using Oracle Workflow) to your trading partners. They can research and respond to exceptions through self-service web applications. Trading partner responses can trigger other workflow activities such as a notification or an automatic reschedule of a purchase order or sales order.
Re-order Point Based Planning
Viewing Re-order Point Based Planning Attributes
The attributes Compute Safety Stock Value, Compute EOQ, Order Cost, and Safety Stock Value are visible in the Item parameters section of the Supply Demand Analysis window, and in also the items screen so the planner can review these values.
Similarly, these attributes are visible in the Items form.
In addition to these, the Safety Stock Value appears in the ‘Safety Stock’ row of the Supply Demand Analysis window.
Note: The Safety Stock Value shown in the Items section of the SDA analysis screen is the input to the plan, and is editable (see below).
Example: Start with a date effective supersession as follows:
A > B after 10Jan.
SS on A = 40, SS on B=50 (as set in the IMM)
In this case, IMM and MSC_SYSTEM_ITEMS would be as follows:
| Item | Safety Stock Value |
| A | 40 |
| B | 50 |
The engine reads these two pieces of information and sets the safety stock target as follows:
| Item | 01-Jan | 02-Jan | 03-Jan | 04-Jan | 05-Jan | 06-Jan | 07-Jan | 08-Jan | 09-Jan | 10-Jan | 11-Jan | 12-Jan |
| A | 40 | 40 | 40 | 40 | 40 | 40 | 40 | 40 | 40 | 0 | 0 | 0 |
| B | 0 | 0 | 0 | 0 | 0 | 0 | 0 | 0 | 0 | 50 | 50 | 50 |
On the SDA window, in the top (Items) section, safety stock for Item A =40 and Item B=50. In the lower portion, values appear similar to the table above.
Now the planner can edit the Items in the upper section of the SDA, but not the lower section. If the SS for Item B is changed to 45 and saved to the simulation set, as below, the IMM is updated to 45 and the engine will consider SS as follows:
| Item | 01-Jan | 02-Jan | 03-Jan | 04-Jan | 05-Jan | 06-Jan | 07-Jan | 08-Jan | 09-Jan | 10-Jan | 11-Jan | 12-Jan |
| A | 40 | 40 | 40 | 40 | 40 | 40 | 40 | 40 | 40 | 0 | 0 | 0 |
| B | 0 | 0 | 0 | 0 | 0 | 0 | 0 | 0 | 0 | 45 | 45 | 45 |
This will then be reflected in the lower portion of the SDA.

