SQL Trace
SQL Trace
The SQL trace facility provides you with performance information on individual SQL statements. You can enable the trace facility for either a session or an instance.
For each SQL statement traced, the following performance information is generated:
-
SQL statement text
-
Parse, Execute and Fetch count, CPU/elapsed times, physical/logical reads and rows processed
-
The optimized goal
-
Misses in the library cache during parse
-
The Explain Plan at time of SQL execution (Oracle 8.1.6+)
-
User for which the parse occurred
-
Recursive SQL depth
When you enable the trace facility, the performance information for executed SQL statements is written out to a trace file until the SQL trace facility is disabled.
Note: You need Oracle 8.1.6 and Oracle Applications Release 11i or later to be able to use SQL Trace.
Using SQL Trace
To use SQL Trace, first enable it, then the desired SQL application/process/statement(s) are executed. When all the SQL statements have been executed, SQL Trace is disabled.
Viewing the Content of the Trace
Once you have generated the Trace file, you can convert it into a user-friendly report using the Oracle reporting program TKPROF. Alternatively, you can view the generated raw trace file directly.
Using SQL Trace
Note: If you enable SQL Trace, an additional processing overhead is incurred, although the impact on performance is minor.
Enabling SQL Trace
You enable and disable SQL Trace through the init.ora parameter sql_trace. The parameter accepts a Boolean value of TRUE or FALSE. The parameter is set at the system level in the init.ora file. Alternatively, you can set it dynamically for a session using the SQL command ALTER SESSION, or PL/SQL dbms_session.set_sql_trace, dbms_system.set_sql_trace_in_session.
These are Oracle supplied packaged procedures.
Related Trace init.ora Parameters
The following table details parameters that enable timings, directory location, maximum trace file size and trace file access protections to be specified and adhered to when SQL Trace is enabled.
| Parameter | Meaning |
|---|---|
| timed_statistics | Specifies if time statistics are to be collected or not. Valid values are TRUE or FALSE. The timing has a resolution of 1/100th of a second. Any operation that is less than this may not be timed accurately. If this parameter is FALSE, timings are not recorded and are shown as 0 in the trace file. For tkprof the 'cpu' and 'elapsed' times will be 0. |
| max_dump_file_size | Specifies the maximum SQL Trace file size in O/S blocks if just a number, bytes if K or M is specified or unlimited if UNLIMITED is specified. If the size of the trace exceeds the size of max_dump_file_size then the *** Trace file full *** message appears at the end of the file. |
| user_dump_dest | Specifies the directory where the SQL Trace is to be placed. If the values is ?/log then ? means $ORACLE_HOME because the DBA has not changed the default trace file destination. |
| _trace_files_public | Specifies if a trace file is written out with public access settings. Valid values are TRUE or FALSE. |
init.ora Parameters
You can view these init.ora parameters from an Oracle Session by examining the v$parameters table below:
SELECT name
,value
FROM v$parameter
WHERE name IN
('timed_statistics'
,'max_dump_file_size'
,'user_dump_dest'
,'_trace_file_public');
NAM VALUE
----------------- ------
timed_statistics TRUE
user_dump_dest usr/oracleHR/log
max_dump_file_size 204800
_trace_file_public TRUE
Selecting SQL Trace init.ora Parameters
You can set the timed_statistics and max_dump_file_size dynamically at either the session or system level, using the ALTER SESSION or ALTER SYSTEM commands.
ALTER SESSION SET timed_statistics=TRUE;
ALTER SYSTEM SET timed_statistics=FALSE;
ALTER SESSION SET max_dump_file_size=204800;
ALTER SYSTEM SET max_dump_file_size=204800;
You can only set the user_dump_dest parameter dynamically at the system level. You can only set the _trace_file_public parameter in the init.ora file.
Tracing Oracle Payroll Processes and Reports
When SQL Trace is enabled for Oracle Payroll processes, each process produces a trace file for the session in which the Trace is executed. If the process is run in parallel, for example, the Payroll Run, a trace file is produced for each thread.
You can enable and disable Trace for Oracle Payroll processes and reports by setting the parameter TRACE in the PAY_ACTION_PARAMETERS table. You can do this by one of two methods, using SQL *Plus, or the Action Parameters window.
Method 1: Using SQL *Plus
You can set the parameter to Y (enable trace), or to N (disable trace). For example:
/* To enable SQL Trace */
UPDATE pay_action_parameters
SET parameter_value = 'Y'
WHERE parameter_name = 'TRACE';
COMMIT;
/* To disable SQL Trace */
UPDATE pay_action_parameters
SET parameter_value = 'N'
WHERE parameter_name = 'TRACE';
COMMIT;
Method 2: Using the Action Parameters Window
Alternatively, you can enable Trace using the Action Parameters window.
-
Select Trace as the parameter name.
-
Enter Y to enable trace, or N to disable trace.
Tracing HRMS Application Forms
You can trace HRMS Application forms if the system administrator has granted access to the 'HR Debug Tools' facility.
-
Select Help->Diagnostics->Trace from the menu option.
-
Check the Trace check box.
Uncheck the Trace check box if you want to disable the utility.
Dynamically Tracing from SQL *Plus
You can use either the ALTER SESSION or PL/SQL packaged procedure dbms_session.set_sql_trace to trace from SQL *Plus. Whichever method you use, SQL_TRACE is enabled, the SQL statements are executed and SQL_TRACE is disabled to stop the trace.
SQL> ALTER SESSION SET SQL_TRACE=TRUE;
SQL> Execute SQL statements
SQL> ALTER SESSION SET SQL_TRACE=FALSE;
Or
SQL> EXECUTE dbms_session.set_sql_trace(TRUE);
SQL> Execute SQL statements
SQL> EXECUTE dbms_session.set_sql_trace(FALSE);
You can run the SQL Trace facility in any current active Oracle Session by using the dbms_system.set_sql_trace_in_session packaged procedure. This procedure accepts the three following arguments:
-
SID
-
SERIAL#
-
SQL_TRACE
You can determine the SID and SERIAL# values from the v$session table. Further filtration on the v$session columns osuser name, username, and such, can help identify the SID/SERIAL# values. For example:
SELECT s.sid,
s.serial#
FROM v$session s
WHERE s.osuser = 'afergusson'
AND s.username = 'APPS'
SID SERIAL#
--- --------
15 19201
execute
dbms_system.set_sql_trace_in_session(15,19201, TRUE);
The SQL_TRACE argument is Boolean and accepts TRUE or FALSE values.
Locating the Trace File
You specify the location of the Trace file using the user_dump_dest parameter. The Trace file name is dependent on the operating system:
-
On UNIX, the trace file name is SID_ora_PID.trc
-
On NT, the trace file name is oraPID.TRC
SID is the Oracle System Identifier, and PID is the operating system Process Identifier. The PID is determined by interrogating the v$process and v$session dynamic tables for a specific active session ID.
The example below illustrates selecting a PID for a specific active session.
SELECT p.spid,
FROM v$session s, v$process p
WHERE s.audsid = &sessionid
AND p.addr = s.paddr:
SPID
----------
89012
What is TKPROF?
TKPROF is a program that formats a raw SQL Trace file into a user-friendly file. The program reads the Trace file and creates a file that has the following section:
-
Header
-
Body
-
Summary.
The header section contains the version of TKPROF, any sort options used and a glossary of terms. The body section displays the following information for each user level SQL statement traced:
-
SQL statement text
-
Tabulated Parse
-
Execute and Fetch statistics
-
Number of library cache misses during Parse
-
Parsing user id
If specified, TKPROF also:
-
Shows the explain plans when the SQL Trace was executed and when TKPROF was run
-
Creates a SQL script that creates a table and inserts a row of statistics for each SQL statement
The power of TKPROF is the ability to sort the SQL statements. The sorting helps identify and sequence statements that are using the most resources. At the end of the report, a tabular summary for all the user level and recursive SQL statements is provided.
Formatting a Trace File using TKPROF
You execute TKPROF from the command line. Although TKPROF has many arguments, generally only two mandatory and three optional arguments are used. The execution syntax and arguments are as follows:
tkprof infile outfile sort=options explain=username/password@db print=integer
The tkprof arguments are:
| Argument | Meaning |
|---|---|
| infile | Specifies the raw SQL Trace file |
| outfile | Specifies the file that TKPROF will create the report in |
| explain | Optionally specifies the Oracle username, password and DB connector where each SQL statement is to be explained. For Oracle 8.1.6, if explain is specified, then two plans are provided. The first plan is for when the SQL Trace was generated (and is always present regardless of the explain option setting). The second plan is generated when TKPROF is executed |
| Limits the number of SQL statements to be included in the report. The argument accepts an integer value. This is particularly useful is you have a large SQL Trace file. For example, you may want to examine the worst 25 SQL statements only and would use print=25 | |
| sort | Optionally specifies a sort order in descending order. The order comprises of one or more options. If the sort argument is omitted, the SQL statements are ordered in the order they are located in the trace file. More than one option can be specified provided a space separates them. The options available are shown in the following table. |
| Sort Options | Meaning |
|---|---|
| PRSCNT | Number of times parsed |
| PRSCPU | CPU time spent parsing |
| PRSELA | Elapsed time spent parsing |
| PRSDSK | Number of physical reads from disk during parse |
| PRSQRY | Number of consistent mode block reads during parse |
| PRSCU | Number of current mode block reads during pars |
| PRSMIS | Number of library cache misses during parse |
| EXECNT | Number of executes |
| EXECPU | CPU time spent executing |
| EXEELA | Elapsed time spent executing |
| EXEDSK | Number of physical reads from disk during execute |
| EXEQRY | Number of consistent mode block reads during execute |
| EXECU | Number of current mode block reads during execute |
| EXEROW | Number of rows processed during execute |
| EXEMIS | Number of library cache misses during execute |
| FCHCNT | Number of fetches |
| FCHCPU | CPU time spent fetching |
| FCHELA | Elapsed time spent fetching |
| FCHDSK | Number of physical reads from disk during fetch |
| FCHQRY | Number of consistent mode block reads during fetch |
| FCHCU | Number of current mode block reads during fetch |
| FCHROW | Number of rows fetched |
Typical TKPROF Execution Examples:
-
Standard report
tkprof hrdb_ora_6712.trc hrdb_ora_6712.tkp
-
Report with Explain option
tkprof hrdb_ora_6712.trc hrdb_ora_6712.tkp explain=apps/apps@hrdb
-
Report with explain, sorted by execute/fetch elapsed time for the worst 25 statements
tkprof hrdb_ora_6712.trc hrdb_ora_6712.tkp explain=apps/apps@hrdb sort= exeela fchela print=25
TKPROF Sort Options
TKPROF provides a number of sort options which can be specified to sort the traced SQL statements. Some recommended sort options are listed below:
-
Sort by logical IO
tkprof infile outfile sort=exeqry execu fchqry fchcu
-
Sort by physical IO
tkprof infile outfile sort=exeqry execu fchqry fchcu
-
Sort by CPU time (only if the timed_statistics is enabled)
tkprof infile outfile sort=execpu fchcpu prscpu
-
Sort by elapsed time (only if the timed_statistics is enabled) tkprof infile outfile sort=exeela fchela prsela
-
Sort by library cache misses
tkprof infile outfile sort=prsmis
HRMS Development prefers both a Raw SQL Trace file and a TKPROF report sorting by execute elapsed (exeela) time and fetch elapsed (fchela) time providing timed_statistics is set to TRUE. If timed_statistics is FALSE, then the execute disk (exedsk), execute query (exeqry) and execute cpu (execu) sort options should be used.
Understanding a TKPROF Report
After running tkprof, the resulting file contains a report which is divided into three sections:
-
Header
-
Body
-
Summary
TKPROF Header
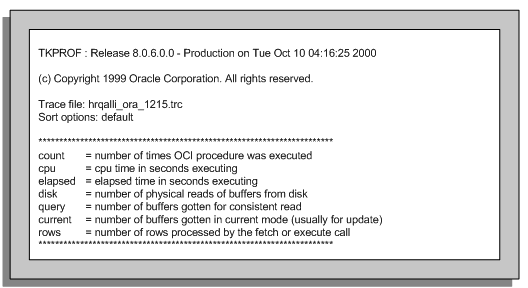
The header shows the TKPROF version, date of run, the SQL Trace infile, any sort options (default if no options specified) and a glossary for terms used in the statistic table.
TKPROF header

TKPPROF Body
The body contains all the SQL statements which have been traced. Each SQL statement is shown with it statistics and explain plan in sorted order.
TKPROF body
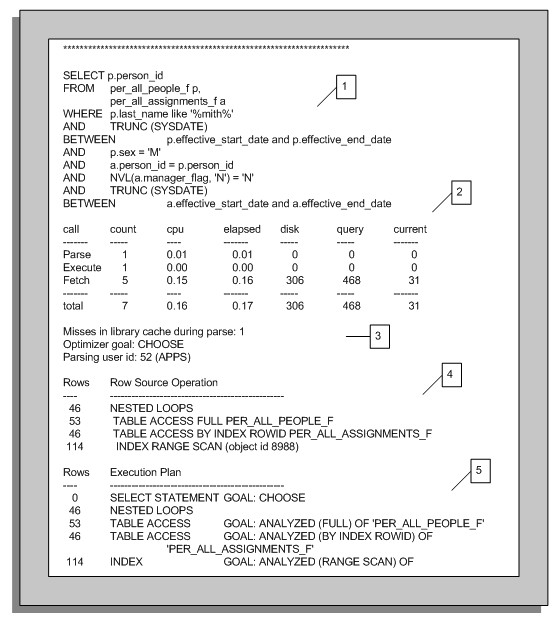
1.Illustrates the SQL Statement Being Traced
The SQL statement being processed is shown, together with any bind variables without truncation. Only the following SQL statements are truncated to 25 characters:
SET ROLE, GRANT, ALTER USER, ALTER ROLE, CREATE USER, CREATE ROLE
2 Illustrates the Parse, Execute and Fetch Tabular Statistics for the SQL Statement
The tabular statistics table below is the most important information to examine for each parse, execute and fetch call.
| Call | Purpose |
|---|---|
| parse | The parse call is responsible for syntax/semantic checking, type checking, execution plan generation and the building of a shared cursor. Depending on the SQL statement being parsed, either a hard or soft parse will be performed. If the SQL statement was not found in the shared cached then a hard parse if performed. A hard parse will perform all of the parsing steps required and is the most expensive parse operation. If the SQL statement does exist in the shared cache then a complete parse operation does not need to be performed because the shared cursor definition can be used, this is known as a soft parse |
| execute | Will execute the SQL statement or in the event of a SELECT prepare for fetching. |
| fetch | Fetches rows which are returned from a SELECT SQL statement. For a SELECT that contains an ORDER BY or a FOR UPDATE clause, rows may be accessed during execute. |
| count | The number of calls for each call type. |
| cpu | CPU time in seconds (always zero if timed_statistics is FALSE). For parse, if a statement was found in the shared pool (i.e. no library cache misses) then this will be 0. |
| elapsed | Elapsed time in seconds (always zero if timed_statistics is FALSE). |
| disk | Number of physical reads of buffers from the database files. (Physical I/O). |
| query | Number of buffers gets in a consistent (query) mode from memory. (Logical I/O). This column usually reflects the processing of a SELECT statement. |
| current | Number of buffers read in current mode from memory. This column usually reflects the processing of a DML INSERT, UPDATE or DELETE statement. |
| rows | The number of rows processed by each type. For SELECT statements, the number of rows will be in the fetch column. For INSERT, UPDATE and DELETE statements, the number of rows will in the execute column. |
The statistics can be useful in determining other statistical values and pointers to where particular problems are occurring.
For example:
Total logical IO buffer gets
total logical IO = query total + current total
This statistic provides the total number of data buffers retrieved from memory.
Logical IO per row
logical IO per row = total logical IO / total rows
This statistic will provides the total number of data buffers retrieved from memory for each row processed. The greater the number of logical IOs performed the greater the row cost. Ideally this ratio should be as low as possible.
Logical IO per execute
logical IO per execute = total logical IO / execute count
This statistic is similar to 'logical IO per row' but is based on per execute.
Parses per execute
parses per execute = parse count / execute count
This statistic determines the number of parses per execute. If this value is close to or is 1 (providing more than 1 execute has taken place) then a parse is being performed for each execute and the cursor is not being re-used. The shared pool size may not be large enough and may need increasing.
Buffer cache miss rate
buffer cache miss rate = disk total / total logical IO
This statistic provides the miss rate for data not being cached in memory. Ideally this figure should be less than 10%.
Average time per execution
avg. time per execute = elapsed total/execute count
This statistic provides the average time it takes to execute the statement. The figure is really a guideline to determine if it is acceptable by the end user.
Average rows per fetch
avg. rows per fetch = fetch rows/fetch count
This statistic will provide the average number of rows fetched per fetch call. This is particularly useful in determining if array fetching is being used.
3. Illustrates the Number of Misses in the Library Cache During Parse, the Optimizer Mode Used and the Parsing User Id
The statistic 'Misses in library cache during parse indicates if the SQL statement was hard or soft parsed. If a miss has occurred (i.e. > 0) then the SQL statement was not found in the shared cursor cache and was hard parsed. If a miss did not occur (i.e. = 0) the SQL was found in the shared cursor cache and was soft parsed. If this statistic is consistently being set (e.g. > 0) then investigation will be required to determine why the SQL is not being shared.
The statistic 'Optimizer goal' shows the goal used by the Optimizer to process the SQL statement. The goal will be one of the following values:
CHOOSE, FIRST_ROWS, ALL_ROWS or RULE
The 'Parsing user id' shows the user who issued the SQL command.
4. The Explain Plan Generated when the SQL Statement was Traced
The runtime explain plan is generated when the SQL statement was executed. This explain plan is always present regardless if the explain option is specified as a tkprof argument (although sometimes it is not shown if the user does not have access to all the underlying objects). Additionally, the plan contains object ids instead of names for referenced objects. These object ids map directly onto the all/dba/user_objects tables where the object_name can be retrieved.
5. The Explain Plan Generated when the SQL Statement was Processed by TKPROF Provided the Explain Argument was Specified
By providing TKRPOF with the explain argument, each SQL statement will be explained during the TKRPOF processing. The fundamental difference between this and the explain plan generated at SQL Trace execution is they can be different if any of the underlying objects or corresponding database statistics have changed (if using the Cost Based Optimizer). Also, all object names are displayed instead of object ids.
The 'Rows' column shows the number of rows processed by each operation.
TKPROF Summary
The summary is located at the end of the TKPROF file after all the traced SQL statements.
TKPROF summary
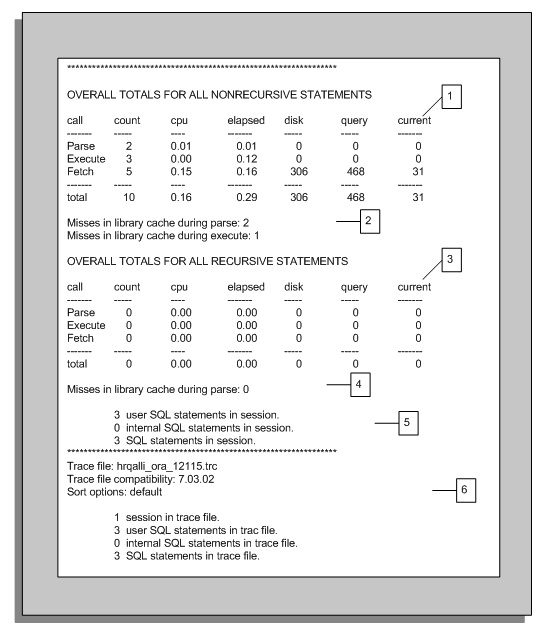
1. Illustrates Overall Totals for Non-Recursive SQL Statements
Non-recursive SQL statements are user level SQL statements, such as SQL written by developers.
The 'OVERALL TOTALS FOR ALL NON-RECURSIVE STATEMENTS' tabular table contains the sum of all user issued statements not including an Recursive SQL issued (see number 3 below for Recursive SQL description).
2. Illustrates the Library Cache Misses During Execute and Parse
As mentioned previous in the body section, the library cache misses indicates the number of Non-recursive SQL Statements not being shared, for example, user.
3. Illustrates the Overall Totals for Recursive SQL Statements
Recursive SQL are internal statements issued by Oracle in to complete a user SQL statement. Typical examples are dynamic space management, getting missing data dictionary information, and so on.
Statistics for Recursive SQL are not included in the statistics for the SQL statements which issued the calls. Therefore, the total resources/cost for a SQL statement is the SQL statement plus all corresponding Recursive SQL values.
The 'OVERALL TOTALS FOR ALL RECURSIVE STATEMENTS' tabular table contains the sum of all the Recursive SQL in the SQL Trace file. These figures are important to determine how much extra work is being performed internally by Oracle in order to satisfy the user SQL statements.
4. Illustrates the Library Cache Misses During Parse
As mentioned previous in the body section, the library cache misses indicates the number of Recursive SQL Statements not being shared.
5. Illustrates the Summary of SQL Statements Processed
Provides a quick summation of the number of 'user SQL statements in session' (Non-recursive), '0 internal SQL statements in session' (Recursive) and 'SQL statements in session' (total of Non-recursive + Recursive SQL statements).
6. Illustrates the TKRPOF Compatibility and Processing Statistics
Lists the SQL Trace file which has been processed, the trace file compatibility and sort options. Additionally the number of sessions, unique SQL statements and number of lines in the SQL Trace file are provided.
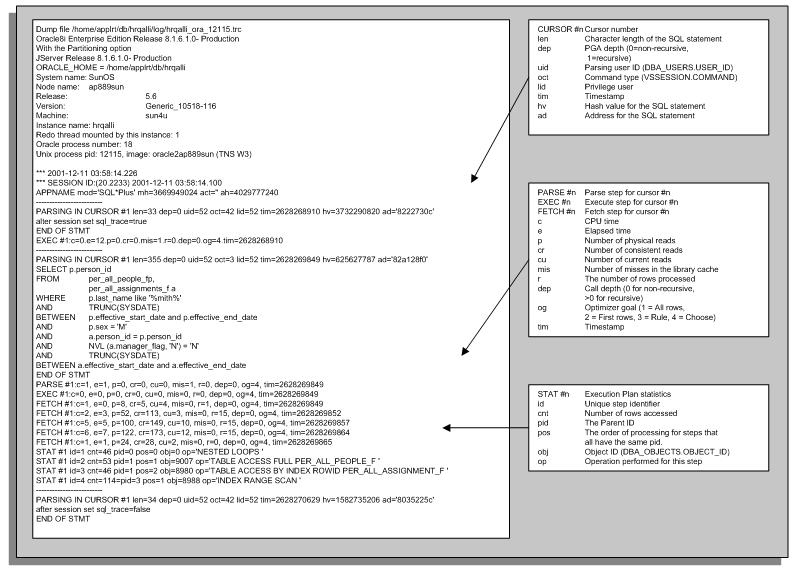
Raw SQL Trace File Example
The following example illustrates a simple, raw SQL Trace file produced for three SQL statements:
-
ALTER SESSION SET SQL_TRACE=TRUE
-
SELECT
-
ALTER SESSION SET SQL_TRACE=FALSE.
The Trace file is more difficult to read than the TKRPOF report, and is not in any sorted order.
Example Trace file
Advanced SQL Tracing Using Event 10046
The 10046 Event enables extra information on bind variables and waits to be reported in the Raw SQL Trace file. This extra information is determined by setting the event level. The Event has four level settings which are described in the table below:
| Level | Setting |
|---|---|
| 1 | Default SQL Trace |
| 4 | Include bind variable information |
| 8 | Include wait event information |
| 12 | Include bind variable and wait event information |
By default, each SQL Trace is set to level 1. To enable extra information to be reported, the 10046 Event is set to the desired reporting level using the ALTER SESSION command.
ALTER SESSION SET EVENTS '10046 trace name context forever, level 1';
ALTER SESSION SET EVENTS '10046 trace name context forever, level 4';
ALTER SESSION SET EVENTS '10046 trace name context forever, level 8';
ALTER SESSION SET EVENTS '10046 trace name context forever, level 12';
By setting the event level to either 4, 8 or 12, the extra information is reported in the Raw SQL Trace file if SQL Trace is enabled. It is important to note that TKPROF ignores any extra information reported from setting events.
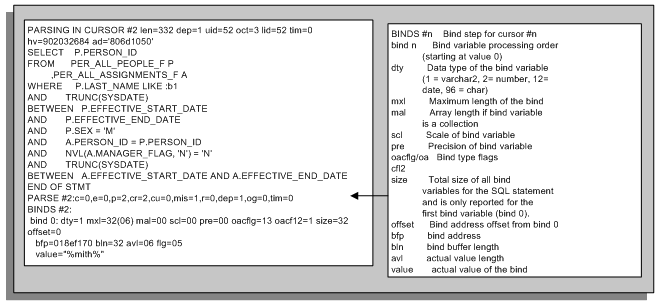
Event 10046 Bind Variable information
When the 10046 is set to level 4 or 12 bind variable information is provided if the traced SQL statement contains bind variables. This is particularly useful if you need to review the bind variable values being used.
Event 10046 Bind Variable Information
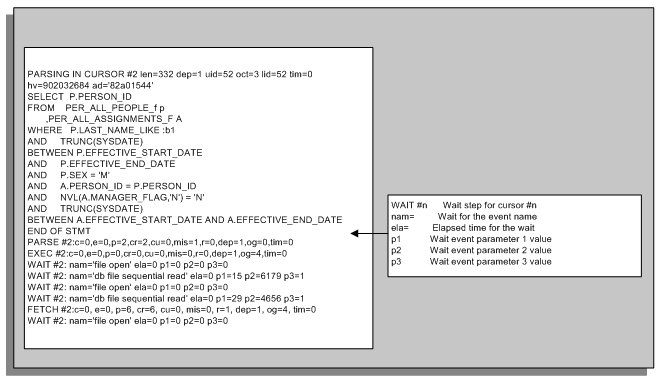
Event 10046 Wait Event information
When the 10046 is set to level 8 or 12, wait event information is provided if the traced SQL statement contains waits. The wait event names are the same events which are from V$SYSTEM_EVENT. Each event has three parameters:
-
p1
-
p2
-
p3
These are the same as the parameters in V$SESSION_WAIT. For a full event and parameter description please refer to the Oracle 8i Reference Release 2 (8.1.6) Part Number A76961-01, Appendix A - Oracle Wait Events.
Tracing for Wait Events can be very useful in identifying why the elapsed time of a SQL statement is higher than expected. For example, the session may be waiting on a latch, I/O, SQL*Net, and so on.
Event 10046 Wait Event Information
