Using the Planning Percentages Worksheet
This chapter covers the following topics:
- About the Planning Percentages Worksheet
- Opening the Planning Percentages Worksheet
- Setting up the Planning Percentages Worksheet
- Changing the Layout to Enhance Analysis
- Display and Calculations in the Planning Percentages Worksheet
- Calculating Dependent and Total Revenues
- Reusing Planning Percentages
- Modifying Data in the Planning Percentages Worksheet
- Displaying Parent and Child Values in the Worksheet
- Saving Data in the Planning Percentages Worksheet
- Printing the Planning Percentages Worksheet
- Exporting Data from the Planning Percentage Worksheet
- Planning Percentage Usability Enhancements
- Closing the Planning Percentages Worksheet
About the Planning Percentages Worksheet
The Planning Percentages worksheet enables you to view and edit data for dependent demand and planning percentages of options. Dependent demand describes the relationship between the demand for models and their optional components. The planning percentages are the attach rates, or ratios of options to model demand. If global bills of materials has been chosen for dependent demand, the planning percentage objects shown in the worksheet aren't dimensioned by organization; instead, the results are organized by the global bill of materials. By editing the results, you change the global planning percentages and affect the demand for all inventory organizations.
When you work as a planner and select a final forecast to submit to the shared database, the planning percentages currently associated with the measure are automatically collected when the data collection stage runs. When you work as a Demand Plan Manager and select a forecast to upload to the Demand Planning Server, the planning percentages associated with the forecast are automatically uploaded when the upload stage runs. Once uploaded, the planning percentages can be written back to Oracle Advanced Supply Chain Planning (ASCP).
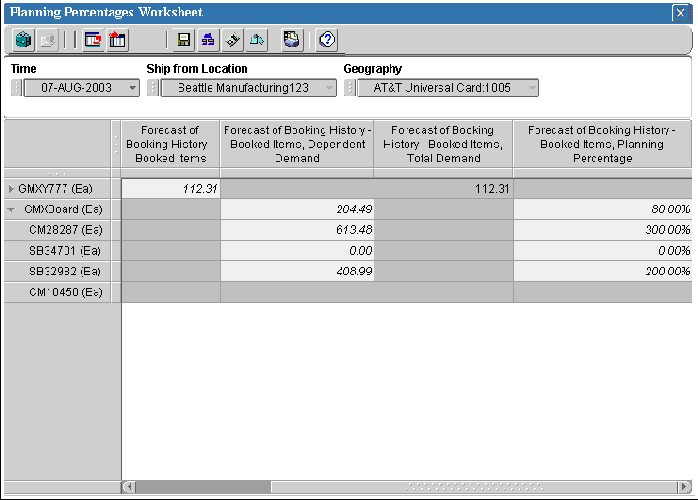
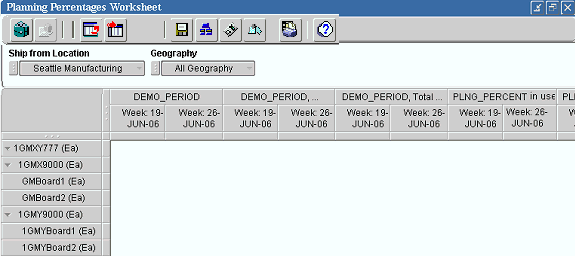
Example: Planning Percentages worksheet
Consider an example, where you want to view the following information for item GMXY77 (ea):
-
Independent demand
-
Planning percentages
-
Dependent demand
-
Total demand (independent + dependent demand)
Note that all the above-mentioned information would be is based on the model product, which, in this example, is GMXY77 (ea).
Differences between the Planning Percentages worksheet and a standard worksheet
Following are some differences between the Planning Percentages worksheet and a standard worksheet:
-
The standard worksheet is typically used with four dimensions: Time, Product, Geography, and Organization. The Planning Percentage worksheet is not dependent on Geography; the planning percentages show the relationships between item level products for the lowest level organizations and time.
-
A standard worksheet displays data based on hierarchies that have been established for the dimensions in the Demand Planning Server. The Planning Percentages worksheet displays data in terms of model > option dependencies based on model bills of material.
-
When you save a standard worksheet, you name it and save the layout and dimension value selections. When you save the Planning Percentages worksheet, you save the data. The most recently saved layout will appear when you next open the Planning Percentages worksheet from the Tools menu on the Navigation toolbar.
Opening the Planning Percentages Worksheet
There are two methods for opening the Planning Percentages worksheet:
-
You can open the worksheet from the Tools menu on the Navigation toolbar. The Planning Percentages Worksheet opens in the full vertical document workspace. If the Planning Percentage worksheet has been previously saved, the format reflects the saved layout.
-
You can open the Planning Percentages worksheet from a cell in a standard worksheet. Values for Product, Ship from Location, Geography, and Time are based on the cell from which you invoked the Planning Percentages worksheet.
To open the Planning Percentage worksheet from the Tools menu:
-
Access Oracle Demand Planning as a Demand Planner or Demand Plan Manager.
-
On the navigation toolbar, choose the Tools button,

-
Choose Planning Percentages Worksheet.
To open the Planning Percentages worksheet from a standard worksheet:
-
With a worksheet open in the workspace, click the right mouse button in any cell in the document.
Result: A menu of options appears.
-
Choose Planning Percentages Worksheet.
Toolbar for Planning Percentages worksheet
The Document toolbar appears at the top of an open Planning Percentages worksheet. The toolbar buttons enable you to perform the functions that are listed below.
-
Choose Values from List - Select dimension values and measures including planning percentages.
-
Change Layout - Change the relative positions of the dimension tiles in the worksheet layout.
-
Export to Spreadsheet - Export data and labels from the worksheet to a .CSV, .TXT, or .HTM file.
-
Save As - Save the data in the active worksheet.
-
Add Parent - Select the immediate parents (models or option classes) to which an option is associated.
-
Recalculate - Recalculate the data in the worksheet.
-
Reset Data - Reset unsaved data to a previous status.
-
Print - Print the worksheet.
-
Help - Get online help.
Setting up the Planning Percentages Worksheet
You set up the Planning Percentages worksheet so that it displays the models and options that you want to work with. Proceed as follows:
-
Populate the worksheet by selecting the product on which you want to focus. Also choose values for the other dimensions, including Measure.
-
Size the columns so that you can view the data.
-
Drill to view product dependencies (children).
-
Add parents.
Selecting data for the Planning Percentages worksheet
Following are considerations for selecting data for the Planning Percentages worksheet:
-
For Measure: Ensure that the worksheet includes the measure on which you want to focus (for example, Forecast of Booking History). Also choose the related Dependent Demand measure (for example, Forecast of Booking History, Dependent Demand), the related Total Demand measure (for example, Forecast of Booking History, Total Demand) and the associated planning percentage object for the measure (for example, Forecast of Booking History, Planning Percentage).
For a forecast, you might also want to choose measures for history and dependent history to see how the planning percentages were calculated. Again for a forecast, you might want to include another planning percentage object for comparison purposes. For example, you might compare forecasted planning percentages with the existing planning percentages.
-
For Product: Choose product at the item level.
-
For Time: If you want to be able to edit data for dependent demand and planning percentages, take care when selecting time values. If you are using the existing planning percentage or a copy of the existing planning percentage, then select Time at the lowest level. This is either the Day level or the lowest level for every calendar used by the plan. If you are using a planning percentage based on forecasting or averaging dependent history, select the time level at which the forecast or average was generated. For example, if you want to view dependencies for planning percentages generated by forecasting at the monthly level, then you would choose monthly values within the time range for the forecast.
-
For Ship-to location: You view and select Ship-to-location values at the Organization level.
Note: You cannot choose previously saved selections, custom aggregates, or formula measures. Although these are valid in other documents, they cannot be selected in the Planning Percentages worksheet.
To select data for the Planning Percentages worksheet:
-
With the worksheet open in the workspace, choose the Select Data button on the Document toolbar.

-
Result: A list of the dimensions in your database appears. The list includes Measure.
-
Choose a dimension for which you want to select values.
Result: The Select Data dialog box opens. The dimension that you chose is displayed in the Select Values for box.
Choose values for the current dimension, noting the special considerations for Planning Percentage worksheet selections that are listed at the beginning of this section.
-
To select values for another dimension, in the Select Values for box choose the dimension and repeat Step 2.
-
Repeat Steps 2 and 3 until the worksheet includes the values that you want to work with.
Sizing rows and columns in the Planning Percentages worksheet
You can adjust the size of rows or columns in the Planning Percentages worksheet.
To size a row or column in a worksheet:
-
With the document open in the workspace, position the cursor on the border of the label of the row or column whose size you want to change.
-
When the cursor changes to a double arrow, click and move the border.
Drilling in the Planning Percentages worksheet
You can drill the root product in the worksheet. This enables you to view data for options that have a dependent relationship to the root as defined in the Bills of Material.
To drill a product:
With the worksheet open in the workspace, click the arrow next to the item that you want to drill.
-
Right pointing arrow — Located next to an item that has dependencies, but the values are not currently visible. Click this arrow to drill down and expose the dependent values.
-
Down pointing arrow — Located next to an item for which you see dependencies. Click this arrow to drill up and hide the list of dependent values.
Note: A product with no arrow indicates that there are no dependent values.
Adding parent values to the Planning Percentages worksheet
You can expose parent values for the root product in the worksheet. This enables you to view data for products on which options are dependent, based on model> options relationships defined in the Bills of Material.
To add parent values:
-
With the worksheet open in the workspace, choose the cell that contains data for the product for which you want to add parents.
-
Choose the Add Parent tool.

-
Result: The Dimension Value Selector opens, displaying the parent models for the selected product. If there are no parents, then the list is empty.
-
Choose one or more values from the list.
Changing the Layout to Enhance Analysis
The planning percentages worksheet enables you to accept the default layout or change the arrangement of dimensions to alter your view of the data.
The default layout puts the Time dimension on the vertical (row) edge of the planning percentage worksheet, after the Product dimension. Measure is the across dimension, and Ship to Location and Geography are page dimensions.
Moving the Time dimension from the row position to the across position and moving Product from the down position to the page position enables you increase the granularity of your view; you can focus on the data for a particular product over a particular time.
When organizations (Ship to Location) and Geographies are at the page level and Time is on the vertical edge, only one period can be viewed at a time. This leads to two problems:
-
Planners cannot see the trend in planning percentages
-
Planners have to change planning percentages one period at a time
When you move the Time and Product dimensions as described above, the planning percentage worksheet can display multiple levels of the dimension simultaneously.
This means that you can see a particular option for a geography and organization with all the time values lined up and the values for each measure going across the page. Values for the option can be viewed and compared across the selected time values -- for a whole series of weeks or months, or quarters.
You can move dimensions by using the Layout dialog box, or by dragging and dropping the dimension tiles.
Procedure: Moving Dimensions in the Planning Percentages Worksheet
You can use the Change Layout button on the document toolbar of the planning percentage worksheet to access a dialog box with which you can change the relative positions of the dimensions. As described in the previous section, this can be used to provide a different analytical view of your data.
Alternatively, you can change the layout manually by dragging and dropping dimension tiles. Both methods are outlined below.
Moving Dimensions with the Layout Tool
This is how you move dimensions with the layout tool.
-
With the planning percentage worksheet open in the workspace, choose the Change Layout button on the Document toolbar.
The Change Layout dialog box is displayed.
-
The Layout frame displays the current positions of the dimensions on the page. Dimensions for which data displays as separate pages are shown in the Page position.
-
Dimensions for which data goes across the page are shown in the row position.
-
Dimensions for which data goes down the page are shown in the column position.
-
-
Move dimensions in one of these two ways:
-
You can click a dimension and drop it on another location or drag it to a new location.
-
If you drag a dimension near another dimension and the dimension turns gray, this indicates that the two dimensions will exchange (swap) positions.
-
If you drag a dimension and a black bar appears, this indicates that the dimension will be moved to the position.
-
-
You can also use the controls at the top of the page to manipulate dimension positions as follows:
-
In the Action box, choose Move or Swap.
-
In the Dimension box, select the dimension on which to perform the move or exchange.
-
In the Position box, on the top right, choose the target location for the move or the appropriate dimension or edge for the exchange.
-
-
-
Choose Go to update the display in the Layout box to reflect the current status in the boxes.
-
When the Layout box displays the desired settings for the dimensions, choose OK.
Moving Dimensions with Drag-and-Drop
This is how you move dimensions with drag-and-drop.
-
Click a row, column, or page selector. These selectors are located beside the row, column, and page labels and appear similar to a 'stoplight.'
-
Drop the selection on another location or drag it to a new location.
-
If you drag a dimension near another dimension and the dimension turns gray, this indicates that the two dimensions will exchange (swap) positions.
-
If you drag a dimension and a black bar appears, this indicates that the dimension will be placed on the edge.
Display and Calculations in the Planning Percentages Worksheet
The method that Oracle Demand Planning uses to calculate planning percentages depends on the selection that was made when the measure to which the planning percentage refers was created.
-
If the planning percentage object was created by averaging dependent history, then planning percentages are calculated by dividing the history of each option by the history of the model.
-
If the planning percentage object was created by forecasting dependent history, then planning percentages are calculated by dividing the forecast of each option as generated independently based on the history of the option, by the forecast of the model based on the history of the model.
-
If the planning percentage object was created by choosing the existing planning percentage object from the Planning Server or by copying and renaming the existing planning percent object, then the planning percentages reflect the numbers from the Bills of Materials. No calculations are applied.
Dependent demand for an item is calculated by multiplying its planning percentage by independent demand.
For information about generating planning percentages when creating a measure, see the following sections:
"Creating Simple Copy Measures"
"Creating Complex Copy Measures"
Calculating Dependent and Total Revenues
If the price of options is not rolled up in the model price, dependent and total revenues must be calculated in order to analyze revenues.
If we assume that the price of mandatory components is rolled up into the model's base price, the following will apply:
-
The independent revenue is calculated by using the formula independent demand * price.
-
The dependent revenue is calculated by using the formula dependent demand * price.
-
The total revenue is calculated by using the formula model's independent demand * model's base price + option's dependent demand * option's price.
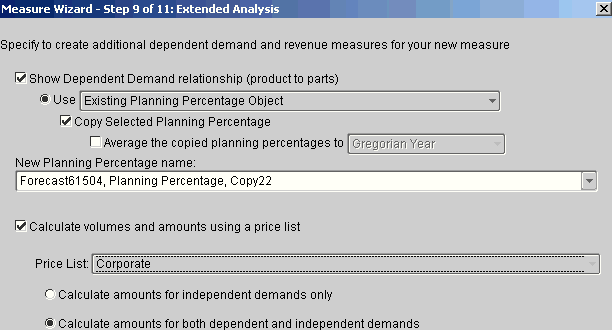
The procedure below explains how to use the Measure Wizard in Oracle Demand Planning to calculate dependent demand amount and total demand amount measures.
-
The dependent demand amount is calculated by applying the specified price list to the dependent demand quantity measure.
-
The total demand amount measure is calculated by adding the independent demand amount and dependent demand amount measures.
-
Neither the dependent demand amount measure nor total demand amount measure is editable.
Specifications Regarding Price Lists
The calculation that produces the dependent amount measures, will proceed with the understanding that these conditions are met:
-
The price of all the mandatory items is rolled up into the model price.
-
One price list will contain the prices of models, as well as components.
-
The price list does not contain prices for the option classes.
If the prices vary by territories or organizations, they will be applied for the respective territories and organizations. If the prices are available at All Geography and All Organization levels, the same prices will be applied to all the territories and organizations.
Notes on Revenue Calculations
Total revenue analysis (consolidated total) should be done only at the product family or category levels, since the total amount for the model does not include the revenue for the options.
Adjustments to total revenues are allocated down to the options. In the above example, the independent revenue of a model is adjusted, which changes its independent demand and in turn the dependent demand of its options
Procedure: Calculating Dependent and Total Amounts:
This procedures describes how to calculate dependent and total amounts,
-
From the Welcome screen, choose your planning role -- Demand Planning System Administrator, Demand Planning Manager, or Demand Planner.
-
Create a new measure or edit an existing measure. You will access the Measure Wizard.
-
Select the Extended Analysis step or tab. The screen is shown below.
-
The independent and dependent demand options are available for forecast, copy, copy region measures and input parameters.
The Calculate amounts for independent demands only button is selected by default.
If you choose Calculate amounts for both dependent and independent demands, you can calculate the dependent and total amounts.
These options are enabled only if the following options are also chosen:
-
Show Dependent Demand relationship (product to parts)
-
Calculate volumes and amounts using a price list
-
If the measure already contains independent or dependent amounts, they will be overwritten based on the new settings.
Viewing Dependent and Total Amounts
When you open a worksheet or report, you will be able to view three amount measures for a forecast:
-
Forecast Name, Amount is the independent amount measure, which is calculated by applying the price list to the independent quantity measure. You will be able to edit this measure.
-
Forecast Name, Dependent Demand, Amount will not be editable.
-
Forecast Name, Total Demand, Amount will not be editable.
Editing Independent amounts
If you make changes in the independent quantity or amount, the change will trickle down to all the other associated measures.
If the independent amount is modified at the product category level, the modified number will be allocated down to the model amounts (independent amount at item level) and will be reflected in model quantities (and in other measures).
Reusing Planning Percentages
When you copy a planning percentage, as described in the previous procedure, you are actually taking an existing attach rate or model/options ratio and using it to "create" a "new" planning percentage object.
In earlier versions of Oracle Demand Planning, it was not possible for a user to copy an existing attach rate to a planning percentage object that had the same name as the attach rate. It is now, however, possible to do this. In some business situations, as the hypothetical one described below, it could be convenient to reuse a planning percentage object by copying it without modifying its name.
Imagine, for example, a company where the demand planners use an existing planning percentage ("MDS planning percentage") for their weekly planning cycles.
Every two months, there is a second planning cycle which uses a calculated planning percentage based on sales history for the model and option. For the sake of convenience, the planners use of the name of the existing planning percentage in the Measure Wizard.
The advantage of doing this is that the new planning percentage takes effect for all of the measures with which the object "MDS planning percentages" is associated.
When you reuse a planning percentage object in this way, you simply overwrite the existing data and repopulate the object, which can be used again in another cycle.
Follow the procedure described below to reuse a planning percentage object.
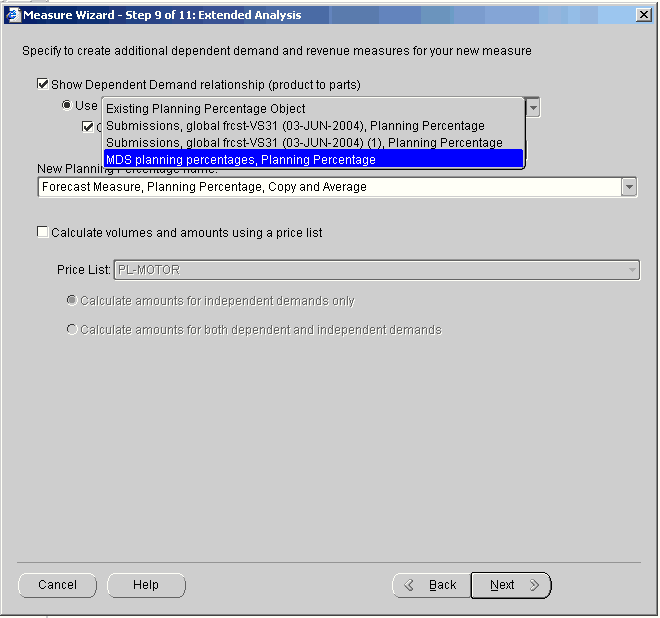
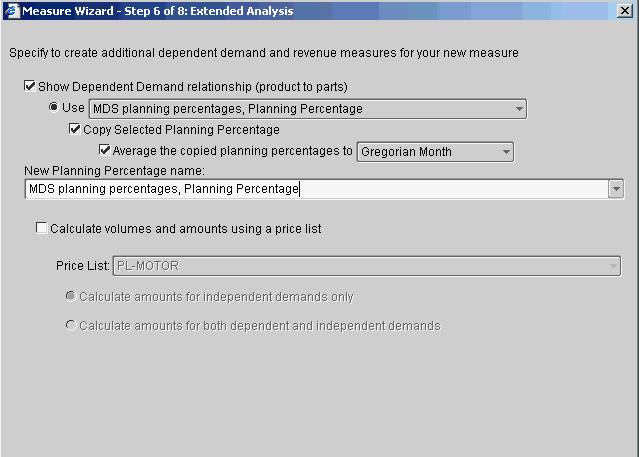
Procedure: Repopulating a Planning Percentage Object
Follow this procedure to repopulate a planning percentage object. You must first access the Measure Wizard.
-
Proceed to the Extended Analysis step or tab.
-
Check the Show Dependent Demand relationship box.
-
Choose the Use Planning Percentage Object box, which is a list box that displays the available planning percentage objects.
-
Select the planning percentage object that you want to repopulate.
-
Check the Copy Selected Planning Percentage box.
-
Check the Average the copied planning percentage to box, and then select a level that is different from the level of the existing planning percentage object.
-
Enter the name of the existing planning percentage object, displayed in the Use Planning Percentage Object box, in the New Planning Percentage Name box.
-
Complete your tasks in the Measure Wizard and choose Finish.
Modifying Data in the Planning Percentages Worksheet
In the Planning Percentages worksheet, you can modify editable values for independent demand, planning percentages, and dependent demand. Note that if you edit data for a planning percentage object that has been associated with more than one measure, your edits will impact all measures to which the planning percentage object refers. In order for values to be editable, the measure for which you are viewing planning percentages and dependent demand must include the "Editable" property as part of its definition
Planning percentages are not dimensioned by Geography dimension, that is they are not calculated based on the geographic level values. Therefore, if you modify the planning percentages at a level other than the topmost level (All Geography) in Geography dimension, the planning percentages will be modified globally. For example, changing planning percentages for a country or a region will change the planning percentages for all the countries or regions respectively.
Situations in which cells are not editable when you expect them to be might result from the following:
-
A cell represents a product/organization relationship that is not included in the Bills of Materials.
-
A cell for independent demand has been previously locked.
Modifying calculated planning percentages
Calculated planning percentages (created by forecasting or averaging dependent history) are displayed at the forecasting level and at the lowest demand plan level. However, they are only editable at the forecasting level. For example, if the calculated planning percentages are 50% for January (forecasting level is month), 50% will be displayed for all the days in January (assuming that the lowest demand plan level is day).
Effectivity dates are not respected for calculated planning percentages. The calculations are solely based on the sales history and are calculated at the forecasting levels, which will always be higher than the day level. Since planning percentages are not allocated or aggregated, it is not possible to respect the bills' effectivity when calculating these planning percentages. Thus for calculated planning percentages, data will appear even when a bill is not effective for a certain period. However, during that period the corresponding numbers will be grayed out.
Display formats indicate status
Display formats enable you to identify non-editable cells, editable cells, cells that have been modified, as well as cells that have been locked or commented.
Data in worksheet cells appears as follows:
-
Non-editable (read-only) cells — dark gray background
-
Editable cells — pale gray background
-
Modified cells — blue font
-
Standard Locked cells — light pink background
-
Persistently Locked cells — dark pink background
-
Commented cells — bold font
Impact of editing data in the Planning Percentage worksheet
When you edit data in the Planning Percentages worksheet, results are as follows:
-
Editing independent demand affects the values for total demand and dependent demand. Planning percentages remain the same.
-
Editing a planning percentage affects the value for dependent demand. Independent demand and total demand remain the same.
-
Editing dependent demand affects the planning percentage for the same child/parent.
Techniques for editing data in the Planning Percentages worksheet
You can use the following techniques to edit data in editable cells:
-
Change the value in an individual cell.
-
Paste data values into a cell or range of cells.
-
Use "Fill" functionality with the Modify Selected Data dialog box, as described in "Using Fill Functionality in Worksheets."
You can also enter comments that describe the changes that you have made and lock or protect data for independent demand.
Editing cells
You can edit values in editable, unlocked cells.
If you have edited one cell and want to edit the value of a cell on a different level, you must recalculate the data before you can proceed.
To edit a cell:
-
With the document open in the workspace, click the cell that contains the value that you want to change.
-
Type in the new value.
Note: If you enter a numeric value with more decimal digits than the numbers that are currently displayed in the worksheet, the edited value will be will be rounded to the nearest decimal place.
Copying and pasting data
You can copy data from a single cell or from contiguous cells in the Planning Percentages worksheet to the Windows clipboard.
You can paste data from the Windows clipboard into a single cell or contiguous cells. The cells must be editable and unlocked.
To copy data from the worksheet to the Windows clipboard:
-
With the document open in the workspace, select the cell or cells that you want to copy.
-
To select all cells in a column, click the highlighter under the column label.
-
To select all cells in a row, click the highlighter next to the row label.
-
-
Click the right mouse button and select Copy Data to Clipboard from the popup menu.
To paste data from the Windows clipboard into the worksheet:
-
With the document open in the workspace, select the cell or block of cells into which you want to paste data.
Note: The range of cells that you select must exactly match the range of cells that was copied to the clipboard. If the paste range does not match the copy range, then the system will not paste the data.
-
Click the right mouse button and select Paste from the popup menu.
Locking and unlocking cells
You can lock cells that contain data for independent demand. When you lock a cell, its values cannot be edited.
You can remove cell protection by unlocking the cell.
To lock a cell:
-
With the document open in the workspace, select the cell or cells that contain the data that you want to protect.
Use CTRL + click to select cells that are not contiguous.
-
Click the right mouse button and choose Lock Cell from the popup menu.
-
Select Standard Lock or Persistent Lock.
To unlock a cell:
-
With the document open in the workspace, select the cell that you want to unlock.
Use CTRL+click to select cells that are not contiguous.
-
Click the right mouse button and choose Unlock Cell from the popup menu.
Using comments to document modifications
As you modify data values, you can document your changes by entering one or more comments. Comments are free text that you associate with predefined reason codes.
Commenting a cell for dependent demand also enters the comment into the related cell for planning percentage. Similarly, commenting a cell for planning percentages also enters the comment for the related dependent demand.
To enter a comment:
-
With the document open in the workspace, select the cell or cells for which you want to enter a comment.
Use CTRL+Click to select cells that are not contiguous.
-
Click the right mouse button, and choose Comments from the popup menu.
Result: The Comments dialog box opens.
-
In the Reason box, select a reason code for the comment.
-
In the New Comment box, enter text for the comment. You can enter up to 300 characters.
-
Choose Add to add the comment.
-
To enter another comment for the same cells, repeat Steps 2 through 5. You can use the same reason code or you can select an alternate code.
-
Choose OK to return to the worksheet.
Deleting comments
You can delete a comment immediately after you enter it, but you cannot delete a comment once you have entered another comment or exited the dialog box. However, if you have not yet saved the worksheet, you can use the Reset Data function. Resetting data will remove the comment, along with other changes that have been made.
Recalculating data
Recalculation updates data values and spreads changes to appropriate cells by allocating and aggregating data. Recalculation is automatically triggered when you save the Planning Percentages worksheet. You can also recalculate data manually.
To recalculate data:
With the worksheet open in the workspace, choose the Recalculate button on the Document toolbar.
![]()
Resetting data
If you have made changes to a Planning Percentages worksheet and you decide not to retain those changes, you can reset the data in the worksheet. You can roll back the values to the most recent modification. Alternatively, you can roll back the values to the last Save action.
I
Note: You can only reset data before you save. You cannot reset data that has been saved.
To reset data:
-
With the worksheet open in the worksheet, choose the Reset Data button on the Document toolbar.

-
Choose a reset option:
-
Reset Data to Last Recalculation — Resets the data to the results just after the last recalculation.
-
Reset Data to Last Save — Resets the data to the last time that the data was saved, regardless of the number of modifications that have been made.
-
Displaying Parent and Child Values in the Worksheet
In the planning percentage worksheet, each dependent demand relationship is a product with dependencies. You can use the Add Parents icon, displayed only in the toolbar of a planning percentages worksheet, to display the parents of values. The Select Data dialog box enables you to view a product as a dependent of some roots, but not others.
Because the time and geography dimensions can now can be rotated to the row or column edge, the planning percentage worksheet may display multiple levels of a dimension simultaneously.
You add parent values to dimension values by selecting a cell in the worksheet and then clicking the Add Parents button on the toolbar. The context of the selected cell determines the product for which the parent products are retrieved.
The parent and child product values are displayed along the row edge.
Note: If the product dimension is rotated to the page dimension, it may be more difficult for you to determine the root context, because the dependent demand hierarchy is not visible. Because of this, the product description displays additional information not visible for dimension values belonging to other dimensions. The new product description will be in the form [parent product] - [product]. You will see the additional descriptive information in the Dimension Value Selector (which you use with Add Parents), in page dimension pick lists, and in tooltips, when the cursor is passed over cells in the worksheet.
Saving Data in the Planning Percentages Worksheet
You can save the Planning Percentages worksheet. When you save the worksheet, Oracle Demand Planning performs the following functions:
-
Saves the current worksheet layout. This layout will appear when you next open the Planning Percentages worksheet from the Tools menu on the navigation toolbar.
If your responsibility is Demand Planner, saving the worksheet saves the data in your personal database. If your responsibility is Demand Plan Manager, saving the worksheet saves the data in the shared database.
To save the Planning Percentages worksheet:
With the document open in the workspace, choose the Save button on the Document toolbar.
![]()
Printing the Planning Percentages Worksheet
You can print an open Planning Percentages worksheet and specify settings that determine how the printed pages will look.
To print an open Planning Percentages worksheet:
-
With the document open in the workspace, choose the Print button on the Document toolbar.

-
Result: The Print dialog box for your browser opens.
-
You can change the print defaults for the browser. For example, you can specify new values for printer and number of copies.
-
Choose OK to continue.
Result: The Print dialog box for Oracle Demand Planning opens.
-
In the Print box, specify the pages that you want to print. You can choose one of the following options:
-
Current Page of Data — Prints the current page of data as indicated by the page label.
-
All n Pages of Data — Prints all pages of data, beginning at the first logical page, regardless of the current page settings.
Note: If you choose to print all pages, the system prints all data for all dimension values that are in the page position in the document. Depending on the number of dimensions that are in status in the page position, printing all pages might result in many pages of output.
-
-
In the Order box, you can specify the order in which to print the pages. You can choose one of the following options:
-
Across then down — Prints as many rows and columns as will fit on a physical page, then moves across the columns (until all are printed) and then down the rows (until all are printed).
-
Down then across — Prints as many rows and columns as will fit on a physical page, then moves down the rows (until all are printed) and then across the columns (until all are printed).
-
-
In the Scaling box, you can specify how to scale the document. You can choose one of the following options:
-
Adjust to — Scales each logical page by a percentage that you select. The output will span the number of physical pages that are necessary to meet the specified percentage.
-
Fit to — Scales each logical page to span the width and height of the number of pages that you select.
-
-
To indicate how you want the printed pages to look, choose Page Setup. This opens the Page Setup dialog box, where you can perform the following operations:
-
Specify optional header text (up to 100 characters) for the printed page.
-
Specify an optional footer for the printed page.
-
Specify whether row, column, and page labels will be repeated on each printed page.
-
Specify whether a title, subtitle, and footnote will appear on the printed pages.
-
Specify margin settings for the printed pages.
-
-
If you want to preview the pages before printing them, choose Preview.
-
Choose OK to print the worksheet.
Exporting Data from the Planning Percentage Worksheet
You can export dimension labels and data values from a Planning Percentage worksheet to files that can be used in Microsoft Excel and other applications. You can select one of three export format options (CSV, TXT, or HTM for Excel 2000+), and export data from all pages or from a specific page.
Note: If a worksheet contains many pages of data, you might have difficulty opening the file in certain applications. To avoid this situation, modify the data selections to reduce the number of values before creating the exporting file.
To export data from a worksheet:
-
With the worksheet open in the workspace, choose the Export button on the Document toolbar.

-
Result: The Export dialog box opens.
-
In the Export box, choose the pages to include in the export file. You can select one of the following options:
-
Current Page — Exports data from the current page as indicated by the page label.
-
All n Pages — Exports all pages of data, beginning at the first logical page, regardless of the current page settings.
-
-
In the As Type box, select the format for the export file:
-
Comma delimited (*.csv) — Exports the data in Comma Separated Value format, in which labels and data values are separated by commas.
-
Tab delimited (*.txt) — Exports the data in text file format, in which labels and data values are separated by tabs.
-
Excel 2000+ (*.htm) — Exports the data in a format that can be read by a browser and opened in Excel version 2000 and version 2002, also known as XP.
-
-
In the Options box, you can choose the following options for the export file:
-
Include Number Formatting — For a CSV or TXT export, check this option to export the data with the current setting for number formats. Do not check this option if you want to export unformatted numeric data. Note that an HTM export automatically includes number formats.
-
Repeat Group Labels — Check this option to repeat outer labels for columns and rows of inner, nested dimensions. Do not check this option if you want the export file to display labels as they appear in the screen display.
Include Title, Subtitle, Footnote — Check this option to include the title, subtitle, and footnote of the document in the export file. Do not check this option if you want to exclude these elements.
-
Create One Sheet per Page — For a multi-page HTM export, check this option to export the data from each logical page to a separate Excel worksheet. Do not check this option if you want to export the data from all pages to a single Excel worksheet.
-
-
Choose OK to continue.
Result: If you chose CSV or TXT format, the File Download dialog box opens. If you chose HTM format, the Export to HTML/Excel 2000+ dialog box opens.
-
For a CSV or TXT export, proceed as follows:
-
In the File Download box, choose Save this file to disk.
Result: The Save As dialog box appears.
-
In the Save in box, select the output directory for the file.
-
In the File name box, enter a name for the file.
-
Choose OK to export the file.
-
-
For an HTM export, proceed as follows:
-
In the Save in box, select the output directory for the file.
-
In the File name box, enter a name for the file.
-
Choose OK to export the file.
-
About Excel 2000+ output files
When you export to a single worksheet in Excel 2000+ (*.htm) format, Oracle Demand Planning generates a single HTML file in the directory that you specify.
When you export to a multi-page file in Excel 2000+ format and indicate that you want to create one sheet per page, Oracle Demand Planning generates an HTML table of contents file plus a number of other files in the directory that you specified. Use the table of contents file to access the individual worksheets.
Planning Percentage Usability Enhancements
Viewing Product Description in Worksheets
The topic "Changing the Layout to Enhance Analysis" describes how you can use the layout tool in the planning percentage worksheet.
The default layout makes the Product dimension one of the dimensions on the vertical edge.
Moving Product from the vertical position to the page position is one of the modifications you can make in your worksheet to focus the analysis of data provided in the worksheet.
However, this view of the data obscures the dependent demand hierarchy, making it harder to see family (model/option) relationships. Therefore, the mini-selector for the product dimensions (the Dimension Value Selector dialog box) now displays additional information in form of a product description for each item, in the format [parent product] - [product].
Using Fill Functionality in Worksheets
If you have an option that has a very long time range, you may want to fill the values for some periods without manually modifying each cell.
You can use a Fill option that is available from the right-click popup menu.
You can insert a value into multiple cells at the same level. If you select cells from different levels to fill, a warning is displayed.
Procedure: Using Fill Functionality in the Planning Percentage Worksheet
This procedure explains how to use fill functionality in the planning percentages worksheet.
-
Open a planning percentage worksheet from an open document or by using the Planning Percentages command from Tools submenu.
-
In the worksheet, use the cursor to select the cells that you want to fill.
-
Right-click to display the popup-menu of ODP commands.
-
The Modify Selected Data dialog box is displayed.
-
Enter the number with which you want to fill the cells in the Fill with text box in the In the Value frame.
-
Choose OK to return to the modified worksheet.
Closing the Planning Percentages Worksheet
When you have finished working in a Planning Percentages worksheet, you can close it. If you have modified but not yet saved the data, you will be prompted to specify whether you want to save.
To close the Planning Percentages worksheet:
Choose the Close button, located in the upper right corner of the document.
![]()