Evaluating Production Schedules
This chapter covers the following topics:
- Reviewing Your Production Schedule
- Schedule Views Overview
- Customize Table Data in a View
- Copying Table Data from a View
- Using the Production Pegging View
- Using the Resource Gantt View
- Using the Item Graph View
- Using the Item Gantt View
- Using the Operation Gantt View
- Using the Resource Utilization View
- Using the Resource Contention View
- Using the Multi-Capacity Resource Graph View
- Using Combined Views
- Viewing Critical Path Information
- Filtering Work Orders
- Analyzing Scheduled Resources
- Analyzing Scheduled Items
- Analyzing Scheduled Operations
- Using Combined Views
- Working with Exceptions
- Working with the Resource Sequence View
- Working with Key Performance Indicators
Reviewing Your Production Schedule
-
Solve status.
-
Solver statistics.
-
Solver log data.
Solve Status
When the Production Scheduling is solving a schedule, a number of messages appear in the status bar to indicate what tasks the solver is performing at that moment. Real-time messages enable you to keep track of each phase of the solve process as it occurs. The application produces the following messages while solving a production schedule:
| Solver Message | Expanded Definition |
|---|---|
| Preparing Model | The model is being prepared for the solver. |
| Calculating Net Demand | If the Campaign Run Optimization (CRO) algorithm is enabled, it first calculates net production requirements on the CRO machine based on the supply and demand picture in the model. |
| Optimizing Run Length | If the CRO algorithm is enabled, it optimizes sequence dependent setups, run length, and simultaneously balances the trade-off between building and carrying inventory, stocking out and, violating safety stock levels. |
| Solving - Assigning Operations to Resources | Based on the model information, the solver is creating all of the operations that are required to meet the model demand and assigning them to applicable resources. |
| Solving - Sequencing | In this phase, the solver is sequencing the operations while respecting all of the constraints and trying to meet demand due dates. |
| Preparing Schedule | In this phase, the solver data is converted into a schedule. |
| Refreshing Views | The solver is updating any open schedule views to reflect the current schedule. |
| Scheduled in <x seconds/minutes> | The schedule has been solved in the specified time. |
| Schedule Infeasible | This message appears if the schedule is infeasible. Check the log window for details. |
| Solver Stopped | The user has stopped the solver. |
Solver Statistics
Production Scheduling creates a solver statistics file that captures important solver information after solving every schedule. If you have selected the Enable Logging option in the Options window, then solver statistics are written to a SolverStatistics.txt file every time that you solve a schedule. This file can be viewed directly from the Log workbook tab. For additional details, see Configuring Log Files.
You can examine the solver statistics file to obtain more information about the following solve characteristics:
-
Determine the solver performance for the solved schedule.
-
View demand details for the solved schedule including demand fill percentage, demand total, and on-time and late demand statistics.
-
View operation and resource totals for the solved schedule.
-
View iterative and heuristic information about the solve.
Solver Log Data
The solver log provides information about the number of demands that were met on time within each solve that is performed by Production Scheduling during the current session. By viewing these solver statistics in the Log workbook tab, you can determine how successful the solve was.
When the schedule is infeasible, the system displays one of the following messages in the log:
| Solver Message | Explanation |
|---|---|
| Insufficient Resource Capacity | Not enough crew, machine, or tool capacity is available for the specified resource. |
| No Producing Operation in Model | All items in the model require a source of supply whether it come from a supplier or a manufacturing operation. |
| Insufficient Item Maximum Storage Capacity | Too much inventory is being produced to fit in the allocated storage space. |
| Routing Precedence Constraint Error | The solver has encountered an issue with an operation sequence and can not resolve the conflict. For example, Operation B might be firmed to occur before Operation Abut it can not feed it sufficient inventory. |
| Could not Compute Ideal Operation Sequence for Campaign Run Optimization | The solver was unable to generate a sequence of operations based on your choice of using changeover duration or cost. |
| Unable to Initialize Campaign Run Optimization | An internal or licensing error has prevented the Campaign Run Optimization from initializing. |
| Specified Minimum Cycle Time too Short for Campaign Run Optimization | An operation's minimum run length parameters cannot fit within one cycle. Decrease the minimum run length. |
Note: If you have selected the Enable Logging option in the Options window, then these statistics are saved to a SolverStatistics.txt file each time that you solve a schedule. This file is written to the same location as your log file.
Schedule Views Overview
From a number of schedule views, schedules can be improved using manual scheduling and repairing techniques. Schedules can be compared in the Key Performance Indicators window against a number of objective measures to determine the best schedule. Schedule views is the collective term for Gantt diagrams and graphs in Production Scheduling. The workspace in which these Gantt diagrams and graphs appear is known as schedule view. You can view problems with the schedule by browsing the exceptions in the Exceptions view.
Schedule View Groups
Groups enable multiple operations and resources to be combined as a group when viewed in the Model Workspace and schedule views. Organizing resources and operations into logical groupings can help you organize your model data. You can create a default resource group for each schedule that appears when views are first opened.
All schedule views, except the Production Pegging view, provide a list at the top of the window. Use the list to select a display option to focus the content for your view. When you select a list option, the schedule view refreshes to display only those resources or items belonging to the selected option. Each schedule view can have its own default group view. The current default group in each view appears with a check mark beside its name.
Operations
Within schedule views that display operation information, you can review and modify operation information. Operation run times, duration, and assigned resources (if a resource set is used) can be changed directly from schedule views.
Note: In cMRO integrations where operation descriptions are available, the operation description appears in the Notes field of the operation Properties - General tab.
You can view information about all operations from the Demand, Operation and Resource Gantt views. Only information about single-capacity operations is available from the Resource Gantt view.
From operation schedule views, you can select an operation within the time grid to view operational information. Right-click an operation from the time grid, select Properties.
The operation Properties window contains the following tabs:
| Operation Properties Window Tabs | Description |
|---|---|
| General | This tab contains the operation code (name), the demand and work order that it is fulfilling, and any attributes assigned to the operation. From this tab you can launch the Work Order and Supply & Demand editors to view and edit the associated demand and work orders. You can also access the operation and routing using the icons at the top. |
| Times | This tab contains the selected operation's start and end times, earliest start and latest end times, duration, run, and delay. This tab also indicates whether the operation has been set to run at a specific time. |
| Resources | This tab contains all of the resources that are associated with this operation, including their quantities. Item resources are displayed as negative when they are consumed, because they are not renewable. |
| Document | This tab lists associated files and the location of the files. |
Operation details are also available from the operation Properties window that can be accessed from the Model Workspace and Work Order Editor. To access the operation Properties, right-click an operation from the Model Workspace and select Properties. You can also display operation Properties from the Work Order Editor. In the Work Order Editor, select the Operations tab, right-click an operation, and select Properties.
The operation Properties window contains the following tabs:
| Operation Properties Window Tab | Description |
|---|---|
| General | This tab contains the operation code and notes. |
| Costs | This tab displays costs associated with the operation. |
| Attributes | This tab displays the activity type associated with the operation and the attributes assigned to the operation. |
| Resources | This tab contains all of the resources that are associated with this operation, including their quantities. Item resources are displayed as negative when they are consumed, because they are not renewable. |
| Documents | This tab lists associated files and the location of the files. |
| Where Used | This tab displays the routing diagrams where the operation is used. |
A quick summary of an operation can be viewed for single operations. Details including the name, start time, and duration of the operation are included in this quick summary. A quick summary for an operation is available in the Demand, Resource, and Operation Gantt views.
Use the Work Order Editor - Operations tab to display additional operation information such as status, firm status, firm dates, planned start and end times, and yield information.
Changeovers
The transitional time between one operation running on a specific machine and another operation is called a changeover. Changeovers appear in schedule views as solid black lines between operations.
Changeover events that affect resources appear in the Production Pegging, Resource Gantt, Resource Utilization, and Resource Sequence views, according to the rules set in the Changeover Editor.
Merged Operations
To help simplify your schedule views, adjacent operation instances of identical types can be represented as one production run. Within the Resource and Operation Gantt views, you can view the schedule with each operation instance displayed separately or as a single operation. This option is toggled with the Merge Operation button. Click the Merge Operation button again to display the operations separately.
As a result, manual scheduling is simplified. Instead of reassigning each batch in a run, you only need to reassign the total production run by using the Cut and Paste buttons. Properties for merged operations can be viewed, but they cannot be modified. The properties for merged items display the aggregated properties for each discrete operation in the merged operation. Pegging can also be performed on merged operations.
Once operations have been merged, you can view information about these consolidated operations from the Operation and Resource Gantt views. The Resource Gantt views only provide merged information about single operations, whereas the Operation Gantt displays information about all the operations.
You can also merge operations using the Resource Sequence View. Refer to Merging Operations for more information.
Customize Table Data in a View
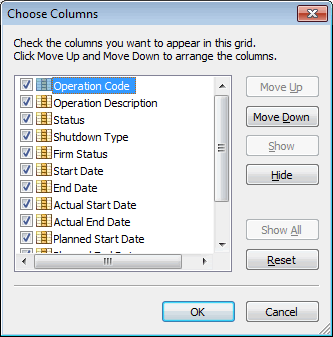
Many views display information in a tabular manner. This data can be customized as needed. Use the Choose Columns dialog to customize and arrange the data displayed in the table grid.
To customize table data in a view
-
Right-click a column header within the view.
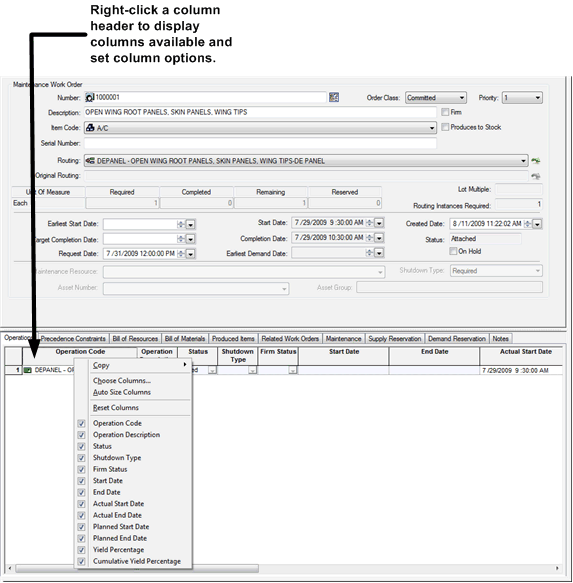
The menu displays all columns that can be displayed in the table. Check marks appear next to columns displayed within the table. You can update individual columns by checking the column name displayed at the bottom of the menu. To hide a column, uncheck the column name in the menu.
-
To define all the displayed columns and column order, select Choose Columns.
-
Perform the following as needed:
-
Select the columns you want to appear. Uncheck the columns you want to hide.
-
To display all available columns, click Show All.
-
To reset the columns displayed to the default setting, select Reset.
-
To modify the column order, select column and use the Move Up or Move Down arrow to move column to new location.
-
-
Click OK.
To resize the column widths in the table, right-click a column header within the view and select Auto Size Columns.
To reset the column in the table to the default settings, right-click a column header within the view and select Reset Columns.
Copying Table Data from a View
You can copy table data displayed within views to other applications, such as Microsoft Excel.
To copy all table data from a view:
-
Right-click a column header within a view.
-
Select Copy, and then select Entire Table.
-
Paste the copied data into another application as needed.
To copy a portion of table data from a view:
-
Highlight the table columns to be copied within the view.
-
Right-click a column header.
-
Select Copy, and then choose Selection.
-
Paste the copied data into another application as needed.
Using the Production Pegging View
In the Production Pegging view, you can display several important elements of your schedule in a simple, easy to use format. Among the many aspects that you can access are:
-
Multistage pegging of work orders
-
Resource requirements
-
Consumed items
-
Net new production recommendations
-
Purchase order recommendations
Production Pegging lets you view production from a demand point of view (demand centric), or a work order point of view (work order centric), which brings up a Work Order Gantt chart. To alternate between the demand centric and work order centric views, click the View Work Order Pegging or the View Demand Pegging toggle button on the menu bar. This toggle button has descriptive text that changes depending on the view that is displayed.
This section discusses:
-
The order tree.
-
Expand and collapse Production Pegging tree.
-
Production Pegging sorting.
-
Makespan bars.
-
The Production Pegging - Demand Centric view.
-
The Production Pegging - Work Order Centric view.
-
Work order links.
-
Operations.
-
Resources.
-
Supply events.
-
Partially filled demand.
-
Purchase recommendations.
Using the Order Tree
When open to the demand centric view, the order tree displays all of the scheduled demands as listed in the Supply & Demand Editor. You can expand the tree to display the line items and operations that are associated with each work demand order.
When open to the work order centric view, the tree displays all the scheduled work orders as listed in the Work Order Editor. You can expand the tree to display the details of operations and routings that are used by each work order, and also see pegged upstream work orders. In addition, you can look at the production recommendations and purchase recommendations.
The makespan for each folder and order appears in the time grid, similar to other schedule views. The makespan is represented by a bar with a diamond at each end to indicate the total amount of time that is required to fill an order. This bar appears in a contrasting color to provide information about the percentage of the orders filled either in demand orders or folders.
Expanding and Collapsing the Production Pegging View Tree
To get a quicker view of your work orders and demands, you can expand and collapse the work order and demand tree in the Production Pegging view. You can expand or collapse the entire tree by selecting the top-level Work Orders or All Demands folder, or expand and collapse by folder or visits by selecting the folder or visit within the tree.
To expand the Production Pegging view Work Orders tree:
Right-click an object from the Work Order Tree, select Expand and select one of the following options:
-
Expand Folders - Select this option to expand work order folders.
-
Expand Work Orders - Select this option to expand the work order folder and work orders.
-
Expand All - Select this option to expand the contents of all work orders folders, visits, work orders, and operations.
To expand the Production Pegging view Demand Order tree:
Right-click an object the Demand Order Tree, select Expand and select one of the following options:
-
Expand Folders - Select this option to expand demand folders.
-
Expand Demand Orders - Select this option to display the demand orders.
-
Expand Demand Line Items - Select this option to display the demand line items.
-
Expand All - Select this option to display the contents of all demand folders, demand orders and demand line items.
To collapse the Production Pegging view tree, right-click an object from the Work Order tree or Demand Order Tree, select Expand, and then select Collapse All.
Production Pegging Sorting
Use the Pegging Tree Sort Order button to sort Production Pegging data by Start Date, End Date, Visit Risk Index, or alphabetically. This feature allows you to analyze Production Pegging from different perspectives to find the best schedule solution.
To sort Production Pegging data:
-
From the Production Pegging view, select the Pegging Tree Sort Order button.
-
From the Pegging Tree Sort Order dialog, select one of the following Sort by options:
-
Start Date
-
End Date
-
Visit Risk Index
The Average Visit Risk Index is the overall Risk indicator for all the Visits and can be viewed from the Key Performance Indicators view. The higher the number, the Riskier the Visit will be. The individual risk index can be displayed from the Visit bubble help in the Production Pegging View. See Key Performance Indicators - Maintenance Tab for details.
-
Alphabetically
-
-
Select the sort order, Ascending or Descending.
-
Click OK.
The Production Pegging view refreshes and sorts the order tree based on your selections.
Makespan Bars
In the Production Pegging view the makespan bars are:
-
Folder based.
-
Demand based.
-
Line item based.
-
Routings based.
The makespan bar has a different meaning based on its color.
The makespan and the order of each Work Order Centric or Demand Centric folder in Production Pegging appear in the time grid, similar to other schedule views. The makespan is represented by a bar with a diamond at each end to indicate the scheduled beginning and end of manufacturing for individual demand orders and their associated demand folders. The makespan bar is colored to provide information about the percentage of the orders filled in either orders or folders.
| Type | Significance |
|---|---|
| Solid black bar | 100 percent of orders filled, based on unit fill. |
| Solid yellow bar | Between 66 and 100 percent of orders filled, based on unit fill. |
| Solid orange bar | Between 33 and 66 percent of orders filled, based on unit fill. |
| Solid red bar | Less than 33 percent of orders filled, based on unit fill. |
Bubble help provides information about each work order and folder when the cursor pauses on its makespan bar. Folder makespan bars represent aggregate information about contained work orders, and work orders summarize line item information. The following data is displayed in bubble help for demand and work orders in Production Pegging:
| Field | Description |
|---|---|
| Demand (demand folders only) | Name of the demand folder. |
| Demand Number (demand orders only) | Name of the demand order. |
| Start time | Start time for the first demand order in the demand order or folder. |
| End time | End time for the latest ending demand order in the demand order or folder. |
| Duration | Length of time between the start time for the earliest demand order or line item and the latest ending demand order or line item. |
| Average Demand Duration (demand folders only) | Average makespan for demands within the folder. |
| Average Line Duration (demand orders only) | Average makespan for line items within the demand order. |
| Fill Percentage | Demand (only available for folders). Percentage of the orders that are filled in the selected folder. Line. Percentage of the item lines that are filled within the order or in the folder. Unit. Percentage of the units that are filled within the order or in the folder. |
| Instance Count (routings only) | The number of instances of this routing in this work order. |
The following data is displayed in bubble help for work orders in Production Pegging:
| Work Order Centric View Field | Description |
|---|---|
| Work Order | Type of work order. For example, Production, Maintenance, Finished Goods, or Distributors. |
| Start Time | Start date and time of the first operation in the routing or folder. |
| End Time | The end date for the operation. |
| Average Duration | Average makespan for orders within the folder. |
| Unit Fill Percentage | Percentage of the units that are filled within the order or in the folder. |
| Requested Date | The date on which the order is requested. |
| Available Date | The date on which the order is available. |
| Duration | The duration of the work order. |
| Pegged Demands (for work order only) | The demands that are pegged to this work order. |
The makespan of each line item and routing is displayed on a time grid. Similar to the makespan for demand orders and folders, the makespan is represented by a bar with diamonds at each end, symbolizing the start and finish of the line item or routing. If the demand line item is running late or is available early, the bar is partially displayed in color. Each line item can be expanded to display the routings and operations that are involved, as well as the resource details and supply events.
Purchase order recommendations are represented by solid green bars with a trailing diamond. The bars for purchase order recommendations represent the lead time required to procure the purchased item. The diamond represents the date when the items in the purchase order become available to use in a routing.
An additional diamond is included on the bar to indicate either the requested date for line orders scheduled to be available late, or the available date for line items scheduled to be available earlier than requested.
In addition to the third diamond, the makespan bar is displayed in color between the second and third diamonds, indicating whether the line item is available earlier or later than its requested date, and by how much.
The following table summarizes the different types of line item makespan bars that are displayed in the Production Pegging:
| Type | Significance |
|---|---|
| Solid black bar | Line item scheduled to be manufactured on time. |
| Black and red bar | Line item scheduled to be available after the requested date. |
| Black and green bar | Line item scheduled to be available before the requested date. |
| Solid red bar | Line item to begin manufacturing after the requested date. |
| Solid green bar | Line item scheduled to be early. |
| Green diamond | Line item is procured from a supplier and ready to be used in a routing. |
Bubble help displays the following information about each demand order when you place your cursor over a specific demand line item makespan bar:
-
Demand Number - Name of the demand order.
-
Latest Requested Date - Date when the order has been requested.
-
Latest Available Date - Date when the order will be available.
-
Start Time - Start time for the line item.
-
Duration - Length of time between the start time and the end time.
-
Average Line Duration - The average duration of one line item.
Routings are displayed on the time grid by makespan bars. The color of these makespan bars is based on whether the routing is on time or late.
| Type | Significance |
|---|---|
| Solid black bar | Routing is on time. |
| Solid red bar | Routing contains critical bottleneck operations. |
Although subroutings are not displayed with a makespan bar, their operations are displayed on the Production Pegging view.
Bubble help displays the following information:
| Type | Significance |
|---|---|
| Routing | Routing name. |
| Start time | Start time for the routing. |
| End time | End time for the routing. |
| Duration | Length of time between the start time and the end time. |
Production Pegging - Demand Centric View
The Production Pegging - Demand Centric view enables you to visually display the start times, end times, and duration for each demand, along with its associated line items and routings. From this view, you can see how complete the orders in a folder are, how complete a specific order is, and whether scheduled line items are early, on time, or late. The system distinguishes critical routings and operations. The system does not display demand orders on hold.
Note: For the Production Pegging demand centric view to properly function, you must specify the primary operation in routings and primary output items in operations. This pegging information is essential to display the sequence of operations and routings that are involved in the production of any order line item.
The Production Pegging - Demand Filter toolbar provides a number of buttons that are available only in Production Pegging. From this toolbar, you can filter demand orders according to their criticality to assist you in analyzing the schedule's handling of demands. You can filter the demand orders to list only orders of a specific type, punctuality, and magnitude of punctuality. The Production Pegging retains the last filtering settings used for future analysis.
To display the Demand Filter toolbar, select View, Toolbars, then choose Demand Filter.
The following criteria are used to filter demand orders from the Demand Filter toolbar:
| Name | Description |
|---|---|
| Order Class Filter | Enables the demand orders to be filtered by the type of demand. Options include all, orders, forecasts, and safety. The following options are available:
|
| Order Punctuality Filter | Enables the demand orders to be filtered by punctuality. The following options are available:
|
| Order Magnitude Filter | When Late, Early, or On-Time is selected from the Order Punctuality Filter, you can use this filter to specify the magnitude of punctuality when filtering. By following options are available:
When all orders (*) are selected from the Order Punctuality Filter, the Order Magnitude Filter defaults to all (*) as well. |
Note: The number of late orders is shown in the status bar at the bottom of the screen when you use the filtering in the view.
The Production Pegging - Work Order Centric View
The Production Pegging - Work Order centric view displays the start times, end times and duration for each work order, along with its associated operations and any pegged work orders. From this view, you can see how complete the orders in a folder are, how complete a specific order is, and whether it is early, on time, or late. The system distinguishes critical routings and operations. The system does not display work orders that are complete or cancelled.
The nested structure of the Work Order Centric view also displays multilevel pegging between work orders, net new production recommendations, and purchase order recommendations.
Production recommendations display Production Scheduling suggested production requirements when your work order quantities are insufficient to fulfill demand or upstream/downstream production requirements.
The Production Pegging - Work Order Centric view has the same folder structure as the Work Order Editor and allows you to drill down into the Work Order Editor from the pegging view.
To open the Work Order Editor from the Production Pegging - Work Order Centric view:
-
Select a work order in the work order tree.
-
Click the Open Work Order Editor icon in the toolbar, or right-click and select Open Work Order Editor.
The Work Order Editor opens and highlights the selected work order number in the Work Order tree.
The Production Pegging - Work Order centric toolbar provides a number of buttons that are available only in Production Pegging. From this toolbar, you can filter work orders according to their criticality to assist you in analyzing the schedule's handling of orders. You can filter work orders to list only those of a specific type, punctuality, and magnitude of punctuality. Production Pegging retains the last filtering settings and uses them for future analysis.
Orders can be filtered to display only those that meet the specific type of criteria that you specify. This information can help you locate any issues and resolve them by modifying the resources or materials involved.
The following criteria are used to filter work orders:
| Filter | Name | Description |
|---|---|---|
| Primary | Work order filter | Enables the work orders to be filtered by the type of work order. Options are: Production, Maintenance, or Engineering. |
| Secondary | Order Punctuality filter | Enables the orders to be filtered by punctuality. Options include all, early, on time, and late. |
| Tertiary | Order Magnitude Filter | Enables the user to specify the magnitude of punctuality when filtering. By default, these options include all, >0.5 days, >1 day, >2 days, >3 days and >5 days. Select Customize to set your own time filters. |
Note: The number of late orders is shown in the status bar at the bottom of the screen when you use the filtering in the view.
Show Work Order Links
Use the Show Work Order Links button on the toolbar to display task dependencies between related work orders in the Production Pegging view. The links between tasks are based on the Precedence Relationship assigned in the Related Work Order tab in the Work Order Editor.
To display work order links in the Production Pegging view:
-
Click the Show Work Order Links button on the toolbar. By default related work orders are identified using red lines to connect the task makespan bars.
You can adjust the following attributes from the related work order links:
-
Link weight - Adjust this attribute to adjust the line thickness connecting the work orders.
-
Link Transparency - Adjust this attribute to increase or decrease the link line transparency in the Production Pegging view.
-
Show Link Arrows - Select this option to arrows on work order links.
-
Work Order Link Color - Select this option change the link line color.
-
-
To adjust link weight, right-click the Production Pegging background, select Link Weight and choose Small, Medium, or Large for the thickness.
-
To adjust link transparency, right-click the Production Pegging background, select Link Transparency and choose None, Low, Medium, or High for the transparency.
-
To display arrows for links, right-click the Production Pegging background, select Show Link Arrows.
-
To adjust the color assigned to work order links, right-click the Production Pegging background, select Work Order Link Color. From the Colors window, use the Item color list to select the link line color. Select Default Color from the Item Color list to set the link line color to return the link line color to red. Click Close to exit the Colors window.
Operations
For each demand line item and routing, the related operations are displayed. The color of each operation is determined by whether it is a critical bottleneck operation. The start time of critical operations is the same as their earliest start time. No flexibility exists for the operation to start any earlier than its current start time. The start time for noncritical operations is later than their earliest start time.
| Color | Significance |
|---|---|
| Blue box | Noncritical operation. |
| Purple box | EAM Work Order Operations are highlighted in purple. |
| Red box | Critical operation. |
From the operation schedule views, you can identify the following occurrences:
-
Closed operation - Identified when an operation has completed as indicated by the Actual Start Date and Actual Completion Date. Closed operations are identified by purple double-sided arrows. From the operation schedule view you can view the genealogy of the Visit and the actual time spent performing maintenance operations.
-
Active operations - Identified when an operation has started, but not completed as indicated by the Actual Start Date. Active operations show remaining time as a solid green bar in the schedule view. The unshaded region represents the duration already performed. From the operation schedule view, you can easily identify when the operation started and how long it has been running.
-
Zero duration operations - Identified when the actual time exceeds the planned time. For example, the planned time for an operation is 1 hour, but after 1.5 hours it is still not completed. Zero duration operations are highlighted with a blue diamond in the schedule view. From the operation schedule views, you can identify work orders that are still in the process of being completed.
Actual Start Date and Actual End Date dictate the status of the operation. If Actual Start Date and Actual End Date are present, the operation is Closed. If Actual Start Date is present and there is no Actual End Date, the operation is Active. Actual Start Date and Actual End Date are assumed to be before the Scheduling Horizon.
Note: Actual Start and End Dates are only supported in the standard integration with cMRO. These dates are not populated by collections for OPM, OSFM, and Discrete.
Bubble help displays the following information:
-
Operation name - Name of the operation.
-
Start time - Start time for the operation.
-
End time - End time for the operation.
-
Duration - Length of time between the start time and the end time.
-
Slack time - The amount of time the operation can move before being on the critical path.
Resources
The resources for each operation can be viewed in the Production Pegging. These details are similar to those displayed in the Resource Gantt view. The Time grid displays each instance that the resource is used for an operation.
| Element | Appearance |
|---|---|
| Single capacity resource | Blue with operation name. |
| Maintenance resource | A resource that is in maintenance is indicated by a solid purple line. |
| Multicapacity resource | Multiple colors, depending on the percentage of capacity being used. Ranges from dark green for low usage to red for full capacity use. |
| Changeover | Thin black bar. |
Supply Events
At times, you might need to see the demands that are dependent on specific supply events. From Production Pegging, you can peg up from a supply event to all of the associated demands.
Supply events are displayed as diamonds in the Time grid. The color green indicates any supply event.
Bubble help is also available for supply events. The following fields are included:
-
Supply Number - Supply event order and line number.
-
Item - Inventory item number on the supply order.
-
Quantity - Quantity of item that is requested.
-
Requested Date - Date when the item is expected to be fulfilled.
Partially Filled Demand
If an order is filled from production and either starting inventory or a supply event, the starting inventory is displayed in the Production Pegging view by a green diamond. The green diamond at the start of the horizon indicates that some of the order is taken from inventory. The production below the green diamond row indicates that the remaining quantity is from manufacturing activities. Bubble help provides additional details for each event such as pegged quantity, date, and so on.
Purchase Recommendations
Purchase recommendation are recommended purchase activities for produced items. They appear as a green diamond with a tail that represents the lead time from the supplier. Placing your mouse pointer over the purchase recommendation provides this information:
| Recommendation Type | Description |
|---|---|
| Supplier | Displays the selected supplier. |
| Item | Displays the purchased item. |
| Pegged Quantity | Displays the quantity that is required for the order. |
| PO Recommendation Quantity | Displays the amount ordered that may also supply other orders. |
| Required Date | Displays when the purchase order is needed for production. |
| Lead Time | Displays the lead time from the supplier. |
| Estimated Ship Date | Displays the date that the purchase order is estimated to ship from the supplier. |
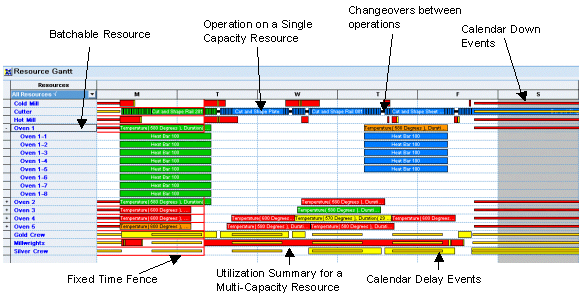
Using the Resource Gantt View
The Resource Gantt is a resource-centric view of the schedule. It enables the planner to see exactly how machines, crews, and tools are scheduled across the horizon. Operations are displayed with blue rectangles to indicate exactly where they start and end. You can zoom into any point in the horizon by selecting a range in the upper portion of the horizon bar and then select the Zoom In button on the toolbar.
For multicapacity resources, color is used to represent the percentage of capacity currently being used. The Set Colors button defines these colors. For example, if you have not changed the default color setting, dark green represents low (0 to 10 percent) capacity used, while red represents high capacity (90 to 100 percent).
The example below illustrates the Resource Gantt chart elements that are described in the following table:
This table describes the chart elements:
| Element | Appearance |
|---|---|
| Batchable Resource | A summary level row which displays information on the planned batch and a little plus arrow beside it that the user can expand or collapse. This provides visibility into the spot usage of the batch. For example, how many operations, which operations, and so on. |
| Changeover | Thin black bar. |
| Delay | Thin yellow bar. |
| Down time | Thin red bar. |
| EAM Work Order Instance | A resource that is in maintenance is indicated by a solid purple line. |
| Fixed Production Timefence | Thin red line from the start of the horizon on the resource which extends to the end of the fixed production timefence. |
| Multi-capacity resource | Multiple colors, depending on the percentage of capacity being used. Ranges from dark green for low usage to red for full capacity use. |
| Single capacity resource | Blue with operation name. |
| Campaign Run Optimization Cycle Boundaries | Thin brown bar. This represents manufacturing cycle boundaries when using Campaign Run Optimization. This provides for improved visibility to changeover patterns in and across manufacturing cycle boundaries. |
You can view all resources in the model at once, or display resources of a particular type. Resource usage is displayed for the entire schedule horizon, and can be zoomed to display a particular time period. You can view any resource group in the Resource Gantt, Resource Utilization, and Resource Contention views. The attributes of the resource group must be appropriately set for the group to be accessible in the Resource Gantt. If the group does not appear in the list, verify that the properties of the group are set to display in the Resource Gantt. If you add a group after the initial solve, you need to close and reopen the schedule, and then open the relevant view.
The default Resource Gantt sort order is alphanumeric by resource type. To more easily locate potential resource conflicts, you can sort the Resource Gantt view based on a resource's utilization as a percentage of its total capacity. When you sort by utilization, resources with the highest utilization appear at the top of the Resource Gantt. You can also change the view back to the default sort order.
Note: If a resource is campaign run optimized, its name appears in green.
You can use a variety of manual scheduling options in the Resource Gantt to fine-tune your schedule.
If you right-click on a resource, you have several options:
-
You can drill down to the Resource Properties.
-
You can relax constraints, which allows capacity and calendar violations during the solve process.
-
You can reactivate the calendar and capacity constraints on the resources by performing a right-click and selecting Active Constraints.
-
You can select Enforce Horizon Start, which applies to both the cold solve and the repair solve.
This flag automatically reconciles any shop floor backlog, when scheduling, by ensuring all operations start at the beginning of the horizon, even if they have firm dates that are prior to the start of the horizon. The Enforce Horizon Start option enables you to move operations running in the past, as a result of shop floor backlog, to the start of the horizon. Selecting the Enforce Horizon Start option and performing either a repair solve or a cold solve pushes forward all operations on that resource to the start of the horizon, maintains operation sequence, and respects upstream and downstream precedence constraints.
See "Defining Resource Availability," Creating Production Scheduling Models, Production Scheduling.
See "Using the Enforce Horizon Start Option," Manual Scheduling, Production Scheduling.
Creating a Resource Calendar from the Resource Gantt
You can now remove an event from a resource calendar. When this occurs, a new calendar is created to support this update. The new calendar is named as follows: <original calendar name> - <resource modified in Resource Gantt>.
This feature allows these changes to be collected with the global list of calendars and retained in an XML format for a Production Scheduling Model. It allows resource-specific calendars to be available in Production Scheduling sessions.
To create a resource calendar, right-click an event from the Resource Gantt view and select Remove Event. When prompted to confirm the action, click Yes. This new calendar can be viewed from the Calendar Editor. The Resource calendar option is selected in the General tab of the calendar Properties window to indicate this is a resource-specific calendar.
Batchable Resources
When evaluating a batchable resource in the Resource Gantt, color indicates utilization at the batch level and bubble help indicates the attributes of the batch at the resource level. You can double-click a resource row to expand or collapse visualization of individual spot usage. The toolbar provides an option to highlight certain batches based on the resource attribute type and attribute value. The selected batches are highlighted in orange.
See "Batchable Resources," Creating Production Scheduling Models, Production Scheduling.
Using the Item Graph View
The Item Graph presents schedule information on item levels in your supply chain using a line graph. This view is a line graph that displays current levels for each item in your model. On the Item Graph, you can select any item and then view levels for that item by moving your cursor to any point on the line.
Using the item graph, you can view inventory levels for a specific item at a specific time and access detailed property information for the item. You can customize the color scheme used in the Item Graph by selecting the color pallet icon in the toolbar.
If you select Relaxing Minimum, Relaxing Maximum, or both in Item Properties, you are giving the Production Scheduling solver permission to temporarily violate item minimum or item maximum levels, respectively, in order to produce a feasible solution.
The color in which an item is displayed depends on whether you have relaxed the minimum constraints, maximum constraints, or both constraints in Item Properties. The colors are outlined in the following table:
| Option | Maximum Constraints | Minimum Constraints |
|---|---|---|
| Relaxed | Default setting. Items are displayed in dark blue. If minimum constraints for an item are also set to relaxed, items are displayed in orange. |
Items are displayed in the color you chose for item minimum levels. If maximum constraints for an item are also set to relaxed, items are displayed in orange. |
| Unrelaxed | Items are displayed in the same color as the color you chose for item maximum levels. | Items are displayed in dark blue. |
Using the Item Gantt View
The Item Gantt is a bar chart that displays colored bars representing item levels. The Item Gantt displays a horizontal bar chart that represents items and storage spaces, and how they relate to the defined maximum and minimum levels. It can be filtered for specific resource groups. As with other schedule views, you can view current information at different levels of detail by using the zoom tools. Color-coding enables you to see the current status and problem areas immediately.
From the Item Gantt, you can view the inventory level of each item in relation to its minimum and maximum levels, and also access an item's property pages.
You can view any resource group in the Item Gantt. An item can be in more than one resource group. You can create as many resource groups as necessary to simplify your schedule analysis. To be accessible for the Item Gantt schedule view, the resource group's attributes must be appropriately set.
To view items that could inhibit the smooth implementation of your schedule, you can view the Item Gantt sorted by degree of violation in descending order. Sorting by degree of violation puts the most problematic items at the top of the view for further review and fine-tuning. Items are sorted in the following order:
-
Items with at least one red (inventory that is below minimum levels) segment.
-
Items with at least one violet segment, that is, inventory that is greater than the maximum level, and no red segments.
-
Items with only orange (inventory that is within 10 percent of the maximum or minimum levels) and green segments.
-
Items with only green segments.
Note: To get a better view of an item's inventory levels, create a combined Item Gantt and Item Graph view.
The Item Gantt uses colors to represent item levels in relation to their minimum and maximum levels. You can click the Set Colors button to customize the colors that are used in the Item Gantt and to set the thresholds for each item. The following table is a summary of the colors that are used in the Item Gantt:
| Color | Definition |
|---|---|
| Green | The item level is less than 10 percent of the difference between the minimum and maximum levels. |
| Yellow | The item level is greater than 10 percent of the difference between the minimum and maximum levels. |
| Red | The item level is below the minimum level. |
| Violet | The item level is greater than the maximum level. |
Using the Operation Gantt View
The Operation Gantt view displays all scheduled operations. It is typically used in conjunction with the Resource Gantt in the form of a combined view as the contents of the Operation Gantt become context sensitive to what is selected in the Resource Gantt. For example, when selecting a resource in the Resource Gantt, only operations running on the selected resource are displayed in the Operation Gantt: top to bottom, left to right, by start date. Each operation instance in the Operation Gantt indicates when the operation is run, and its duration, including any setup and delay times. You can expand the list of operations to display every operation instance, or you can create operation groups and filter operations by these groups.
Use the manual scheduling tools in the Operation Gantt to make detailed adjustments to your schedule. The Remove Idle Time command enables you to remove idle time between two or more selected operations or all idle time that precedes a selected operation. You can also manually resequence operations using the cut and paste commands or by accessing the Resource Sequence view.
Note: The cut, paste, and Remove Idle Time commands are enabled only for multiple instances of the same operation.
To access other views or detail information from the Operation Gantt view:
Right-click an operation from the time grid to perform the following:
-
Select Open Operation Diagram to display the operation diagram.
-
Select Open Routing Diagram to display the routing diagram.
-
Open Work order to display the work order in the Work Order Editor.
-
Select Properties to display the operation Properties window and details.
Place your mouse over a pegged operation in the time grid to view bubble help details.
Using the Resource Utilization View
The Resource Utilization view provides you with precise information about all of the defined resources that are used in the schedule horizon. Information such as idle time, delay time, calendar down time, maintenance time, changeover time, and run time appears in this view. Resource utilization appears as total number of hours utilized and as a percentage. Use the Resource list to display each resource and its utilization. Use the Time Period list to display resource utilization based on the selected time period (day, week, month or shift). If you select a column in the utilization view, summary information for that time period appears on the left side of the view for the specific time bucket.
The following table describes each item displayed in the Legend:
| Legend Entry | Description |
|---|---|
| Idle | The percentage of time and total hours when the resource is available but not utilized. |
| Delay | The percentage of time and total hours when the resource is not used because of a delay. |
| Down | The percentage of time and total hours when the resource is not used because of down time. |
| Changeover | The percentage of time and total hours that the resource is not used because of a changeover. |
| Maintenance | The percentage of time and total hours that the resource is not used because of a maintenance activity. |
| Run | The percentage of time and total hours when the resource is being run. |
| Start Time | The date and time of the start of the utilization time period. |
| End Time | The date and time of the end of the utilization time period. |
Note: If your schedule contains maintenance, changeovers, delays, or down time, utilization statistics appear in the Legend and the corresponding color-coding appears in the columns. If your schedule does not contain maintenance, changeovers, delays, or down time, these events appear as zero percent in the Legend.
When Shift is selected from the Time Period list, the available shifts and shift times appear below the Legend. To display resource utilization for a shift, select a shift from the time grid. Multiple shifts can be selected.
To display resource utilization for shift overlap, select the overlap from the time grid. The overlapping shifts are highlighted below the Legend. The Start Time and End Time display when the overlap occurs.
To view detail information for a time period, place your mouse over the period in the time grid. Bubble help displays the resource utilization information.
Refer to Viewing Resource Utilization.
Using the Resource Contention View
The Resource Contention view captures the contention encountered for each resource throughout the solve process. This information is useful to find the dominating item or resource bottlenecks during the solve process. The view also serves as a histogram of resource contention if you navigate to it after a solve.
By default, the Resource Contention view displays the contention events that are encountered during the solve using the time bucket.
| Schedule Horizon | Default Time Bucket |
|---|---|
| Greater than 3 months | Month |
| Between 2 weeks and 3 months | Weeks |
| Less than 2 weeks | Days |
You can change the time bucket used by the Resource Contention view to calculate the contention. Time bucket options include month, week, day, shift, and hour. The time bucket setting is independent of the view that is currently displayed using the zoom buttons.
For example, if you change your time bucket to the day option, then the Resource Contention view evaluates and compares the contention during each day, and displays its findings using the color scale. The colors are representative of the contention for each resource over each day. The smaller the time bucket, the more differentiated the results are, due to the smaller pool of data.
Color is used to represent contention intensity. The Set Colors button defines these colors. There are 10 ranges of colors in 10 percent increments.
Using the Set Colors command, you can set new color levels by adding new sliders or moving existing sliders in either direction. This enables you to assign a color to represent different percentages of contention. The colors that you set in the color bar are displayed in schedule views, so that you can always see a consistent color representation of the schedule.
Using the Multi-Capacity Resource Graph View
The Multi-Capacity Resource Graph displays a resource's total available production capacity and how much of that capacity is used over time. You can select any resource and then view levels for that resource by moving your pointer to any point on the graph.
The area in red, at the top of the graph, represents the maximum capacity of the resource. The red shaded area, at the bottom of the graph, represents zero utilization point. You can customize the colors in the view using the icon on the toolbar.
Using Combined Views
To get more detailed information about a generated schedule than from a single schedule view, you can select a combination view. With a combination view, two or more views are synchronized so that when an item is selected in the main view, the other view displays the related information only about that item. For instance, while reviewing the Resource Gantt, you can select a resource and simultaneously view its utilization, item usage, or operation details during a specific time frame. This powerful feature enables you to quickly analyze key elements of your schedule and determine whether any adjustments need to be made. The following combination views are available:
| Combination View Name | Description |
|---|---|
| Resource and Operation Gantt | Displays operations that run on selected resources in the Resource Gantt. |
| Resource Gantt and Utilization | Displays the utilization of selected resources in the Resource Gantt. |
| Item Gantt and Graph | Displays the inventory levels of selected items in the Item Gantt. |
| Resource and Item Graph | Displays the inventory level of an item that is produced or consumed by a single operation. |
| Resource Gantt and Multi-Capacity Resource Graph | Displays the utilization of selected multi-capacity resources. |
| Resource Gantt, Operation Gantt and Item Graph | Displays operations that run on selected resources in the Resource Gantt, and you can see the inventory level of an item that is produced or consumed by a single operation by selecting an operation in the Resource or Operation Gantt. |
Additional combination views can be created and added to the combined group, if necessary. Each view can have the name and button of your choice. To organize your views, you can also set up group views that contain specific schedule views.
While in this view, you can use the scroll bars and zoom options to move to different areas in your view. As long as the synchronized scroll bars feature is active, both views stay synchronized as you move around in the view.
Viewing Critical Path Information
The critical path is a well understood concept in project management. It is defined as the sequence of activities that must be completed on schedule to meet a specific completion date. In other words, if any of the tasks on the critical path is delayed by one second, than the entire project gets delayed by one second. A Visit, which is analogous to a project, can contain thousands of interrelated tasks in a complex task hierarchy where the tasks can be running sequentially and in parallel. You can use the Show Visit Critical Path and Filter Visit Critical Path toolbar buttons to easily identify and visualize the critical path. This allows you to focus on the tasks that are relevant to determining the Visit Completion Date. This feature is a great benefit when trying to determine why the visit is late.
You can view critical path information with Production Scheduling and dramatically improve your efficiency by quickly identifying tasks that impact the overall schedule and reducing the manual scheduling iterations required to produce an acceptable schedule.
To view critical path:
-
From the Production Pegging view, click the Show Visit Critical Path button on the toolbar.
The critical path is highlighted in yellow.
-
To hide tasks not on the critical path, click the Filter Visit Critical Path.
Tasks not on the critical path are hidden. The view title bar is highlighted to indicated a filter is applied to the view.
-
To disable critical path highlighting, click the buttons again to deactivate these features.
Production Scheduling determines the critical path by calculating a "slack" time for an operation. Any operations with 0 (zero) slack are on the critical path.
Slack Time can be viewed from the Operations tab in the Visit Properties window. It is also displayed in bubble help in the Gantt views.
To view operation slack time:
-
Right-click a visit and select Properties.
-
Click the Operations tab. The Slack Time column displays the slack time for each operation assigned to the visit.
-
To examine slack time details, right-click slack time entry and perform the following as needed:
-
Click Open to display work order in Work Order Editor.
-
Click Open Production Pegging Gantt to display Production pegging view.
-
Click Open Operation Gantt to display the operation in the Operation Gantt view.
-
You can display slack time within Gantt views by selecting the Visualize visit operation slack in Gantt Views option from the Global Settings tab of the Options window. This is relevant for Maintenance (cMRO) plans only.
To display slack time in Gantt views:
-
Select Options from the Tools menu.
-
Click the Global Settings tab.
-
Check the Visualize visit operation slack in Gantt Views option.
A red line on the operation indicates the slack, or the amount of time the operation can move before being on the critical path.
Filtering Work Orders
This section discusses how to:
-
Use the Work Order Advanced Filter.
-
Add a new filter.
-
Delete a filter.
-
View and modify filter properties.
-
Save work order filters.
-
Load work order filters.
-
Assign a filter to a view.
-
Remove a filter from a view.
Using the Work Order Advanced Filter
Use the Work Order Advanced Filter to further "slice and dice" data in the various Gantt, Utilization, and Pegging views in a multi-dimensional fashion and filter the content of these views. You can hone in on specific areas of the schedule. For example, you can create a filter to "show me all work orders in from October 25 - November 5th running on Resource (or Group) which have a Firm Start status". The matching work order results display in the bottom of the window. Once your results display, double-click a work order number to open it in the Work Order Editor.
This Work Order Advanced Filter is especially useful to filter Maintenance Work Orders scheduled from cMRO based on the Work Breakdown Structure criteria.
Accessing the Word Order Advanced Filter Window
Use the Work Order Advanced Filter window to view, create, and modify filters for various Production Scheduling views. Once you define a filter, it can be applied to the views.
To access the Work Order Advanced Filter window, perform the following:
-
If no filters currently exist in your model, click the Toggle Work Order Filter button on the toolbar.
-
Select New Filter from Toggle Work Order Filter button list on the toolbar.
From the Work Order Advanced Filter, you can define the filter and view matching work orders.
Defining a Filter
Use the Work Order Advanced Filter window to choose your filter criteria. Most field lists allow you select from values defined in the current model. Use date lists to define calendar dates and date ranges. Click the left arrow (>) for a field to create a custom query based on text entry. The following query options are available:
-
* Zero or more characters
-
? Any single character
-
: Or
-
\ Escape special character
-
Match case (default)
To define a filter:
-
Access the Work Order Advanced Filter window.
-
Use the Work Order Advanced Filter fields at the top of the window to define the filter name and general work order filter criteria. The fields are as follows:
Work Order Advanced Filter Field Description Filter Name Enter the name you want to assign to the filter. Created in scenario A display only field that shows the scenario used to originally define the filter. Clear Filter (button) Select this button to clear all defined filter criteria. Work Order To filter for a specific work order number, select the work order from the list. All work orders within the model display in the list. Description To filter by work order description, enter text. You can use the "%" wildcard symbol for contextual text filtering. For example, all work orders which contain the word avionics would be represented as %avionics%. -
Select the General tab to define a filter based on general work order criteria. The fields are as follows:
Work Order Advanced Filter - General Tab Field Description Type To filter based on work order type, select an option. Valid values are Production, Maintenance, and EAM. Status To filter based on work order status, select an option from the list. All work order status values within the model display in the list. Order Class To filter based on order class, select a value. Available options are Hot, Committed, and Uncommitted. Priority When an Order Class is selected, use this list to filter based on the work order priority. Valid values are 1 - 5. Include Related Work Orders Select this option to have related work orders matching filter criteria displayed in your search results. Quantity Required Enter the quantity required range. Quantity Complete Enter the quantity complete range. Quantity Remaining Enter the quantity remaining range. Request Date Enter request date range. Start Date Enter work order start date range. Completion Date Enter work order completion date range. -
Select the Manufacturing tab to define a filter based on work order manufacturing data. The fields are as follows:
Work Order Advanced Filter - Manufacturing Tab Field Description Produced Item To filter based on produced items in the model, select a list value. Serial Number To filter based on serial number in the model, select a list value. Routing Select a routing. Original Routing In the event a work order was offloaded to an alternate routing, select the original routing option assigned to the work order. Contains Operation / Group Select an operation or operation group. If routing filters are assigned, only operations and operation groups assigned to the selected routing filters display. Contains Operation Status Select an operation status. Available options are Open, Active, and Closed. Uses Resource / Group Select a resource or resource group. Lists all resources and resource groups in the model. If routing and operation filters are assigned, then the values in this list are limited to the resources which are defined in the selected routing and operation filter criteria. Consumes Material / Group Select resource material or resource group. Lists displays all items and resource groups in the model. If routing and operation filters are assigned, the values in this list are limited to the resources which are consumed in the selected routing and/or operation filter criteria. Contains Firm Status Select a firm status. Use to perform a query based on work order that have an assigned firm status. Valid values are Firm Start, Firm End, and Firm Range. Firm Start Date Enter firm start data range. Firm End Enter firm end data range. Shift Calendar To filter based on a shift calendar in the model, select a list value. Starting in shift Select this option to filter work orders that begin in the selected Shift Calendar. Ending in shift Select this option to filter work orders that end, or are completed, in the selected Shift Calendar. Running during shift Select this option to filter work orders that are running, or are being processed, during in the selected Shift Calendar. -
Select the Maintenance tab fields to define a filter based on Maintenance work order (cMRO) and Enterprise Asset Management data. The fields are as follows:
Work Order Advanced Filter - Maintenance Tab Field Description Visit Select a visit. List displays all the visits assigned to work orders in the model. Visit Type Select a visit type. List displays visit types assigned to work orders in the model. Visit Status Select a visit status. Available options are Planning, Partially Implemented, and Implemented. Visit Priority Class To filter based on visit priority class, select a value. Available options are Hot, Committed, and Uncommitted. Priority When a Visit Priority Class is selected, use this list to filter based on visit priority. Valid values are 1 - 5. Visit Completion To filter based on visit completion status, select a value. Available options are On time, Early, and Late. Earliest Start Date Enter visit's earliest start date range. Request Date Enter the visit's request date range. Start Date Enter the visit's start date range. Completion Date Enter visit's completion date range. Maintenance Resource Select a machine resource. Maintenance resource is the name or description assigned to the asset number in eAM. Asset Select an asset. This is the asset number assigned in eAM. Asset Group Select an asset group. Stage (Attribute 1) Select a stage. List displays stages assigned to work orders in the model. Process (Attribute 2) Select a process. List displays all processes assigned to work orders in the model. System (Attribute 3) Select a system. List displays all the systems assigned to work orders in the model. Access Panel (Attribute 4) Select an access panel. List displays all the access panels assigned to work orders in the model. Zone (Attribute 5) Select a zone. List displays all the zones assigned to work orders in the model. Subzone (Attribute 6) Select a subzone. List displays all the subzones assigned to work orders in the model. Department (Attribute 7) Select a department. List displays all the departments assigned to work orders in the model. Unit Name (Attribute 8) Select a unit name. List displays all the unit names assigned to work orders in the model. Non Routine (Attribute 9) Select a nonroutine option. Valid options are Yes, No, or Null. This option is used indicate whether the work order is of type non routine or not. If set to "null", all work orders appear. If set to Yes or No, then filter performs query based on status as selected. -
Use the Matching work orders region to display matching work order results. The fields are as follows:
Matching work orders Region Field Description Find (button) Click Find to display work orders that match your filter criteria. If the Find matching work orders automatically option is checked, you do not need to click Find. Your work order results are displayed as you define filter criteria. Find matching work orders automatically Check this option to display work orders that match your filter criteria automatically. Work Order Number This column displays all work orders that match your filter criteria.
To view a work order in the Work Order Editor, double-click the work order row, or right-click the work order and select Open.
To display the work in the Production Pegging view, right-click the work order and select Open Production pegging Gantt, -
Click OK.
About Filter Views
Once a filter is defined, it can be assigned to the following views:
-
Production Pegging - Only work orders which meet the criteria specified should be displayed. Empty folders should not be displayed. In the event a work order has multiple operations and resource level filtering is specified, only the work order operations which meet those criteria are outlined.
-
Resource Gantt - Only operations belonging to the work orders in the filter are displayed. This includes the utilization shading for multi-capacity resources.
-
Operation Gantt - Only operations belonging to the work orders in the filter are displayed. The Operation Gantt is also filtered to only those operations running on this resource.
-
Resource Utilization - Utilization is calculated based on filtered work orders. This view provides utilization contribution.
-
Multi-Capacity Resource Utilization - Utilization is calculated based on filtered work orders. This enables users to understand utilization contribution.
-
Select Work Orders for Release - A filter can be assigned on an approved scenario when selecting specific orders for release.
When a filter is assigned to a view, only matching data displays. If no information appears in the view, then the filter has no matching data for the view.
Adding a New Filter
To create and save filter to your scenario:
-
Select New Filter from the list option displayed to the right of the Toggle Work Order Filter button on the toolbar.
-
Define the filter as needed from the Work Order Advance Filter window.
-
To save the filter, click OK. The filter is saved to the scenario. To exit the Work Order Advance Filter window without saving the filter, click Cancel.
Deleting a Filter
-
Select Work Order Filters from the list option displayed to the right of the Toggle Work Order Filter button on the toolbar.
-
Select the filter you want to remove from the Work Order Filters dialog and click Delete.
-
Click Close.
You can also delete a filter by selecting the filter from the from the list option displayed to the right of the Toggle Work Order Filter button on the toolbar. A check mark appears when the filter is selected. Delete the selected filter by selecting Delete Filter from the Work Order Filters list option.
Viewing and Modifying Filter Properties
To view and modify filter properties:
-
Select Work Order Filters from the list option displayed to the right of the Toggle Work Order Filter button on the toolbar.
-
Select the filter you want to view and click Properties. The Work Order Advanced Filter window appears and displays the filter criteria.
-
If you want to make changes to the filter, adjust the fields as necessary and click OK.
Saving Work Order Filters
Once you define a filter, you can save your filter definitions to a Work Order Filter (.wof) file. This file can then be used to load and apply the filters to other Production Scheduling models and scenarios as needed.
To save work order filters:
-
Select Work Order Filters from the list option displayed to the right of the Toggle Work Order Filter button on the toolbar.
-
Click Save As.
-
Enter the file name you want to assign in the File name field.
-
Navigate to the location where you want to save the file. By default, the file is saved to the same location as the model used to define the filter.
-
Click Save.
Loading Work Order Filters
Production Scheduling filters defined in Work Order Filter (.wof) files can be loaded and used in your model. Once loaded into your model, you can adjust the filter as needed based on your needs.
To load work order filters:
-
Select Work Order Filters from the list option displayed to the right of the Toggle Work Order Filter button on the toolbar.
-
Click Load.
-
Navigate to and select the appropriate file.
-
Click Open. All filters defined in the file appear in the Work Order Filters dialog.
Assigning a Filter to a View
Once a filter is assigned to your model, you can apply it when needed.
To assign a filter to a view:
-
Open the appropriate view.
-
Select the filter you want to apply from the list options displayed to the right of the Toggle Work Order Filter button on the toolbar. A check mark appears next to the selected filter.
The Toggle Work Order Filter button appears highlighted when a filter is applied to a view, and the selected filter name appears to the right side of the view title bar.
The view is refreshed to display only the results applicable to the filter.
Removing a Filter from a View
To remove a filter from a view:
-
Click the Toggle Work Filter button on the toolbar.
-
Deselect the filter from the list option displayed to the right of the Toggle Work Order Filter button on the toolbar. The view is refreshed to display all data.
Analyzing Scheduled Resources
This section discusses how to:
-
Relax resource constraints.
-
View pegging resources.
-
Sort resources.
-
View resource utilization.
-
View resource contention.
-
View alternate resources.
Relaxing Resource Constraints
Resource constraints can be relaxed and reactivated when viewing the Resource Gantt, Resource Utilization, and Resource Calendar.
To relax resource constraints:
-
Access the appropriate schedule view.
-
Right-click the resource and select Relax Constraints.
The relaxed resources appear in orange in the schedule views. Click Solve to solve the schedule.
To select more than one resource at a time, hold down the Ctrl key to select individual resources, or press Shift to select a block of resources.
To reactivate resource constraints right-click the resource and select Activate Constraints.
Viewing Pegged Resources
-
Access the Resource Gantt.
-
Select one of the following options:
-
Peg Upstream - Displays upstream operations.
-
Peg Downstream - Displays downstream operations.
Note: To display both upstream and downstream operations, select both options.
-
-
Click the first operation for which you want to view pegging information.
The Resource Gantt highlights the upstream operations in brown and the downstream operations in purple.
-
Repeat the previous step for other operations to view pegging information.
-
Click the pegging buttons again to turn off this option.
Sorting Resources
-
Access the Resource Gantt.
-
On the schedule view toolbar, click Zoom In to increase the size of the columns until dates are displayed across the top.
-
On the sort order drop-down list box, select one of the following options:
-
Default Sort - Sorts resources in alphanumeric order.
-
Utilization Sort - Reorders the resources in the Resource Gantt in order of their utilization. Resources are sorted by utilization from highest to lowest.
-
Peg Sort - Reorders the operations in the Resource Gantt according to the routing order and their associated resources. You can turn off this feature when it is not required. Doing so returns the resource order to its original sequence.
-
Viewing Resource Utilization
-
Select Resource Utilization from the Views list bar.
-
Click Zoom In, Zoom Out, or Zoom to 100 percent to display the view at the required level of detail.
-
Select a resource from the Resources list.
The vertical bars in the view represent the utilization level for that resource.
-
Select one of the following time periods from the Time Period available options: Daily, Weekly, Monthly, andShift.
-
From the view time grid, click a time period to display utilization statistics for that time period.
-
To display resource utilization for a time period, place your mouse over the period in the time grid. Bubble helps displays information about the time period.
Viewing Resource Contention
-
Access the Resource Contention view.
-
Click Zoom In, Zoom Out, or Zoom to 100 percent to view the schedule at the required level of detail.
-
Select a resource from the Resources available options.
The horizontal bars in the graph represent the contention level for that resource.
Note: You should refer to the Resource Contention view after the schedule has been solved. Watching the Resource Contention view during the solve slows down the solve because of the necessary graphical updates.
Viewing Alternate Resources
Use the Production Pegging view to show resource alternates.
To view alternate resources:
-
Access the Production Pegging view.
-
Right-click the Work Order Tree or Demand Order Tree header, select Layout and check Show Resource Alternates option.
Alternates for the specific resource are displayed in the Production Pegging view at the resource level when you expand an operation. You can also manually offload to an alternate using cut and paste, or drag and drop, and then running a repair solve.
Analyzing Scheduled Items
This section discusses how to:
-
View item graph data.
-
View item properties.
-
View item groups.
-
View item production and consumption.
-
Sort by degree of violation.
Viewing Item Graph Data
-
Access the Item Graph.
-
Select one of the following options from the Items list box:
-
All Items
-
An item group
-
An individual item
-
-
On the Items list, click an item.
The chosen item is selected, and the level for that item displays as a line in the graph.
-
Move your cursor over any point on the chart line.
Bubble help displays item description, current quantities, and level start and end dates.
-
Click the zoom buttons to display more or less detail.
-
On the toolbar, click the item graph buttons as follows:
-
Click the Scale buttons to change the scaling on the y axis.
-
Click the Show Spikes button to display overlapping supply and demand events that occur at the same time.
-
Viewing Item Properties
-
Access the Item Graph or Item Gantt.
-
Use the Items list box to view a specific item or display a group of items.
-
Right-click an item and select Properties.
Viewing Item Groups
-
Access the Item Gantt.
-
Click All Items.
-
Select the specific item group that you want displayed in the Item Gantt.
Note: If the group does not appear in the list, verify that the properties of the group are set to display in the Item Gantt. If you add a group after the initial solve, close and reopen the schedule, and then select the Item Gantt.
Viewing Item Production and Consumption
To view item production and consumption:
-
Access a Resource and Operation Gantt view combined with the Item Gantt and Graph view.
-
Click the operation for which item data is displayed.
-
Click the Produced Items or Consumed Items button from the toolbar.
The Item Gantt (or Graph) view is filtered for the option that is selected.
Sorting by Degree of Violation
To sort the degree of violation:
-
Access the Item Gantt.
-
Click Sort Items.
The items are sorted in descending order with the most contentious items at the top of the view.
-
To return the view back to its original sort order, click Sort Items again.
The view returns to its original appearance.
Analyzing Scheduled Operations
This section discusses how to:
-
View an operation quick summary.
-
View operation groups.
-
View pegged operations.
-
Modifying firm status and offloading setting.
Viewing an Operation Quick Summary
To view an operation quick summary:
-
Access the Operation Gantt.
-
Hold your cursor over any operation.
Information about the operation, including its name, start time, and duration, appears in the bubble help.
Note: This procedure can be used to view quick summary information in the Production Pegging and Resource Gantt.
Viewing Operation Groups
-
Access the Operation Gantt.
-
On the Operation Gantt, select the operation group that you want to view from the Operations available options.
-
Obtain schedule information as described in the following steps.
-
Review any exceptions in the Exception grid. If the grid is not displayed, click Display the exceptions button from the toolbar.
-
Use the zoom buttons view the calendar grid as needed.
-
Right-click any operation to view and make changes to properties.
Note: If you rename the group or change properties, you need to close and reopen the schedule, and then select the Operation Gantt.
If the group does not appear in the list, verify that the group properties are set to display in the Operation Gantt.
Viewing Pegged Operations
-
Access the Operation Gantt.
-
Select one of the following options:
-
To display pegged operations upstream of the selected operation, click Peg Upstream.
-
To display pegged operations downstream of the selected operation, click Peg Downstream.
-
To display all pegged operations, click the Peg Upstream or Peg Downstream icons on the toolbar.
-
-
Select the first operation for which you want to display pegging information.
The Operation Gantt view highlights the upstream operations in brown and the downstream operations in purple.
Modifying Firm Status and Offloading Settings
To adjust firm status and offloading:
-
Access the Operation Gantt.
-
Select an operation.
-
Right-click and select the appropriate firm status. The following options are available:
-
Firm Start - Select this option to use a firm start date.
-
Firm End - Select this option to use a firm end date.
-
Firm Range - Select this option to use a firm date range (start date and end date).
-
Unfirm - Select this option to remove any firm settings.
Firmed operations appear green in the view. To specify a specific firm dates, go to the Operations tab in the Work Order Editor and modify the Start Date and End Date fields as needed.
-
-
To adjust the offloading setting, select the appropriate offload option. The following options are available:
-
Allow Offloading - Select this option to allow operation to be offloaded to an alternate resource.
-
Disallow Offloading - Select this option to prevent an operation from using an alternate resource.
-
-
Perform a solve to update your schedule.
You can also elect to manually populate the firm dates from the Operations tab in the Work Order Editor if desired. If you select Firm Range from the Gantt view, Firm End the appropriate values and dates would show up in the Work Order Editor, the main difference being which date(s) are populated. (Firm Start populates Start Date of the Work Order Operation, Firm End populates the End Date and Firm Range populates both start and end dates).
You can also set the offloading from the Bill of Resource tab in the Work Order Editor. Select No from the Allow Offloading list to prevent offloading from occurring.
Using Combined Views
This section discusses how to:
-
Add a combined view.
-
View combined views.
Adding a Combination View
-
Access the View Wizard window.
-
In the List of available subviews, select a schedule view that you want to appear in your combination view.
-
Click Next to move the subview to the Selected subviews area.
-
Repeat steps 1 and 2 for each additional view.
-
If necessary, click the Set Order buttons to delete or reorder views.
When the new view is created, the views are displayed in the same order that they are displayed in the Selected subviews list. A full description of each button is described in the following table:
View Option Description Delete view This button is available to remove the view from the Selected subviews. Move up view This icon is used to move a view up in the Selected subview list. Move down view This icon is used to move a view down in the Selected subview list. -
Click Next, enter a view name, and click Next again.
-
On the View Wizard, select a button for the group, and click End.
The selected button and the name is added to the bottom of the current view group.
Viewing Combined Views
Select the Combined button from the View list bar. The following image provides an example of the Resource Gantt, Operation Gantt, and Item Graph combined view.
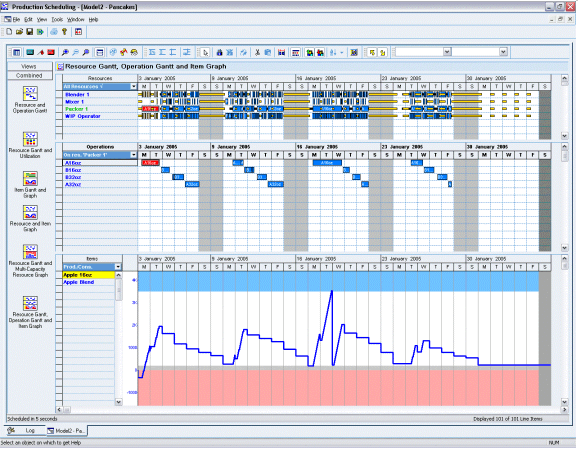
Combined view
To view combined views:
-
Select the Combined button from the View list bar. If you created a new group view, select the group name button.
-
Click a view button.
-
Click an element in the main view to display additional details.
In a Resource Gantt, you can click any resource. The detail view might display how this resource is being used or the operations to which it is associated, depending on your choice of detail view.
In the Resource or Operation Gantt views, you can right-click any operation and display either the produced or consumed items, or all of the items that are produced and consumed by the operation.
In the Item Gantt, you can click any item. The detail view (the Item Graph) displays further information about that item's stock levels.
Working with Exceptions
This section provides an overview on exceptions and discusses how to:
-
Access exception messages.
-
Display the Production Pegging view, the Work Order Editor, or Critical Path from the Exception grid.
-
Filter exception messages.
Exceptions Overview
Exceptions are available from either a solved or unsolved schedule. Exceptions display any violations of soft constraints. Exceptions can be accessed from the Model Workspace in a tree format. When you click an exception that is displayed in the Model Workspace tree, the Exception grid appears at the bottom of the schedule view. The Exceptions grid contains tabs the following tabs to identify exception category:
-
Demand
-
Inventory
-
Work Order
-
Maintenance
-
Resource
Within each of these categories are various types of exceptions. The Exceptions grid displays information about each violation so that you can resolve the problem.
The Root Cause column of the Exceptions grid provides information to guide you to any problem operations. For instance, a message such as "Purchased Part Constraint for Deliver 9011" indicates a possible shortage of purchased parts on hand for the operation called Deliver 9011. To further expand on the operation itself, you can view the operation properties directly from the Exceptions grid. The operations Properties window displays the time when the operation scheduled run time and its associated resources. This information can help to identify the root cause of the problem.
You can navigate from a demand or work order exception in the Exceptions grid to view the violation in the Production Pegging view. When you navigate to the Production Pegging view, the applicable demand or work order is displayed and the operation in question is highlighted.
The Exception Tree
In the Model Workspace, the exception tree is arranged into the following categories and types:
| Category | Type |
|---|---|
| Demand | Request Date Violation - An exception is generated when a demand is late. |
| Inventory | Item Maximum Level Violation - An exception is generated when inventory level exceeds maximum. Item Minimum Violation - An exception is generated when inventory level is below minimum. Item Safety Violation - An exception is generated when inventory level is below safety level. |
| Work Order | Operation Past Due - An exception is generated when a work order operation is late because it was firmed before start of horizon. Operation Fixed Date Violation - An exception is generated when a work order operation starts outside its firm date constraints. Request Date Violation - An exception is generated when a work order is late. |
| Maintenance | Visit Late Exception - An exception is generated when a Visit is late. Visit Production Start Delay - An exception is generated when work on the Visit does not start immediately. Milestone Late Exception - An exception is generated when the Actual Completion Date is greater than the Target Completion Date. |
| Resource | Minimum Batch Violation - An exception is generated when a batch contains less than the resource's minimum capacity Resource Utilization - An exception is generated when resource utilization exceeds 100% of available capacity. |
When an exception is selected in the Model Workspace, the Exceptions grid opens and the applicable exception tab is displayed.
A given exception category, such as Work Orders, may have more than one exception type. If you select a specific exception within the tree, the exceptions within the tab are filtered so that only the selected exception type is displayed. For example, if there are both Operation Fixed Date Violations and Operation Past Due exceptions, and you select only the Operation Past Due exception in the Model Workspace, then only the Work Order tab is displayed with only those exceptions that have Operation Past Due exception types.
The Resource category provides a Resource Utilization exception to indicate when resources which are not part of a bottleneck resource group have capacity violations (when capacity constraints are relaxed).
The Exceptions Grid
The Exceptions grid displays information about any solver-based constraint violations. These violations do not necessarily mean that the schedule is infeasible but rather that a soft constraint cannot be met. For example, the solver might be required to temporarily violate a minimum inventory level to meet demand. The Exceptions grid displays these violations in detailed tables so that you can investigate and improve the schedule.
The Exceptions grid has four tabs that correspond to the categories in the exception tree: Demand, Inventory, Work Order, Maintenance, and Resource. The exception count is displayed next to the category description.
If desired, the Exceptions grid can be modified to view its contents better. By adjusting the Exception grid window size and column width, you can expand or reduce the amount of information displayed.
Accessing Exception Messages
Use Model Workspace to display exception categories and exceptions, or display the Exceptions grid to access exception categories and messages.
To access exception messages, perform one of the following:
-
From the Model Workspace, expand the All Exception tree. Double-click an exception category, or expand the category folder and double-click an exception type. The Exception grid displays the selected category or type.
-
Accessed a schedule view, such as Production Pegging. Select a tab from the Exception grid to review the exception messages for that category. If the Exception grid is not displayed, select the Display the exceptions button from the toolbar.
Displaying the Production Pegging View, the Work Order Editor, or Critical Path from the Exception Grid
Use the Exception grid to display the Production Pegging view, the Work Order Editor, or the Critical Path for an exception alert. Visit and milestone properties are also available from the Maintenance tab.
-
From a schedule view, access the Exceptions grid. If the grid is not displayed, select the Display the exceptions button from the toolbar.
-
Right-click the exception row and select one of the following options:
-
Drill down to Production Pegging - Displays the Production Pegging view. Based on the exception tab used, the appropriate demand, work order, item, visit or resource is highlighted in the view.
-
Drill down to Work Order Editor - Displays the Work Order Editor and highlights the appropriate attribute.
-
Drill down to Critical Path - This option is available from the Maintenance tab and displays the critical path for visit and filters view to display only those events on the critical path. The view title bar is highlighted to indicate the filter is applied to the view.
-
-
To display visit or milestone properties, select the Maintenance tab, right-click a visit or milestone, and select Visit/Milestone Properties.
Filtering Exception Messages
From the Exception grid, you can filter, or hide, data columns as needed and rearrange the column order. Customizing the grids can make it easier to analyze your exception messages and identify potential problems.
To filter exception messages:
-
Access the Exceptions grid.
-
Right-click a column header.
The columns displayed within the exception tabs appear checked within the menu.
-
To filter, or hide, a columns, perform one of the following:
-
Deselect the column name.
-
Select Choose Columns. Deselect the columns you want to filter, or click Hide. To reorder to columns displayed, select a column name and use the Move Up and Move Down buttons to arrange the column order. Click OK.
-
Working with the Resource Sequence View
The Resource Sequence view is used to display detailed information for resource assignments. It also allows you to perform the following:
-
Display resource information based on the selected resource.
-
Reschedule operations manually to further improve the schedule generated from Production Scheduling.
-
View changeovers between operations.
-
Edit operation dates and firm status.
-
Access other views and perform tasks by right-clicking on element within view.
-
Merge contiguous operations.
-
Customize resource information displayed in view.
The Resource Sequence view can be accessed from any of the scheduled views and is embedded in the main workspace so it can be viewed in conjunction with other schedule views.
Displaying the Resource Sequence View
From a schedule view, click the Display Resource Sequence View button from the toolbar. The view appears within the main workspace below the current view. This view can be displayed with a schedule view and the Exceptions view.
To hide the Resource Schedule view, click the Display Resource Sequence View button again.
If operations do not appear in the view, perform a solve.
The Resource Sequence view displays the order of operations assigned to the selected resource as well as operation details. Changeovers are also visible within the view. You can customize the view by selecting the columns you want displayed.
The Resource Sequence toolbar displays the following:
-
Resource - Select a resource from the list to display resource assignments.
-
Move Selection Up - Select to move a selected operation up in the sequence order.
-
Move Selection Down - Select to move a selected operation down in the sequence order.
-
Move Selection Before Cursor - Use to move an operation before a specific operation.
-
Open Operation Diagram - Click to display the operation diagram view.
-
Open Routing Diagram - Click to display routing diagram view.
-
Drill down to Work Order Editor - Click to display Work Order Editor.
Editing Operation Start Time, End Time, and Firm Status
Use the Resource Sequence view to edit an operation Start Time, End Time, and Firm Status.
-
From the Resource Sequence view, use the Resource list to select a resource.
-
Edit the Start Time or End Time fields. Adjusting the Start Time or End Time can impact the operation sequence. The view automatically moves the operation to the appropriate sequence order based on your changes.
-
Use the Firm Status list to edit the operation's firm status.
-
Click Solve to display your changes.
-
Publish the schedule to update the EBS environment with your changes.
Resequencing Operations
Use the Resource Sequence view to resequence operations assigned to a resource. From this view, you can change the sequence for one or more operations at a time using the view's toolbar buttons or using drag and drop.
-
From the Resource Sequence view, use the Resource list to select a resource.
-
Select the operations to be reordered. You can use the Ctrl or Shift keys to select multiple operations.
-
Resequence operations using one of the following methods:
-
Select an operation and click the Move Up or Move Down buttons to the top right of the view. You can also reorder the sequence by right-clicking the operation and selecting Move Up or Move Down.
-
To move an operation more than one row up or down (for example to move operation sequence 10 to occur before operation sequence 4), perform the following:
-
Press the Ctrl key and click the row you want the operation(s) to appear before.
-
Press the Ctrl key and select a row where the operation(s) will be moved.
-
Click Move before Cursor button.
-
-
Drag and drop the operations to the new sequence location.
Operations impacted by the change appear bold in the view until you perform a solve.
-
-
Click Solve to display your changes.
-
Publish the schedule to update the EBS environment with your changes.
Opening Other Views from Resequence View
Use the Resource Sequence view to access other views.
-
From the Resource Sequence view, use the Resource list to select a resource.
-
Select an operation.
-
To display the operation diagram view, perform one of the following:
-
Select Open Operation Diagram button from the view toolbar.
-
Right-click and select Open.
-
-
To display the Gantt Operation view, right-click and select Open Gantt Operation.
-
To display the routing diagram view, select Open Routing Diagram from the view toolbar.
-
To display the Work Order Editor, select Drill down to Work Order Editor. The Operations tab appears within the editor and the operation is highlighted.
Merging Operations
Use the Resource Sequence view to merge the sequential operations assigned to the selected resource.
-
From the Resource Sequence view, use the Resource list to select a resource.
-
Select the operations. Only sequential operations can be merged.
-
Click the Merge Operation button from the toolbar.
Working with Key Performance Indicators
This section provides overview of Key Performance Indicators (KPIs) and schedule comparison and discusses how to:
-
Access the Key Performance Indicators view.
-
Compare production schedules.
Key Performance Indicators Overview
After you create the initial schedule, it can be duplicated as many times as necessary, and you can make different changes to each version using manual scheduling. To determine which version of the schedule is the most cost-efficient or best fulfills customer orders, you can evaluate all the schedules against each other using KPIs. KPIs are objective measures that can provide you with important information about how the schedules perform from a customer service, material, cost, and manufacturing perspective. KPIs are available for solved schedules and are dynamically refreshed each time a schedule is solved or repaired.
Key Performance Indicators are calculated values that enable you to evaluate schedules and select a schedule that best suits your specific criteria. The Key Performance Indicators view can be demand centric or work order centric. The KPIs are categorized into the following tabs within the Key Performance Indicators view:
-
Customer Service
-
Materials
-
Costs
-
Manufacturing
-
Maintenance
You can sort the schedules according to your choice of KPI, rearrange the order of the columns, or hide specific columns or groups from displaying in this view. The schedules that are displayed in the Key Performance Indicators windows can be returned to the original sorting order if you no longer want to sort by a specific KPI.
Column width and row height can also be changed. If you do not want to view a specific KPI or if you want to keep it from general view, you can hide that column. Hiding all of the columns in a group hides the group. If you prefer to evaluate schedules based on a specific KPI group such as Costs, you can reorder the KPI groups so that the group appears first in the grid.
Note: A number of the KPIs depend on pegging information for their calculations. Verify that you have specified the primary operations for each routing and the primary outputs.
Accessing the Key Performance Indicators View
To access the Key Performance Indicators view:
-
Select Key Performance Indicators from the View menu.
-
Select a tab to view KPI metrics for the following KPI categories:
-
Customer Service
-
Materials
-
Costs
-
Manufacturing
-
Maintenance
-
Key Performance Indicators - Customer Service Tab
The Key Performance Indicators - Customer Service tab outlines metric information such as demand fill rates, number of stockouts, and so on.
The following table describes Key Performance Indicators - Customer Service tab metric data:
| Column | Description |
|---|---|
| Order Fill % | This statistic is taken directly from the summary statistics in the Supply & Demand Editor, where these are available by folder, and by subfolder, which makes them even more useful. Order fill rate is calculated by dividing the total number of orders that have all their line items met on time by the total number of orders in the equation. |
| Line Fill | This statistic is taken directly from the summary statistics in the Supply & Demand Editor, where these are available by folder, and by subfolder, which makes them even more useful. Line fill rate is calculated by dividing the total number of on time line items by the total number of line items in the equation. |
| Unit Fill % | This statistic is taken directly from the summary statistics in the Supply & Demand Editor, where these are available by folder, and by subfolder, which makes them even more useful. Unit fill rate is calculated by dividing the total number of on time units ordered by the total number of units in the equation. For example, if you have two sales orders that have a total number of units ordered across various items of 10,000 and only 6,000 items are on time, then your unit fill rate is 60 percent. |
| Number of Stock Outs | This is the total number of times you drop below the greater of item minimum or zero in the horizon for all of your items. |
| Stock Out Time | This is the total amount of time in the horizon that the schedule is stocked out across all items. The time is expressed in the time unit in the scenario properties. See "Setting up the Scenario Properties - General Page," Configuring Scenario Properties, Production Scheduling. |
Key Performance Indicators - Costs Tab
The Key Performance Indicators - Costs tab provides various costs associated with the schedule such as changeover cost, manufacturing costs, and so on.
This table explains the Key Performance Indicators - Cost tab metrics data:
| Column | Description |
|---|---|
| Change Over Cost | This is the sum of costs for all scheduled changeovers in the schedule. Each changeover has a cost associated with it in the changeover matrix. Every time a changeover occurs, it is added to the total cost. |
| Inventory Cost | The inventory cost provides the total carrying cost offset by total stockout costs. You can specify carrying costs, stockout costs, and safety violation costs on an item. You can also specify your time unit. The time is expressed in the time unit in scenario properties. See "Setting up the Scenario Properties - General Page," Configuring Scenario Properties, Production Scheduling. It is calculated as follows: sum of individual inventory costs, Ci, where Ci = (inventory carrying cost * area above zero) + (inventory stockout cost * area below zero) (areas from the Item Graph). |
| Manufacturing Cost | This cost reports the sum for all operating costs occurred in the schedule. It is calculated as follows: setup cost + (duration of each operation * (resource operating cost + operation operating cost). |
Key Performance Indicators - Manufacturing Tab
The Key Performance Indicators - Manufacturing tab provides metric information that includes plant throughput and resource utilization.
This table explains the Key Performance Indicators - Manufacturing tab metrics data:
| Column | Description |
|---|---|
| Change Over Time | This is the sum of time for all scheduled changeovers. The time is expressed in the time unit in scenario properties. See "Setting up the Scenario Properties - General Page," Configuring Scenario Properties, Production Scheduling. |
| Machine Utilization % | This is the average for all reusable resources of run time divided by up time. Run time is the sum of all operations that are run on this machine. Up time is the schedule horizon minus the sum of delay and down calendars on the resource. |
| Throughput (Can be viewed by shift, day, week, or month.) |
This is the sum of the quantity of all demands divided by plant cycle time. Plant cycle time = End Time of last scheduled operation - Start Time of earliest scheduled operation (of all operations in the schedule). For example, if it takes 10 days from the start of the first operation to the end of the last operation to produce 100 units, the shift throughput is 3.33 units, daily throughput is 10 units, weekly throughput is 70 units, and monthly throughput is 280 units. |
| Manufacturing Cycle Time | The average amount of time that it takes to manufacture items during the schedule horizon. For each demand routing instance = (End Time of Latest Operation - Start Time of First Operation) / Number of Units of Item Produced. The time is expressed in the time unit in scenario properties. See "Setting up the Scenario Properties - General Page," Configuring Scenario Properties, Production Scheduling. For example, if time is set to days and you can produce 1 unit in 24 hours for an operation, you have demand for 1 unit. If you produce 1 unit, this value is displayed as 1. If you change the time unit to hours, it is displayed as 24. |
Key Performance Indicators - Materials Tab
The Key Performance Indicators - Materials tab provides various metric information that outlines inventory turns, substitutions, and so on.
This table explains the Key Performance Indicators - Materials tab metrics data:
| Column | Description |
|---|---|
| Inventory Turns | Inventory turns are an average for all items that have demand. Inventory turns are calculated as follows: total demand quantity / average item level in the horizon. |
| Periods of Cover Which can be viewed by shift, day, week, or month. |
Average of Pi, where Pi is the number of periods before a demand that is not covered by the current inventory level at the start of a period. |
| Number of Substitutions | The total number of times a lower priority item is selected from an item set. |
Key Performance Indicators - Maintenance Tab
Use the Key Performance Indicators - Maintenance tab to compare maintenance metrics between scenarios.
Use the Time unit for periods of cover and throughput list to view results based on Days or Weeks.
Use the Maintenance Work Order Filter list to assign a defined filter to the KPI view. When a filter is assigned, the name appears in the data columns to identify difference between filtered and non-filtered data. If a filter is not applied, (no filter) appears below the column name.
This table explains the Key Performance Indicators - Maintenance tab metrics data:
Example of Average Visit Risk Index
The Maintenance tab provides an indicator to assess the relative risk of a visit. Conceptually, even though a visit is on time if it is completed 1 day before the Visit request date there is more risk compared to a visit that is completed 7 days before its request date. The amount of remaining work is also a factor. If two visits are completed 7 days before the request date and 1 Visit has 2 days of work remaining and the other visit has 20 days of work remaining the visit with 20 days is more likely to be late since there is more time for unexpected events (non-routines, resource down) to occur.
The Visit Risk Index (VRI) normalizes the amount of time a visit is early (late) over the remaining time of the visit.
Average Visit Risk Index = {Amount of Time a Visit is Early (late)} / {Remaining time of the Visit}
| Visit | Remaining Visit duration | Amount of Time Early or Late (-ve = Early, +ve = Late) | Visit Risk Index |
|---|---|---|---|
| Visit 101 | 36 | -1 | -0.028 |
| Visit 102 | 40 | 15 | 0.375 |
| Visit 103 | 60 | -1 | -0.017 |
Based on example, Average Visit Risk Index = 0.11
In the example above, Visit 103 is Riskier than Visit 101 since it has more time remaining. The Average Visit Risk Index is the overall Risk indicator for all the Visits and will be shown in the KPI view. The higher the number, the Riskier the Visit will be. The individual Risk index appears in the bubble help of the Visit in the Production Pegging view, which appears when the mouse is placed over visit makespan bar.
Schedule Comparison Overview
Comparing schedules is ideal if you want to make a change to an existing schedule and assess its impact to the original schedule. You begin by renaming the original schedule Baseline Schedule. A duplicate of this schedule can be made as many times as necessary. Then, as changes are made to each of the duplicate schedules and repaired, rename the schedules with more descriptive names. With all the schedules contained in a schedule folder, you can then compare these schedules.
Compare the KPIs for a schedule against a baseline schedule to determine the net difference in customer service between schedules. You can also select the colors used to highlight the baseline and comparison schedules in the Key Performance Indicator window.
Once a comparison is defined, you can customize how the Comparison Criteria appears to better analyze your data.
To compare scenario results:
-
Select Key Performance Indicators from the View menu.
-
In the Comparison Criteria region, select the Baseline Schedule. The list displays the scenarios in your model. The selected baseline is highlight in light blue by default.
-
Select Compare to list and choose the scenario you want to compare. The selected comparison is highlighted in light yellow by default.
You can change the highlighting colors by selecting Customize Colors on the toolbar.
-
Use the Show list to define criteria displayed. Available options are Demands, Work Orders, Visits, and Milestones.
The data displayed in the Comparison Criteria region is updated based on the selected Show list option.
Customize the data displayed using the Choose Columns window as described below.
-
Used the Status list to filter your results. Available options are as follows:
-
* - Displays all data - no filter.
-
Was On-time - Now Late
-
Was late - Less Late
-
Was Late - More Late
-
-
Use the Choose Columns window to customize the data in the Comparison Criteria region.
-
Right-click column header from Comparison Criteria region and select Choose Columns.
-
To display a column, select the column name check box, or select the column name and click Show.
-
To hide a column, deselect the column name, or select the column name and click Hide.
-
To change the order columns appear, select column name and click the Move Up or Move Down buttons to arrange the display order.
-
To display all columns, click Show All.
-
To reset window to default setting, click Reset.
-
To save your settings, click OK.
The Comparison Criteria data is sorted based on your settings.
-
By comparing and refining schedules in the KPI window, you can continually improve the production planning process and ensure that your enterprise has the materials available to meet the requirements in the production plan. The KPIs displayed in the Key Performance Indicators window are updated automatically when you solve your schedule.
For example, if Demand is selected from the Show list, the following table describes the demand data that displays.
| Field | Description |
|---|---|
| Demand | The demand code for the schedule and the associated line item. |
| Line Item | The line item number of the demand. |
| Item | The item that is scheduled for production. |
| Order Class | The order class of the line item. |
| Priority | The demand priority of the item that is scheduled for production. |
| Customer | The customer that is requesting the item. |
| Change in Makespan | The change in the duration of the demand, including associated line items and routings. The value is expressed in days and hours. A negative value indicates a shorter makespan. |
| Change in Lateness | The change in lateness between the baseline schedule and the schedule used in a comparison. The value is expressed in days and hours. A negative value indicates that the lateness of the demand is reduced. |
| Demand Requested Date | The request date indicated by the baseline schedule. For new demand, the request date is taken from the comparison schedule. |
| Demand Available Date (Baseline Schedule) | The available date indicated by the baseline schedule. |
| Demand Available Date (Comparison Schedule) | The available date indicated by the comparison schedule. |