Profit Analysis
This chapter covers the following topics:
- Overview of Analyzing Gross Profits
- Generating Data for Profit Analysis
- Selecting Search Criteria
- Viewing an Overview of Gross Profits
- Viewing Gross Profit Products
- Viewing Gross Profit Customers
- Viewing Impacts on Gross Profit
Overview of Analyzing Gross Profits
The In-Memory Cost Management Profit Analyzer provides the ability to analyze the impact of Cost of Goods Sold (COGS) and profit margins in your organization. Oracle Business Intelligence Enterprise Edition (OBIEE) technology provides a graphical dashboard displaying actual versus simulated COGS and gross margins originating from variations to costs. This dashboard enables you to visualize and quickly analyze costs occurring across the supply chain. When cost changes occur, you can investigate deviations, and then take corrective action. You can view detail panes on the dashboards to examine actual and simulated data on:
-
Cost of Goods Sold and gross margins on shipped, unshipped orders, and planned orders.
-
Sales orders shipped.
-
Planned orders.
-
Top items sold, planned, and shipped.
-
Orders by product and customer.
-
Hierarchy by product and customer.
You can display data in either a graph or table view, and export data to PDF, Microsoft Excel, and other documents.
There are two OBIEE dashboards to analyze Cost of Goods Sold and gross profit data. Both dashboards show the actual compared to simulated costs created in the Cost Impact Simulator:
-
Gross Profit Analysis: You can access this dashboard directly from the Navigator. This dashboard shows the impact of profitability in three areas: Overview, Product, and Customer. All panels enable you to refresh, print, export, or copy the data shown in the specific panel.
-
Impact on Gross Profit: You can navigate from the Cost Impact Simulator to analyze the downstream impacts of changes to costs, and also from the Navigator. This dashboard shows the cost impacts of previous simulations. All panels enable you to refresh, print, export, or copy the data shown in the specific panel.
Note: When launching the Oracle Business Intelligence Enterprise Edition (OBIEE) pages from the Cost Impact Simulator, your user responsibility must have access to the CIS GPA Common function. See: Responsibilities.
Related Topics
Generating Data for Profit Analysis
Viewing an Overview of Gross Profits
Viewing Gross Profit Customers
Viewing Impacts on Gross Profit
Generating Data for Profit Analysis
Several concurrent programs are used to collect cost information and generate data to display on Profit Analysis dashboards:
-
Create Product Category Hierarchy (In-Memory Cost Management)
-
Create Territory Hierarchy (In-Memory Cost Management)
-
Create Time Dimension (In-Memory Cost Management)
-
Incremental Margin Load (In-Memory Cost Management)
-
Simulation Margin Load (In-Memory Cost Management)
Related Topics
In-Memory Cost Management Concurrent Programs
Selecting Search Criteria
The Profit Analysis dashboards open defaulting to:
-
Gross Profit Analysis defaults to cost type ACTUAL.
-
Impact on Gross Profit, defaults to a cost type you have access.
You can change the cost type to other types have access to, along with other parameters during your analysis.
Note: The cost type ACTUAL is a seeded cost type for profit analysis which has the actual values only. The values in ACTUAL are used to create the simulated values. The dashboard also enables you to select the cost type ACTUAL to look at the actual values.
To select search criteria in the Profit Analyzer dashboards
-
Navigate to the Gross Profit Analysis or Impact on Gross Profit dashboards.

-
Select values in the Search panel to change the information appearing on the dashboard. You can select multiple search parameters for each value. Choices are:
-
Simulation Cost Type
-
Organization Ledger
-
Fiscal Year (displays only on Gross Profit Analysis dashboard)
-
Fiscal Quarter (displays only on Gross Profit Analysis dashboard)
-
Period
-
Product
-
Sales Organization
-
Sales Channel
-
Sales Representative
-
Customer
-
-
Select Apply to reformat the information and change the values appearing in the panels.
Data does not display if the specified criteria does not have information for the selected value combination.
Viewing an Overview of Gross Profits
The Overview region of the Gross Profit Analyzer has six panels displaying actual data compared to simulated data. These panels include:
-
Profitability Summary of Margins and COGS for Sales Forecasts, Shipped Orders, and Unshipped Orders
-
Gross Margin by Period
-
Gross Margin by Sales Organization
-
Gross Margin by Sales Representative
-
Cost of Goods Sold for Planned Orders by Period
-
Gross Margin for Planned Orders by Period
All panels enable you to:
-
Refresh, print, export, or copy the data shown in a specific panel.
-
View data in either graph or table view.
-
Display both actual versus simulated data for the cost type selected.
Some of the panels also enable you to navigate to reports showing more detail on the values appearing on the graphs and tables.
To view an overview of gross profits
-
Navigate to the Gross Profit Analysis page, and select the Overview tabbed region.
-
You can select values in the Search panel to change variations and reformat the data appearing, see: Selecting Search Criteria
-
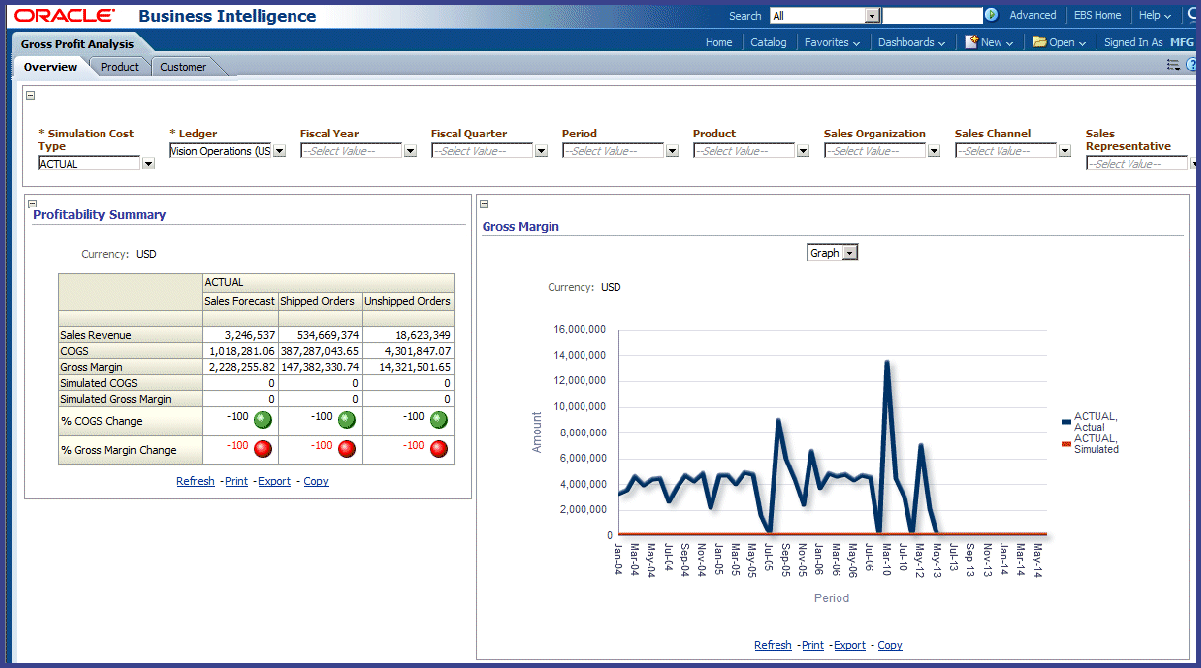
The Profitability Summary panel is a table view of orders in relationship to margin and COGS for the cost type selected. For sales forecasts, shipped, and unshipped orders you can view:
-
Sales Revenue
-
COGS and Gross Margin (both actual and simulated)
-
Percentage of Change for COGS and Gross Margin
The variation of changes appear in both a numerical and color-coded display.
-
-
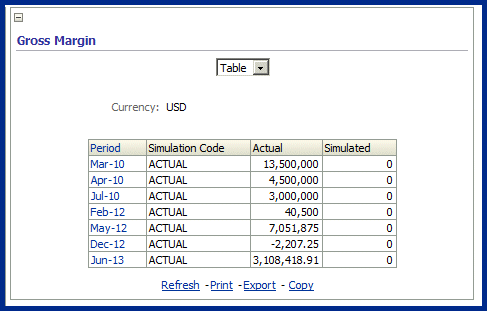
The Gross Margin by Period panel shows the amount per period of your organization's gross margin for the selected Fiscal Period.
-
Use the drop-down box to change the display between graph or table view, and back again. Select the table view.
Both views list the actual and simulated values for the fiscal periods, and other values used in your search criteria.
-
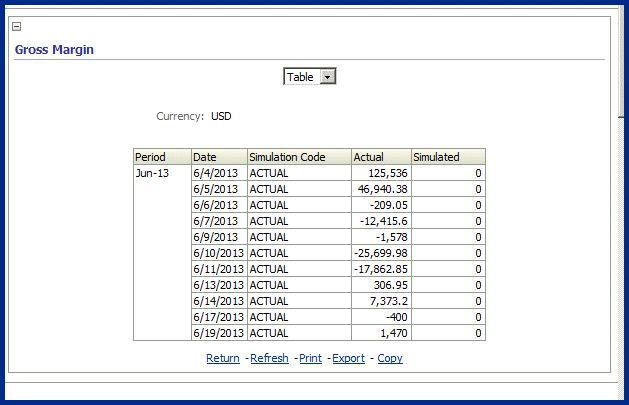
Select a particular period in the table to view daily variations of the month for the actual and simulated gross margins.
-
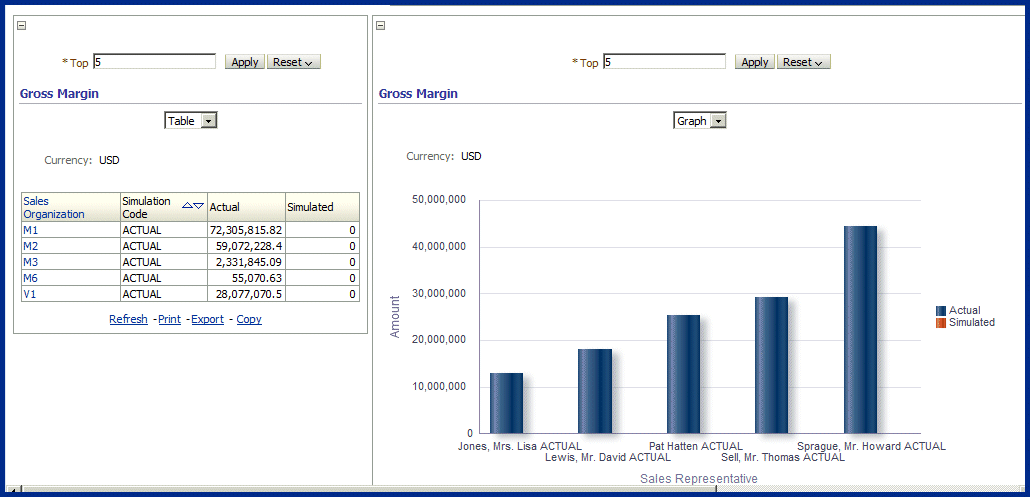
To see an overview of profitability by sales organization and sales representative, view the following panels:
-
The Gross Margin by Sales Organization panel shows the amount of sales for each organization selected in the search criteria.
-
The Gross Margin by Sales Representative panel shows the amount of sales earned by representatives selected in the search criteria.
-
-
Select the drop-down menu to display the data between a table or graph view, and back again.
-
To filter results for top grossing organizations and representatives, change the value in the Top box. Select Apply to see the results.
In the table view for the Gross Margin by Sales Organization panel, you can view individual organizations.
-
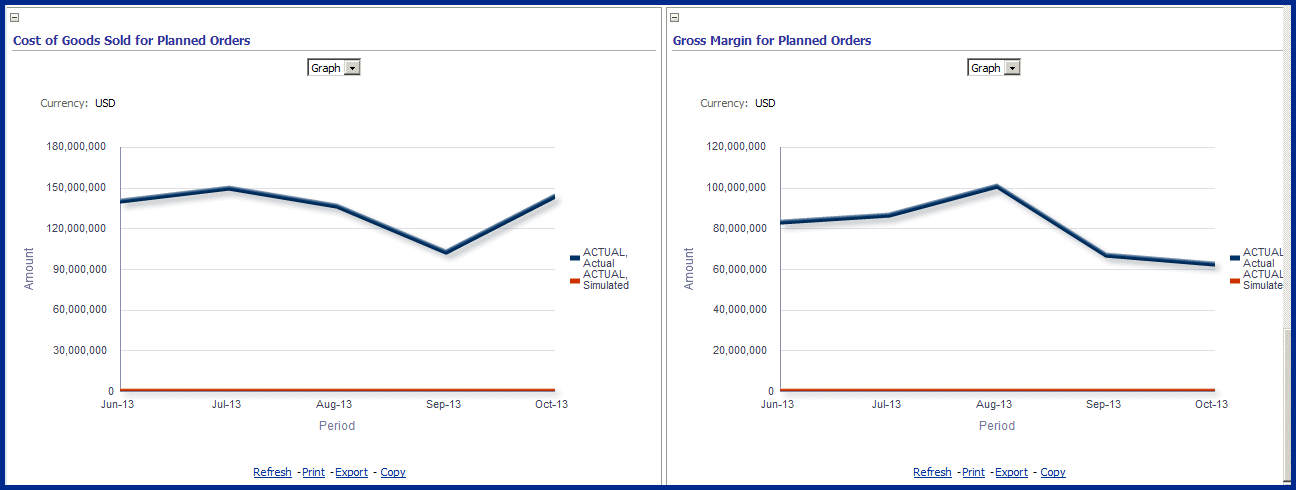
To see an overview of profitability for planned orders by period, view the following panels. These panels show the profitability of suggested order quantities for orders created by your planning and scheduling system:
-
The Cost of Goods Sold for Planned Orders by Period panel shows the COGS amount for orders planned per fiscal period selected in your search criteria.
-
The Gross Margin for Planned Orders by Period panel shows the gross margin for the orders planned for the fiscal periods selected in your search criteria.
-
-
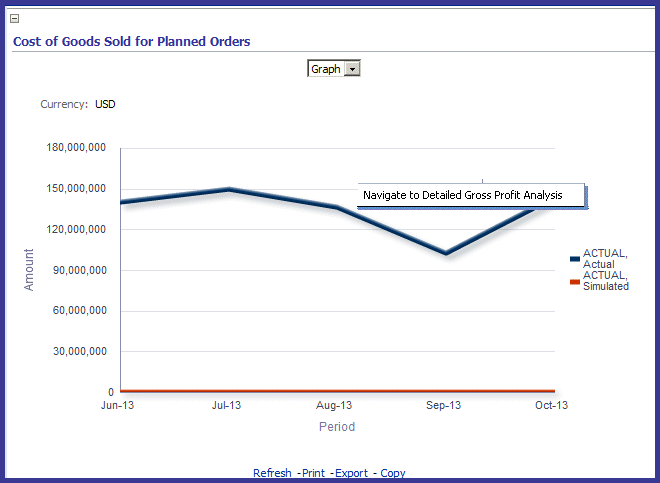
On the Cost of Goods Sold for Planned Orders by Period and the Gross Margin for Planned Orders by Period panels, you can navigate to detail reports by left-clicking your mouse in the following areas:
-
On the line in the graph view
-
Values in the Actual or Simulated columns in the table view
Note: Use mouse left-click to access the reports; mouse right-click displays OBIEE report settings and not the In-Memory Cost Management detail reports.
When you choose the appropriate method for the panel display, a link appears: Navigate to Detailed Gross Profit Analysis.
-
-
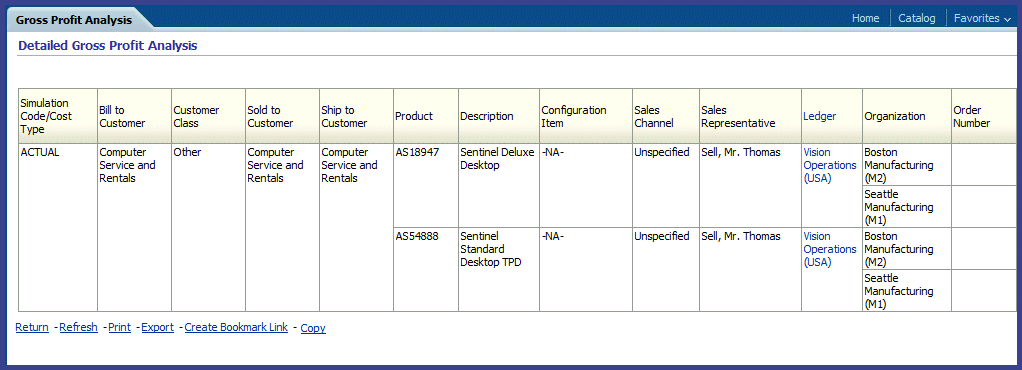
Select the link, and the Detailed Gross Profit Analysis report appears.
Viewing Gross Profit Products
The Product tabbed region of the Gross Profit Analyzer contains six panels showing the profitability of your organization's products including:
-
Cost of Goods Sold
-
Gross Margin
-
Cost of Goods Sold for Unshipped Orders
-
Gross Margin for Unshipped Orders
-
Cost of Goods Sold for Planned Orders
-
Gross Margin for Planned Orders
All panels enable you to:
-
Refresh, print, export, or copy the data shown in a specific panel.
-
View data in either graph or table view.
-
Display both actual versus simulated data for the cost type selected.
-
Navigate to reports showing more detail on the values appearing on the graphs and tables.
To view COGS and gross margins for products in the Gross Profit Analysis dashboard
-
Navigate to the Gross Profit Analysis page, and select the Product tabbed region.
Data displaying on the panels is for products selected according to your search criteria, see: Selecting Search Criteria
The overview summary panels show profitability for shipped orders only:
-
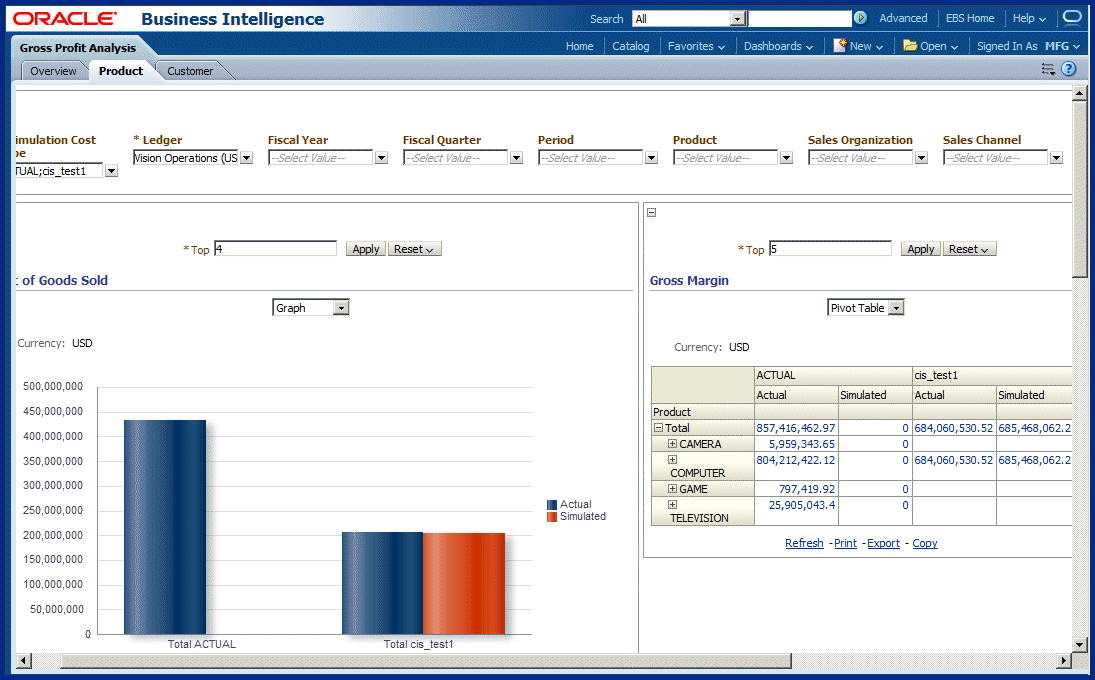
The Cost of Goods Sold panel shows the profitability of selected products in your search criteria.
-
The Gross Margin panel shows the profitability of the difference between total revenue and the cost of goods sold of selected products in your search criteria.
-
-
To filter results for most profitable products, change the value in the Top box. Select Apply to see the results.
-
Use the drop-down box to change the display from a graph or a pivot table, and back again.
The pivot table view shows the actual and simulated COGS or gross margin in a row for the total amount.
-
Expand the Total column to display the actual and simulated amount of the next level of the product hierarchy.
-
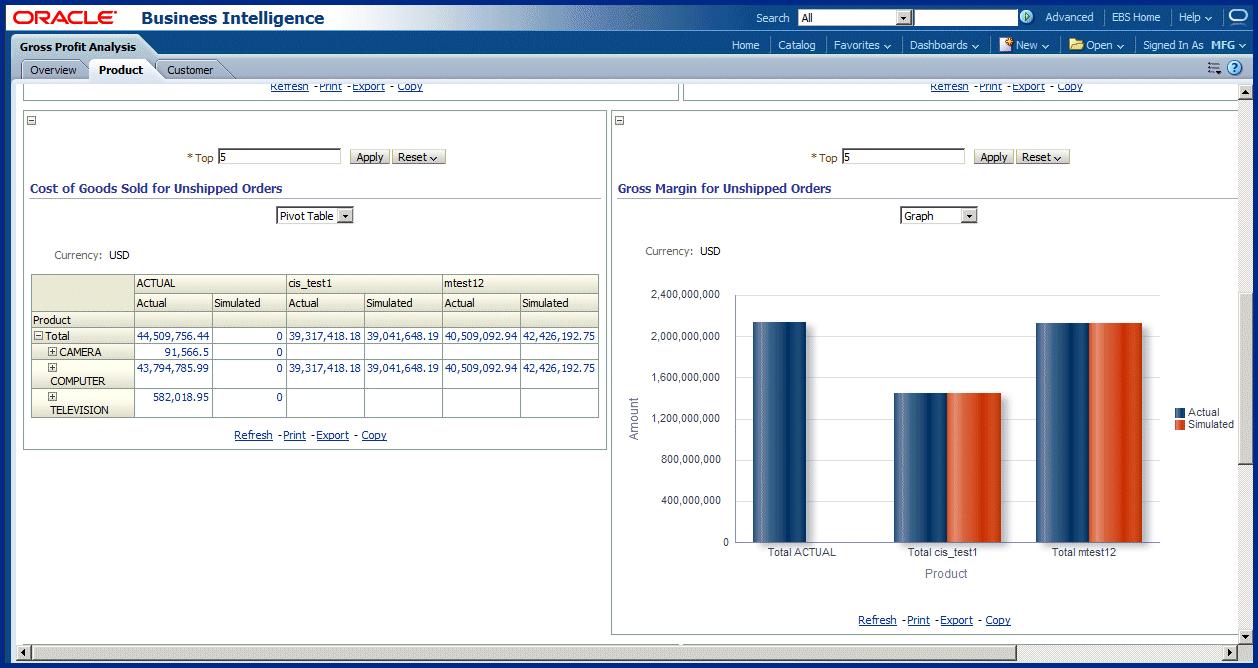
In the Unshipped Orders region, Gross Profit Analysis dashboard, two panels show COGS and gross margins for unshipped orders:
-
Cost of Goods Sold for Unshipped Orders shows the income of products for orders booked but not yet shipped.
-
Gross Margin for Unshipped Orders shows the difference between revenue and COGS of products for orders booked but not yet shipped.
-
-
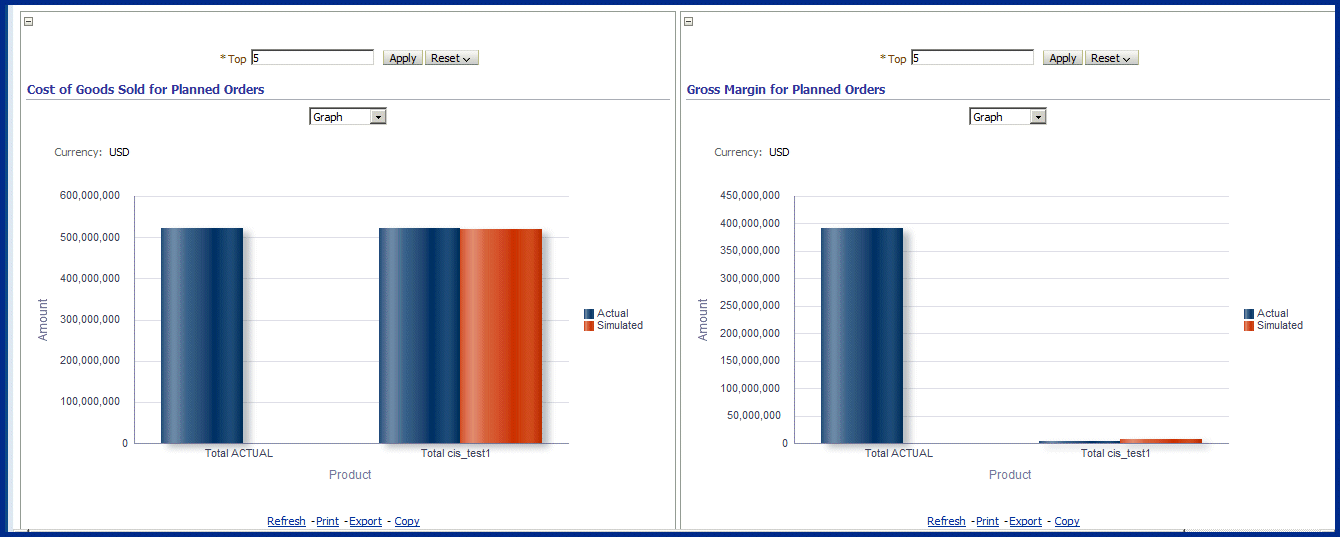
To see an overview of profitability for planned orders by product, view the following panels. These panels show the profitability of suggested order quantities for orders created by your planning and scheduling system.
-
The Cost of Goods Sold for Planned Orders by Product panel shows the COGS amount for the orders planned for products selected in your search criteria.
-
The Gross Margin for Planned Orders by Product panel shows the gross margin for the orders planned for products selected in your search criteria.
-
To navigate to detail reports
-
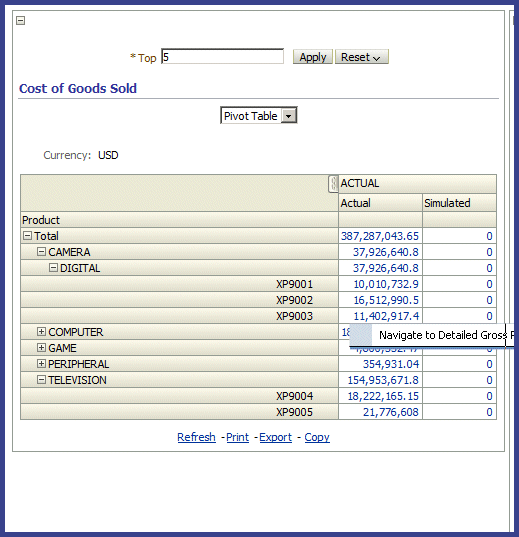
On any of the panels, navigate to detail reports by left-clicking your mouse in the following areas:
-
On the line in the graph view
-
Values in the Actual or Simulated columns in the table view
Note: Use mouse left-click to access the reports; mouse right-click displays OBIEE report settings and not the In-Memory Cost Management detail reports.
When you choose the appropriate method for the panel display, a link appears: Navigate to Detailed Gross Profit Analysis.
-
-
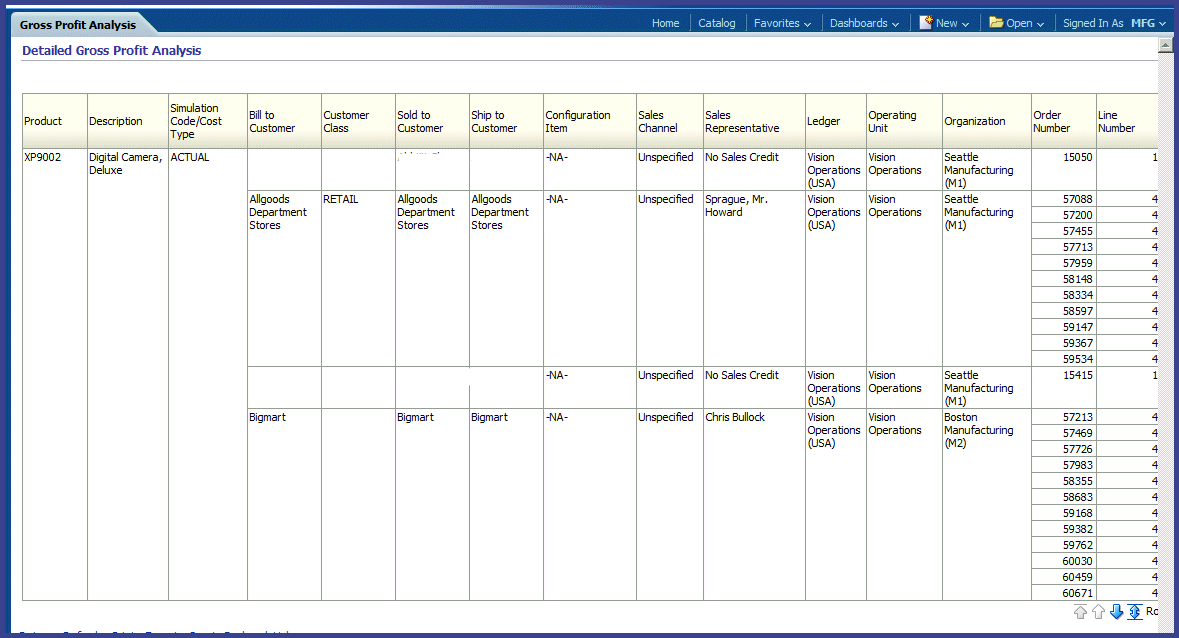
Select the link, and the Detailed Gross Profit Analysis report appears.
Viewing Gross Profit Customers
The Customer region of the Gross Profit Analyzer has six panels displaying actual values compared to simulated data of your gross profits and COGS for your customers. These panels include:
-
Cost of Goods Sold
-
Gross Margin
-
Cost of Goods Sold for Unplanned Unshipped Orders
-
Gross Margin for Unshipped Orders
-
Cost of Goods Sold for Planned Orders
-
Gross Margin for Planned Orders
All panels enable you to:
-
Refresh, print, export, or copy the data shown in a specific panel.
-
View data in either graph or table view.
-
Display both actual versus simulated data for the cost type selected.
-
Navigate to reports showing more detail on the values appearing on the graphs and tables.
To view gross profits and margins for customers
-
Navigate to the Gross Profit Analysis page, and select the Customer tabbed region.
-
You can select values in the Search panel to change variations and reformat the data appearing, see: Selecting Search Criteria
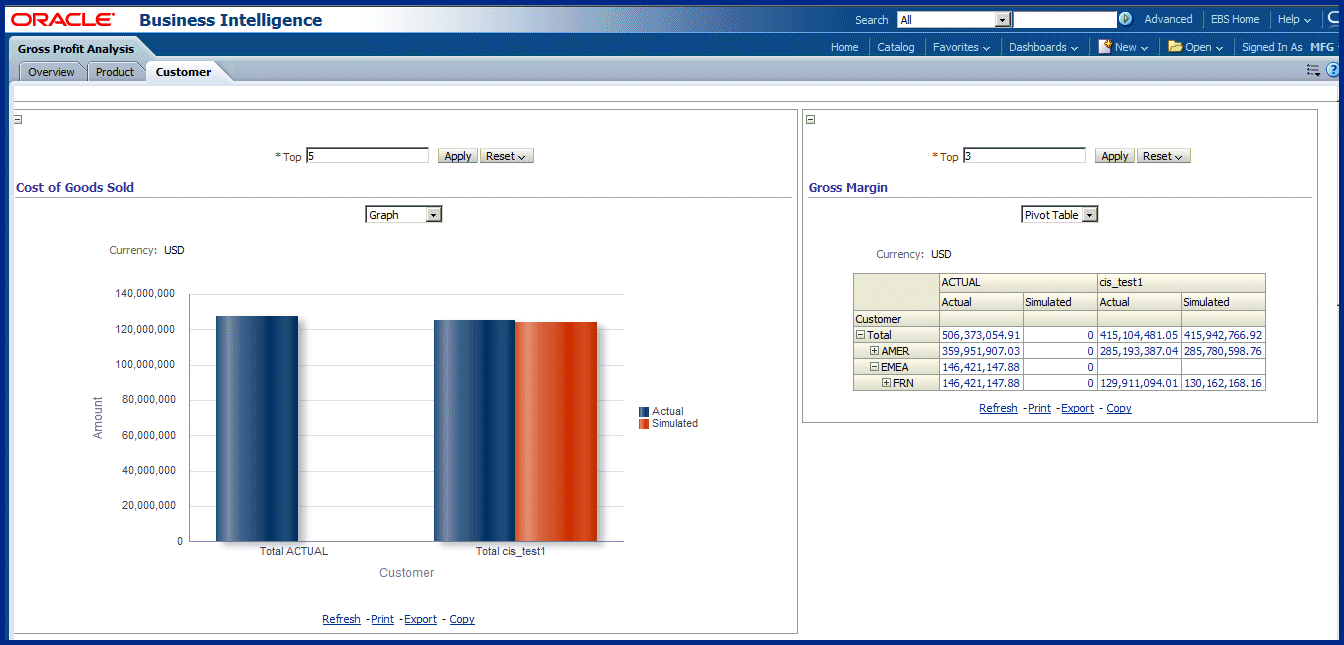
The overview summary panels show the profitability for shipped orders only:
-
The Cost of Goods Sold panel shows the profitability of selected customers in your search criteria.
-
The Gross Margin panel shows the profitability of the difference between total revenue and the cost of goods sold of selected customers in your search criteria.
-
-
To filter results for the most profitable customers, change the value in the Top box. Select Apply to see the results.
-
Use the drop-down box to change the display from a graph or a pivot table, and back again.
The pivot table view shows the actual and simulated COGS or gross margin in a row for the total amount.
-
Expand the Total column to display the actual and simulated amount of the next level of the customer hierarchy.
-
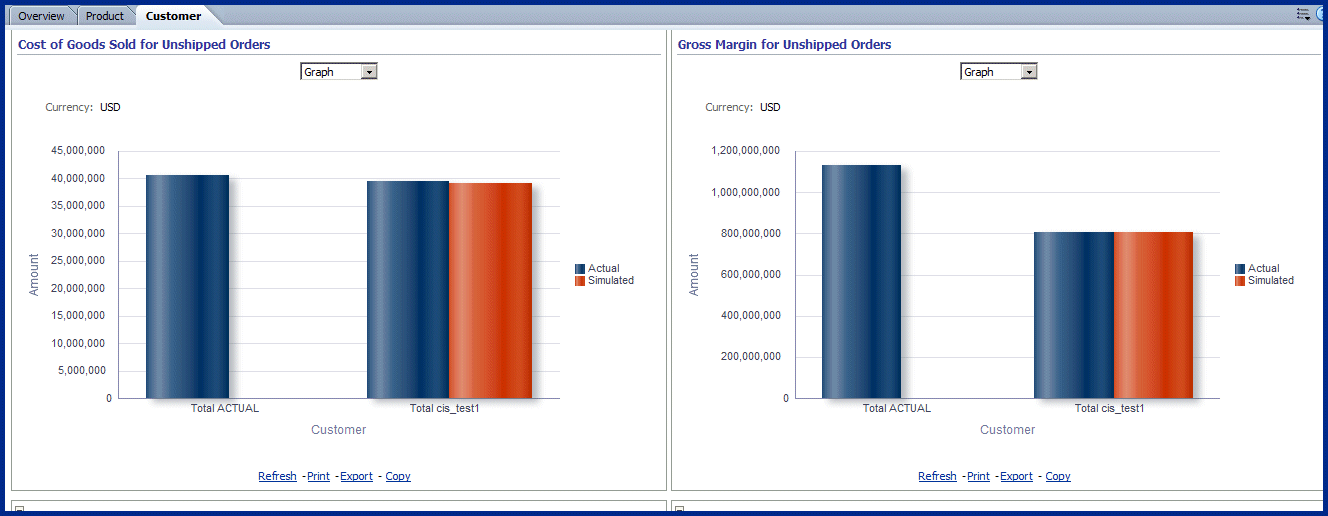
In the Unshipped Orders region, two panels show COGS and gross margins for unshipped orders in the Gross Profit Analysis dashboard:
-
Cost of Goods Sold for Unshipped Orders shows the income per customer for orders booked but not yet shipped.
-
Gross Margin for Unshipped Orders shows the difference between revenue and COGS per customer for orders booked but not yet shipped.
-
-
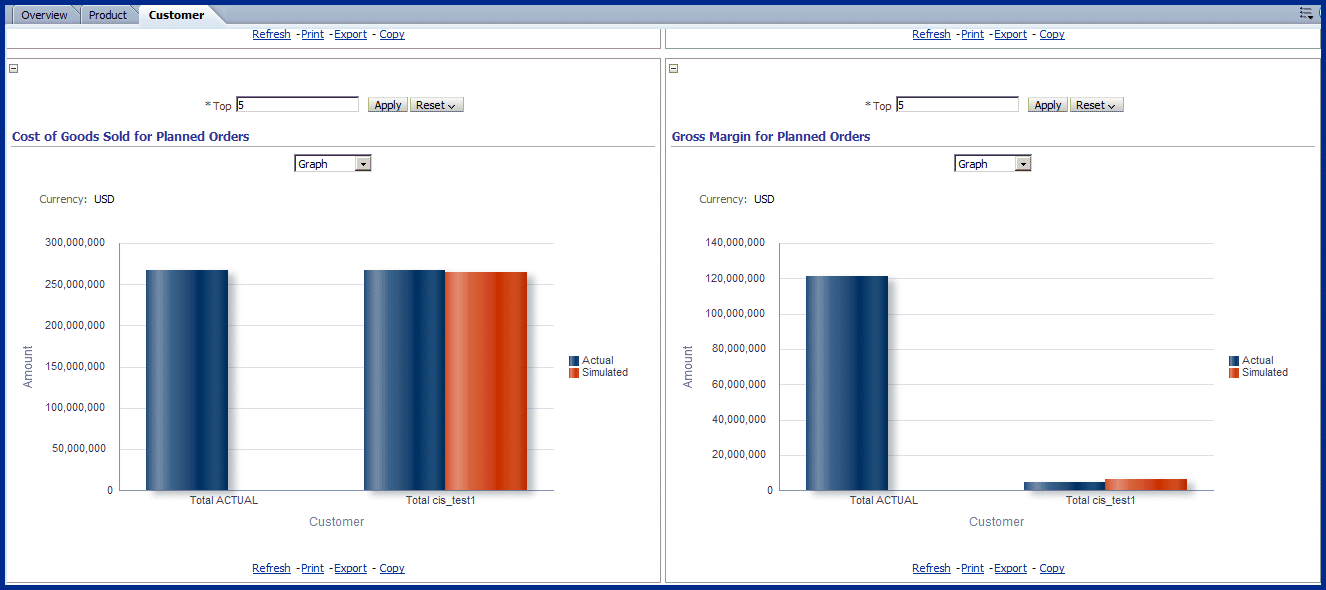
To see an overview of profitability for planned orders by customer, view the following panels. These panels show the profitability of suggested order quantities for orders created by your planning and scheduling system.
-
Cost of Goods Sold for Planned Orders by Customer panel shows the COGS amount for the orders planned for customers selected in your search criteria.
-
Gross Margin for Planned Orders by Customer panel shows the gross margin for the orders planned for customers selected in your search criteria.
-
To navigate to detail reports
-
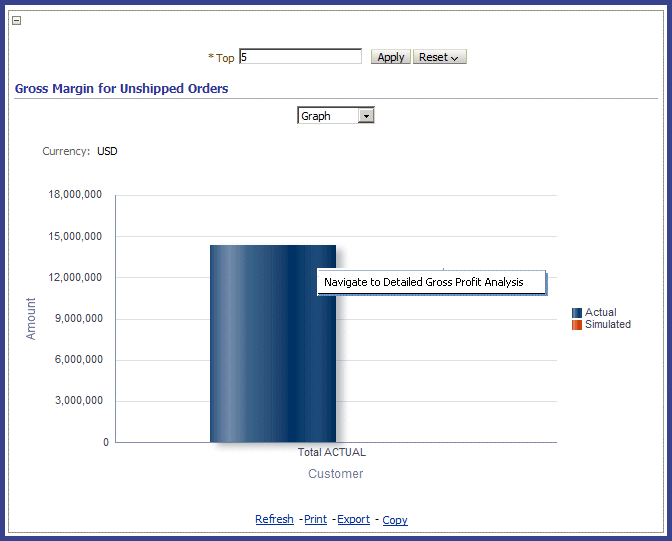
On any of the panels, navigate to detail reports by left-clicking your mouse in the following areas:
-
On the line in the graph view
-
Values in the Actual or Simulated columns in the table view
Note: Use mouse left-click to access the reports; mouse right-click displays OBIEE report settings and not the In-Memory Cost Management detail reports.
When you choose the appropriate method for the panel display, a link appears: Navigate to Detailed Gross Profit Analysis.
-
-
Select the link, and the Detailed Gross Profit Analysis report appears.

Viewing Impacts on Gross Profit
The Impact on Gross Profit dashboard shows the results of a previous simulation performed. You can change the display to other simulations by selecting a Simulation Code value in the search region. The dashboard consists of 6 panels showing:
-
Cost of Goods Sold by Product
-
Gross Margin by Product
-
Gross Margin for Unshipped Orders by Product
-
Gross Margin for Unshipped Orders by Customer
-
Cost of Goods Sold for Planned Orders by Period
-
Gross Margin for Planned Orders by Period
All of the panels enable you to:
-
Refresh, print, export, or copy the data shown in a specific panel.
-
View data in either graph or table view.
-
Display both actual versus simulated data for the cost type selected.
To view impacts on gross profits
-
Navigate to the Impact on the Gross Profit dashboard.
The initial view defaults to a simulation in which you have access. The Simulation Code field value and any of the other search parameters can be changed in the Search panel to reformat the data appearing, see: Selecting Search Criteria
-
In the COGS and Gross Margin for shipped orders panels you can see the:
-
The Cost of Goods Sold by Product panel shows the profitability of selected products in your search criteria.
-
The Gross Margin by Product panel shows the profitability of the difference between total revenue and the cost of goods sold of selected products in your search criteria.
-
-
In the COGS and Gross Margin for unshipped orders panels:
-
The Cost of Goods Sold for Unshipped Orders shows the income of products for orders booked but not yet shipped.
-
The Gross Margin for Unshipped Orders shows the difference between revenue and COGS per customer for orders booked but not yet shipped.
See: Viewing Gross Profit Products - and Viewing Gross Profit Customers
-
-
In the COGS and Gross Margin for planned orders panels:
-
The Cost of Goods Sold for Planned Orders by Period panel shows the COGS amount for orders planned per fiscal period selected in your search criteria.
-
The Gross Margin for Planned Orders by Period panel shows the gross margin for the orders planned for the fiscal periods selected in your search criteria.
-