| C H A P T E R 7 |
|
System Monitoring and Alert Management |
The system monitoring features in ILOM enable you to proactively monitor the health of your system. The alert management features in ILOM enable you to receive advance notice of events occurring on your system. You can view and manage the system monitoring and alert management features in ILOM from either the ILOM web interface or command-line interface (CLI).
This chapter includes the following topics:
The system monitoring features in ILOM enable you to easily determine the health of the system and to detect errors, at a glance, when they occur. For instance, in ILOM you can:
All Sun server platforms are equipped with a number of sensors that measure voltage, temperatures, fan speeds, and other attributes about the system. Each sensor in ILOM contains nine properties describing various settings related to a sensor such as sensor type, sensor class, sensor value, as well as the sensor values for upper and lower thresholds.
ILOM regularly polls the sensors in the system and reports any events it encounters about sensor state changes or sensor threshold crossings to the ILOM event log. Additionally, if an alert rule was enabled in the system that matched the crossing threshold level, ILOM would automatically generate an alert message to the alert destination defined.
In the ILOM web interface, you can obtain instantaneous sensor readings about system FRUs (field-replaceable units) or other system inventory on the System Monitoring --> Sensor Readings page.
FIGURE 7-1 Sensor Readings Page
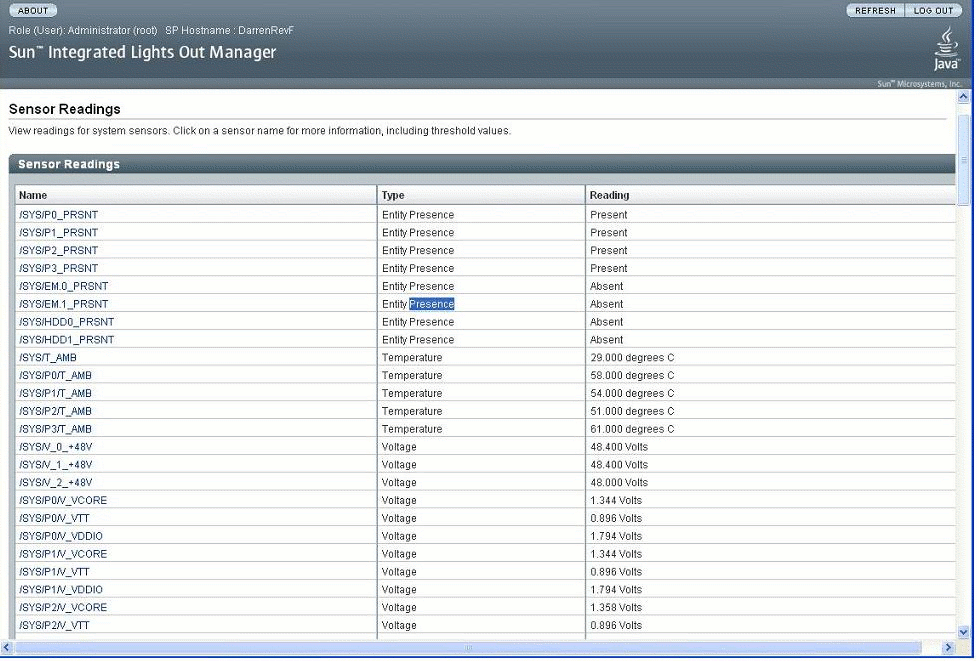
The Sensor Readings page lists the readings for each sensor by name, type, and reading. For further information about a threshold sensor, click a threshold sensor name on the page to view other threshold properties. For example, if you clicked the threshold sensor name /SYS/T_AMB, the following dialog appears displaying additional information about this sensor.
FIGURE 7-2 Sensor Properties Dialog for/SYS/T_AMB
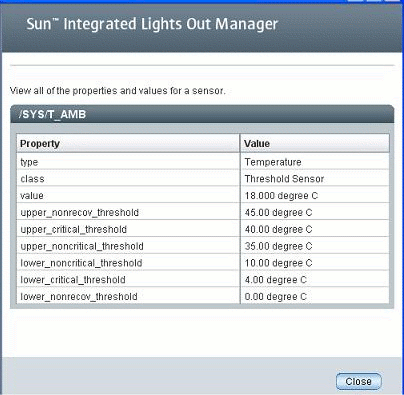
For more information about how to obtain sensor readings from the ILOM web interface, see Determine the State of Indicators Using the Web Interface.
In the ILOM CLI, you can obtain instantaneous sensor readings about system FRUs and other system inventory within the /SYS or /CH namespace. Both of these namespaces support two classes of sensor readings that you can access. These classes are known as Threshold Sensor Readings and Discrete Sensor Readings. A brief summary describing both of these classes follows.
Threshold sensors provide a sensor property value, as well as upper and lower non-critical and critical predefined thresholds. Threshold sensors typically include temperature readings, voltage readings, or fan readings.
To obtain sensor readings using the ILOM CLI, you must use the cd command to navigate to the sensor target then use the show command to display the sensor properties.
For example, on some server platforms, you can specify the following path to obtain a temperature reading of a server’s intake:
cd /SYS/T_AMB
show
The properties describing the sensor target appear. For example:
For specific details about the type of threshold sensor targets you can access, as well as the paths to access them, consult the user documentation provided with the Sun server platform.
Discrete sensors offer a set of well-defined values associated with the sensor target. Discrete sensors typically provide information about an entity presence, entity fault, or a power supply state.
To obtain a discrete sensor reading using the ILOM CLI, you must use the cd command to navigate to the sensor target then use the show command to display the target properties. For example, on some Sun server platforms, you can determine whether a hard disk drive is present in slot 0 by specifying the following path:
cd /SYS/HDD0_PRSNT
show
The properties describing the discrete sensor target appear. For example:
For specific details about the type of discrete sensor targets you can access, as well as the paths to access them, consult the user documentation provided with the Sun server platform.
Power Monitoring interfaces enable monitoring of real-time power consumption. The service processor (SP) or individual power supply can be polled at any instance to retrieve and report data with accuracy to within one minute of the time the power usage occurred.
You can monitor available power, actual power, and permitted power. Available power is the maximum power that a system is capable of consuming. By default, this is a sum of the maximum power that each processor, I/O module, memory module, and other components is capable of consuming or the maximum power that the power supplies in the system can draw. Some systems may be able to guarantee a lower maximum consumption than the available power at any instant in time. This guaranteed maximum is referred to as permitted power.
Actual power consumption can be monitored for individual power supplies or for all power supplies in a chassis or rack. Actual power consumption can be measured on rackmounted servers, server modules (blade servers), and chassis monitoring modules (CMMs).
Power Monitoring interfaces enable you to perform the following tasks:
TABLE 7-1 defines the terminology used in power monitoring.
System indicator LEDs are generally illuminated on the system by ILOM based on the Sun server platform policy. Typically the system indicator LEDs are illuminated by ILOM when any of the following conditions occur:
You can view the states of system indictors from the ILOM web interface or the ILOM CLI. Additionally, in some instances, you might be able to modify the state of a system indicator.
ILOM supports the following system indicator states:
ILOM supports two types of system indicator states: Customer Changeable and System Assigned.
For more information about viewing and managing system indicators from the ILOM web interface or CLI, see View and Manage Indicators Using the Web Interface or View and Manage Indicators Using the CLI.
In the ILOM web interface, you view and manage system indicators on the Indicators page. This page lists the system indicators by name and status. System indicators offering customer changeable states appear with a radio button. To modify a customer changeable indicator state, select the radio button then select a state from the Actions drop-down list.
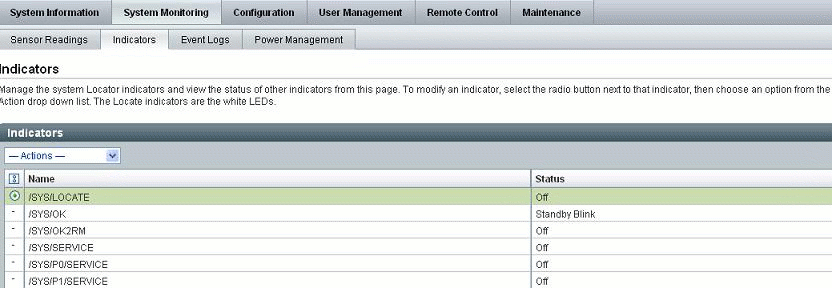
For more information about how to obtain instantaneous sensor readings using the ILOM web interface, see Obtain Sensor Readings Using the Web Interface.
In the ILOM CLI, all system indicators are accessible in the /SYS or /CH namespace. Typically you will use the cd command to navigate to the system indicator target then the show command to view the target’s properties. You can change the state of a system indicator by using the set command. The set command is only supported for system indicators offering a customer changeable state. To determine whether you can change the state of a system indicator, use the cd command to navigate to the indicator target, then use the show command to view the system indicator properties. For example:
cd /SYS/indicator_target or cd /CH/indicator_target
show
Targets, properties, and commands associated with the system indicator appear, for example:
If the set command appears in the Commands list, you can modify the state of the system indicator. To modify the state of the system indictor, use the following syntax:
For more information about which system indicators are supported on your system, and the paths for accessing them, consult the user documentation provided with the Sun server platform.
The ILOM event log enables you to view information about any event that occurred on the system. Some of these events can include ILOM configuration changes, software events, warnings, alerts, component failure, as well as IPMI events. The type of events recorded in the ILOM event log is determined by the Sun server platform. For specific information about which events are recorded in the ILOM event log, consult the user documentation provided with the Sun server platform.
You can view and manage the ILOM event log from either the ILOM web interface or CLI. For more information about how to view and manage the ILOM event log, see View or Clear the ILOM Event Log Using the Web Interface or View or Clear the ILOM Event Log Using the CLI.
FIGURE 7-4 ILOM Event Log Example
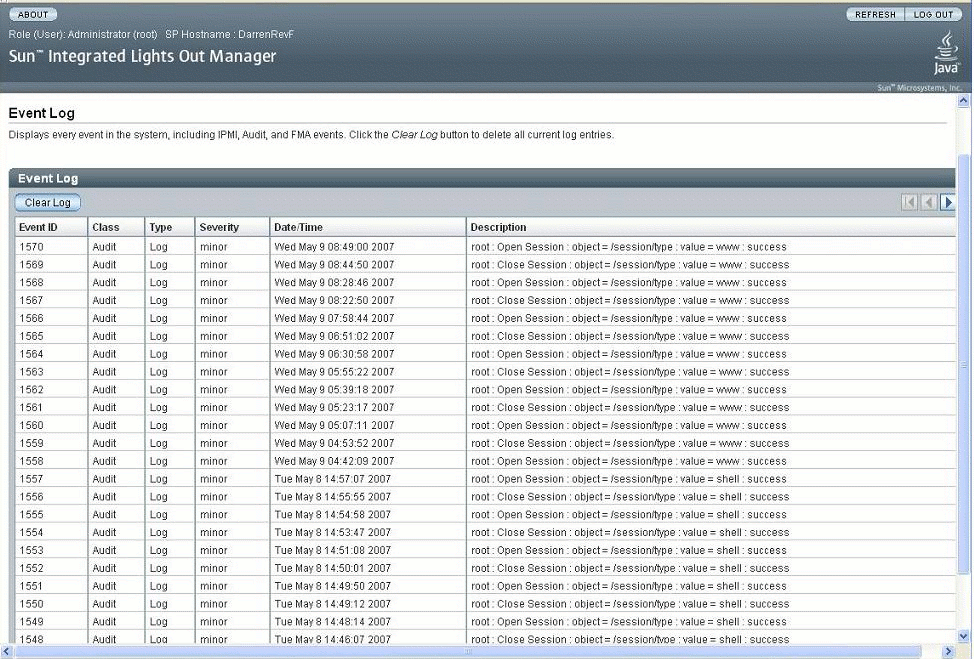
ILOM captures timestamps in the event log based on the host server UTC/GMT timezone. However, if you view the event log from a client system that is located in a different timezone, the timestamps are automatically adjusted to the timezone of the client system. Therefore, a single event in the ILOM event log might appear with two timestamps.
In ILOM, you can choose to manually configure the ILOM clock based on the UTC/GMT timezone of the host server, or you can choose to synchronize the ILOM clock with other systems on your network by configuring the ILOM clock with an NTP server IP address.
You can view or set the ILOM clock settings in the ILOM web interface on the Configuration --> Clock Settings page.
FIGURE 7-5 Clock Settings Page
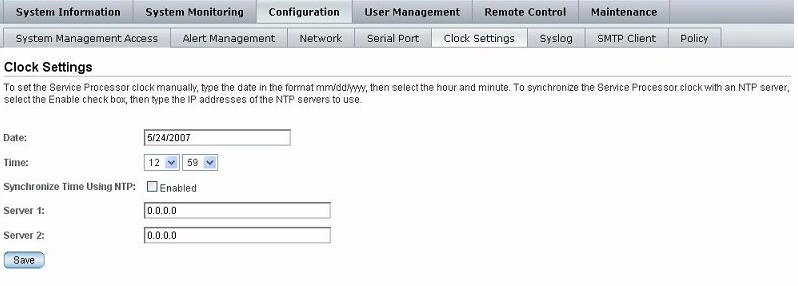
For more information about how to view and set clock settings from the ILOM web interface, see View and Configure Clock Settings Using the Web Interface.
You can view the ILOM clock settings from the ILOM CLI by using the show command. For example, on some server platforms, you can display the clock setting by specifying the following path:
show /SP/clock
You can manually configure the ILOM clock setting from the CLI using the following set command syntax:
set target property_name=value
You can also, in the ILOM CLI, configure the ILOM clock settings to synchronize with other systems on your network by setting an IP address of an NTP server. For example, on some Sun server platforms, you could type the following path to set the IP address of an NTP server, and then enable NTP synchronization.
set /SP/clients/ntp/server/1 address=ip_address
set /SP/clock usentpserver=enabled
For more information about how to configure the ILOM clock settings from the ILOM CLI, consult the user documentation provided with the Sun server platform.
In addition, consult your Sun server platform user documentation for platform specific clock information about whether:
Syslog is a standard logging facility used in many environments. Syslog defines a common set of features for logging events and also a protocol for transmitting events to a remote log host. You can use syslog to combine events from multiple instances of ILOM within a single place. The log entry contains all the same information that you would see in the local ILOM event log, including class, type, severity, and description. For information about configuring ILOM to send syslog to one or two IP addresses, see Configure Remote Syslog Receiver IP Addresses Using the Web Interface or Configure Remote Syslog Receiver IP Addresses Using the CLI.
Most Sun server platforms include the fault management software feature in ILOM. This feature enables you to proactively monitor the health of your system hardware, as well as diagnose hardware failures as they occur. In addition to monitoring the system hardware, the fault management software monitors environmental conditions and reports when the system's environment is outside acceptable parameters. Various sensors on the system components are continuously monitored. When a problem is detected, the fault management software automatically:
You can view the status of faulted components from the ILOM web interface or ILOM CLI. For more information, see:
The type of system components and environmental conditions monitored by the fault management software are determined by the Sun server platform. For more details about which components are monitored by the fault management software, consult the user documentation provided with the Sun server platform.
In the ILOM web interface, you can view the system components currently in a fault state using the Fault Management page.
FIGURE 7-6 Fault Management Page Example

The Fault Management page lists faulted components by ID, FRU, and TimeStamp. You can access additional information about the faulted component by clicking the faulted component ID. For example, if you clicked the faulted component ID 0(CH/PS3/EXTERNAL/AC_INPUT), the following dialog appears displaying additional details about the faulted component.

Alternatively, in the ILOM web interface, you can identify the fault status of a component on the Component Management page.
FIGURE 7-7 Component Management Page - Fault Status

For more information about the ILOM fault management features offered on you system, consult the user documentation provided with the Sun server platform.
In the ILOM CLI, you can view the fault status of component(s) by using the show command. For example, depending on the Sun server platform, you can specify one of the following paths:
show /SP/faultmgmt
show /CH/faultmgmt
In addition, the alias, show faulty, is a shortcut for the following ILOM command-line interface (CLI) command string:
-> show -o table -level all /SP/faultmgmt
The alias produces the same output as the above command. Thus, it enables you to view all active faults in the system in a concise, tabular form. For example, it produces output similar to the folllowing:
Target           | Property    | Value
-----------------+-------------+-------------------
/SP/faultmgmt/0  | fru         | /SYS/MB
/SP/faultmgmt/0  | timestamp   | Jan 16 12:53:00
/SP/faultmgmt/0/ | sunw-msg-id | NXGE-8000-0U
faults/0         |             |
/SP/faultmgmt/0/ | uuid        | e19f07a5-580e-4ea0-ed6a-f663aa61
faults/0         |             | 54d5
/SP/faultmgmt/0/ | timestamp   | Jan 16 12:53:00
faults/0         |             |
For more information about the ILOM fault management features offered on your system, consult the user documentation provided with the Sun server platform.
| Note - The Service Snapshot utility is supported only on x64-based systems running ILOM 2.x. The Service Snapshot utility is not supported on SPARC-based systems running ILOM 2.x. |
The ILOM Service Snapshot utility gathers SP state data. The utility collects log files, runs various commands and collects their output, and sends the data collection as a downloaded file to a user-defined location.
This utility enables you to produce a snapshot of the SP at any instant in time and you can run the utility using either the ILOM command-line interface (CLI) or the ILOM web interface. The CLI and web interface procedures follow.
You can access the ILOM Service Snapshot utility from either the web interface or the CLI. For more information, see:
Refer to the following procedures to monitor system sensors, system indicators, as well as events in the ILOM event log.
|
This interface enables you to view the total power that is pulled into the system’s power supplies from an external source. This is the power that the customer pays for. The power source can be either AC or DC.
The Power Consumption sensor supports the show command.
To view total power consumption using the CLI, follow these steps:
1. Log in to the ILOM CLI as Administrator.
2. Type the show command to display the total power consumption.
-> show /SYS/VPS
-> show /SYS/VPS property
TABLE 7-2 lists and describes the properties of the Total Power Consumption sensor for the CLI.
| Note - All platforms support the /SYS/VSP sensor to report power consumption. However, the threshold properties are platform specific. Your system might not support all the thresholds listed in TABLE 7-2 for this sensor. Therefore, some platforms might not receive an event if an usupported threshold is crossed. Refer to your platform ILOM Supplement for your platform-specific information. |
In addition to the properties listed in TABLE 7-2, the total power consumption property actual_power can be accessed using the /SP/powermgmt target using the show command. The actual_power property is the same as /SYS/VPS in that /SYS/VPS is a sensor that has a threshold and actual_power is just the value returned by the sensor.
|
To use the actual_power property to view total power consumption using the CLI, follow these steps:
1. Log in to the ILOM CLI as Administrator.
2. Type the show command to display the total power consumption.
-> show /SP/powermgmt actual_power
|
This interface enables you to access any raw sensors that measure voltage or current drawn by an individual power supply. In addition, virtual sensors that represent the power supply "input power" (power consumed from an external AC or DC source) and "output power" (power drawn by the system’s components) can be accessed.
For the CLI, each power supply contains the following sensors:
All sensors support the show command.
To monitor total power consumption per power supply using the CLI, follow these steps:
1. Log in to the ILOM CLI as Administrator.
2. Type the show command to display the total power consumption. For example:
-> show /SYS/PS1 INPUT_POWER|OUTPUT_POWER (for CLI on rackmounted systems)
-> show /CH/PS1 INPUT_POWER|OUTPUT_POWER (for CLI on CMM)
TABLE 7-3 lists and describes the properties of the CLI sensors. Both sensors, INPUT_POWER and OUTPUT_POWER, have the same properties.
|
This interface enables you to view available power. On a server module, this is the amount of power guaranteed available to the server module by the chassis.
The system contains one property: available_power. The property supports the show command and returns the value <input available power in watts>.
To view total available power using the CLI, follow these steps:
1. Log in to the ILOM CLI as Administrator.
2. Type the show command to display the available power.
-> show /SP/powermgmt available_power (for rackmounted systems)
-> show /CMM/powermgmt available_power (for CMM)
|
This interface enables you to view permitted power consumption. The permitted power consumption is the maximum input power the server guarantees it will consume at any instant. This value cannot be changed directly, but can change based on the power policy and budget, and chassis available power.
The system contains one property: permitted_power. This property supports the show command and returns the value <maximum permitted power consumption in watts>.
To monitor permitted power consumptions using the CLI, follow these steps:
1. Log in to the ILOM CLI as Administrator.
2. Type the show command to display the permitted power consumption.
-> show /SP/powermgmt permitted_power (for rackmounted systems)
-> show /CMM/powermgmt permitted_power (for CMM)
|
Follow these steps to determine the state of system indicators from the ILOM web interface:
1. Open a web browser and type the IP address of the server SP or CMM.
The Login page for the ILOM web interface appears.
2. In the ILOM Login page, enter a user name and password then click OK.
The ILOM web interface appears.
3. In the web interface page, select System Monitoring --> Indicators.
| Note - If the server is powered off, many indicators will appear as “no reading.” |
4. In the Indicators page, do the following:
a. Locate the name of the indicator you want to view.
b. To toggle the state of an indicator, click the radio button associated with the indicator that you want to toggle, then click the Actions drop-down list box and select either Turn LED Off or Set LED to Fast Blink.
A dialog appears prompting you to confirm the change.
c. Click OK to confirm the change.
|
Follow these steps to obtain sensor readings from the ILOM web interface:
1. Open a web browser and type the IP address of the server SP or CMM.
The Login page for the ILOM web interface appears.
2. In the ILOM Login page, enter a user name and password then click OK.
The ILOM web interface appears.
3. In the web interface page, click System Monitoring --> Sensors Readings.
The Sensor Readings page appears.
| Note - If the server is powered off, many components will appear as “no reading.” |
4. In the Sensor Readings page, do the following:
a. Locate the name of the sensor you want to view.
b. Click the name of the sensor to view the property values associated with that sensor.
For specific details about the type of discrete sensor targets you can access, as well as the paths to access them, consult the user documentation provided with the Sun server platform.
|
Follow these steps to view or clear events in the ILOM event log using the ILOM web interface:
1. Open a web browser and type the IP address of the server SP or CMM.
The Login page for the ILOM web interface appears.
2. In the ILOM Login page, enter a user name and password then click OK.
The ILOM web interface appears.
3. In the web interface page, select System Monitoring --> Event Logs.
4. In the Event Log page, perform any of the following:
Note that selecting a larger number of entries might cause the web interface to respond slower than selecting a smaller number of entries.
|
Follow these steps to view or clear events in the system event log using the ILOM CLI:
1. Establish a local serial console connection or SSH connection to the server SP or CMM:
Attach a serial console to the serial port on the server or CMM.
For more information, consult the user documentation provided with the Sun server platform.
Establish a Secure Shell connection to the server SP or CMM.
From the remote client, establish a secure connection as root to the server SP or active CMM.
For example , you can establish a secure connection from a remote SSH client to the server SP by typing the following:
The default command prompt appears (->).
2. Type one of the following command paths to set the working directory:
3. Type the following command path to display the event log list.
The contents of the event log appears. An example follows.

4. In the event log, perform any of the following tasks:
A confirmation message appears.
|
You need the IP address of your NTP servers to complete this procedure.
1. Open a web browser and type the IP address of the server SP or CMM.
The Login page for the ILOM web interface appears.
2. In the ILOM Login page, enter a user name and password then click OK.
The ILOM web interface appears.
3. In the web interface page, click Configuration --> Clock Settings.
The Clock Settings page appears.
4. In the clock settings page, do one of the following:
a. In the Date text box, type the date in the format mm/dd/yy.
b. In the Time drop-down list boxes, set the hour and minutes.
a. Select the Enabled check box next to Synchronize Time Using NTP.
b. In the Server 1 text box, type the IP address of the primary NTP server you want to use.
c. (Optional) In the Server 2 text box, type the IP address of the secondary NTP server you want to use.
5. Click Save for your changes to take effect.
|
Follow these steps to configure a remote syslog receiver IP address in ILOM using the web interface.
1. Open a web browser and type the IP address of the server SP or CMM.
The Login page for the ILOM web interface appears.
2. In the ILOM Login page, enter a user name and password then click OK.
The ILOM web interface appears.
3. In the ILOM web interface, select Configuration --> Syslog.
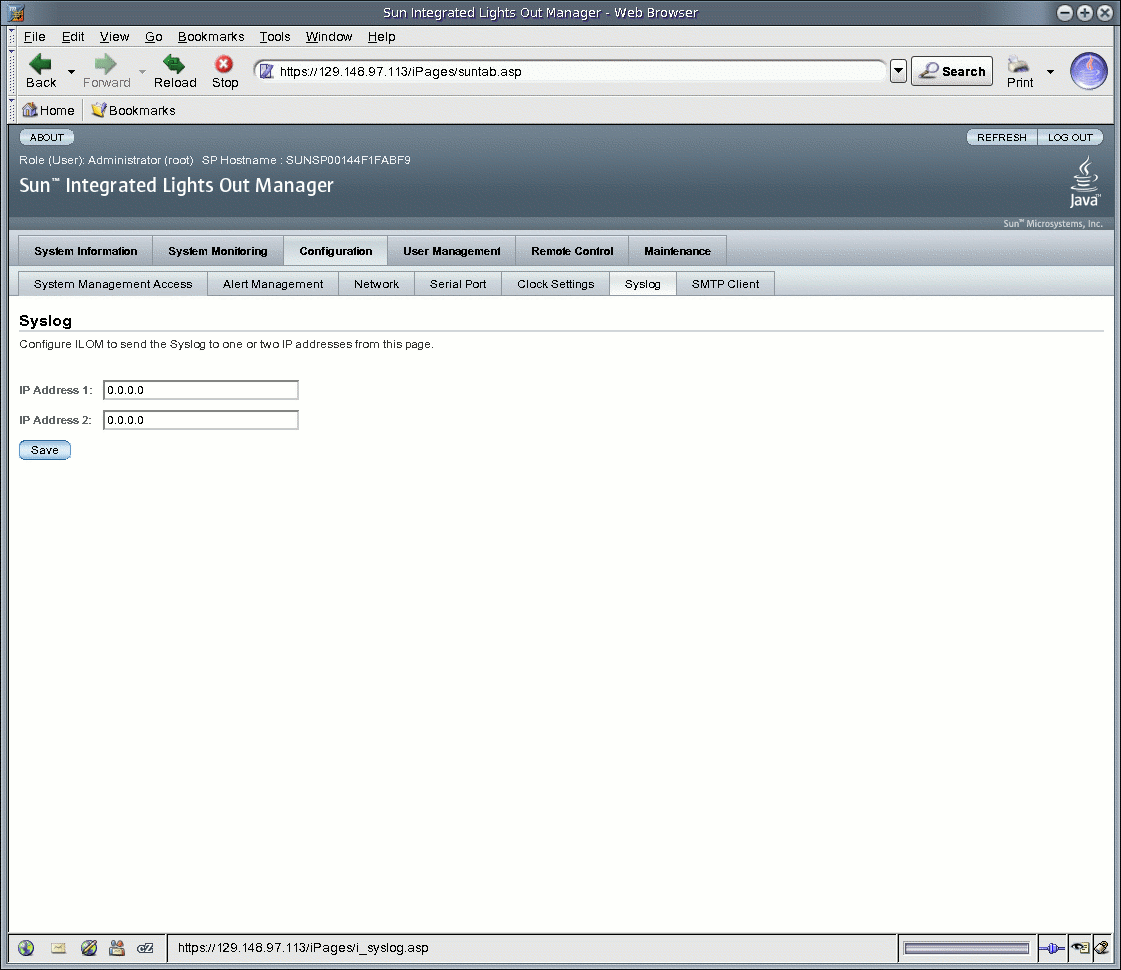
4. In the IP Address 1 and 2 fields, type the IP addresses for the two locations to which you want to send syslog data.
5. Click Save for your settings to take effect.
|
Follow these steps to configure a remote syslog receiver IP address using the CLI:
1. Establish a local serial console connection or SSH connection to the server SP or CMM:
Attach a serial console to the serial port on the server or CMM.
For more information, consult the user documentation provided with the Sun server platform.
Establish a Secure Shell connection to the server SP or CMM.
From the remote client, establish a secure connection as root to the server SP or active CMM.
For example, you can establish a secure connection from a remote SSH client to the server SP by typing the following:
The default command prompt appears (->).
2. Type one of the following command paths to set the working directory:
3. Type the show command to display the syslog properties.
The properties appear. For example, accessing the syslog properties for the first time on an SP would appear as follows:
/SP/clients/syslog Targets: Properties: destination_ip1 = 0.0.0.0 destination_ip2 = 0.0.0.0 Commands: cd set show |
4. Use the set command to identify a destination IP address for IP 1 (and, if applicable, IP 2).
For example to set an IP destination to IP address 11.222.33.4, you would type:
set destination_ip1=111.222.33.4
5. Press Enter for the setting to take effect.
The results of setting the IP address appear. For example, if you set the destination IP address to 111.222.33.4, the following would appear:
Set ‘destination_ip1’ to ‘111.222.33.4’
|
| Note - The ILOM Service Snapshot utility is supported only on x64-based systems running ILOM 2.x. The Service Snapshot utility is not supported on SPARC-based systems running ILOM 2.x |
To run the ILOM Service Snapshot utility using the CLI:
1. Log in to CLI as Administrator or Operator. For example:
ssh -l root server_ip_address
Password: password
->set /SP/diag/snapshot/dataset=data
->set /SP/diag/snapshot/dump_uri=URI
Where data and URI are one of the following:
|
| Note - The ILOM Service Snapshot utility is supported only on x64-based systems running ILOM 2.x. The Service Snapshot utility is not supported on SPARC-based systems running ILOM 2.x |
To run the ILOM Service Snapshot utility using the web interface:
1. Open a browser window and type the IP address of the server SP or CMM.
The Login page for the ILOM web interface appears.
2. In the ILOM Login page, enter a user name and password then click OK.
The ILOM web interface appears.
3. Select the Maintenance --> Data Collector tabs.
The Data Collector window appears (see FIGURE 7-9.)
FIGURE 7-9 Snapshot Data Collector Window
4. Select the desired Data Set radio button: Normal or Full.
Note that selecting Full may reset the system.
5. Select the desired Log Collection Only radio button: Enable or Disable.
7. In the dialog box, specify the directory to which to save the file and the file name.
The file is saved to the specified directory.
Alerts provide advance warning of possible system failures. Each Sun server platform is equipped with a number of sensors that measure voltages, temperatures, and other service-related attributes about the system. ILOM automatically polls these sensors and posts any events crossing a threshold to a ILOM event log, as well as generates alert message(s) to one or more customer-specified alert destinations.

|
Caution - ILOM tags all events or actions with LocalTime=GMT (or UTC). Browser clients show these events in LocalTime. This can cause apparent discrepancies in the event log. When an event occurs in ILOM, the event log shows it in UTC, but a client would show it in LocalTime. For more information about ILOM timestamps and clock settings, see Event Log Timestamps and ILOM Clock Settings. |
In ILOM you can configure up to 15 alert rules using the ILOM web interface or CLI. For each alert rule you configure in ILOM, you must define three or more properties about the alert depending on the alert type.
The alert type defines the messaging format and the method for sending and receiving an alert message. ILOM supports these three alert types:
All Sun server platforms support all three alert types with the exception of the Sun Chassis Monitoring Module (CMM). The Sun Chassis Monitoring Module supports SNMP Trap alerts and Email Notification alerts but it does not currently support IPMI PET alerts.
A brief discussion about each alert type, as well as the other properties you can use to define an alert rule is discussed further in the following section, Alert Rule Property Definitions.
ILOM offers up to five property values for defining an alert rule, they are as follows:
For more information about each of these property values, see TABLE 7-4.
|
The alert type property specifies the message format and the delivery method that ILOM will use when creating and sending the alert message. You can choose to configure one of the following alert types:
For each IPMI PET alert you configure in ILOM, you must specify an IP address for an alert destination and one of four supported alert levels. Note that the alert destination specified must support the receipt of IPMI PET messages. If the alert destination does not support the receipt of IMPI PET messages, the alert recipient will not be able to decode the alert message. |
||
Note that SNMP Trap alerts are supported on rackmount servers and blade server modules. |
||
|
||
|
The alert destination property specifies where to send the alert message. The alert type determines which destination you can choose to send an alert message. For example, IPMI PET and SNMP Trap alerts must specify an IP address destination. Email Notification alerts must specify an email address. If the proper format is not entered for an alert destination, ILOM will report an error. |
||
|
Alert levels act as a filter mechanism to ensure alert recipients only receive the alert messages that they are most interested in receiving. Each time you define an alert rule in ILOM, you must specify an alert level. The alert level determines which events generate an alert. The lowest level alert generates alerts for that level and for all alert levels above it. ILOM offers the following alert levels with Minor being the lowest alert offered:
|
||
All the alert levels will enable the sending of a alert with the exception of Disabled. Important. ILOM supports alert level filtering for all IPMI traps and Email Notification traps. ILOM does not support alert level filtering for SNMP traps. To enable the sending of an SNMP trap (but not filter the SNMP trap by alert level) you can choose anyone of the following options: minor, major, critical, or down. To disable the sending of an SNMP trap, you must choose the disabled option. |
||
|
The SNMP version property enables you to specify which version of an SNMP trap that you are sending. You can choose to specify: 1, 2c, or 3. |
||
|
The SNMP community name or user name property enables you to specify the community string or SNMP v3 user name used in the SNMP trap alert.
Important. If you choose to specify an SNMP v3 user name value, you must define this user in ILOM as an SNMP user. If you do not define this user as an SNMP user, the trap receiver will not be able to decode the SNMP trap alert. For more information about defining an SNMP user in ILOM, see Chapter 10. |
||
For more information about how to manage and create alert rule configurations in ILOM, see the following sections:
You can enable, modify, or disable any alert rule configuration in ILOM from the Alert Settings web interface page. All 15 alert rule configurations presented on this page are disabled by default. The Actions drop-down list box on the page enables you to edit the properties associated with an alert rule. To enable an alert rule on this page, you must define an alert type, alert level, and a valid alert destination.
The Alert Settings page also presents a Send Test Alert button. This test alert feature enables you to verify that each alert recipient specified in an enabled alert rule receives an alert message.
FIGURE 7-10 Alert Settings Page
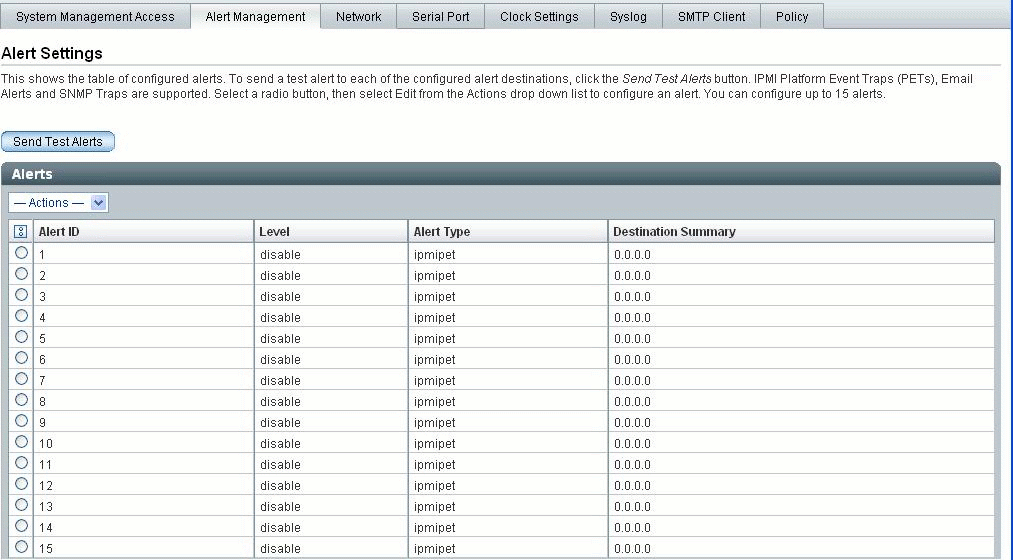
For additional information about how to create and manage alert rule configurations in ILOM using the web interface, see the following sections:
|
Use the following procedure to modify an alert rule configuration in ILOM:
1. Open a web browser and type the IP address of the server SP or CMM.
The Login page for the ILOM web interface appears.
2. In the ILOM Login page, enter an Administrator user name and password then click OK.
The ILOM web interface appears.
3. In the web interface page, select Configuration --> Alert Management.
The Alert Settings page appears.
4. In the Alert Settings page, do the following:
a. Select the radio button for alert rule you want to create or edit.
b. In the Actions drop-down list box, select Edit.
A dialog appears displaying the properties value associated with the alert rule.
c. In the properties dialog box, specify values for an alert type, alert level, and alert destination.
If the alert type you specify is an SNMP Trap, then you can optionally define a community name or user name value for authenticating the receipt of the alert message.
For more information about the property values you can specify for an alert rule, see Properties for Defining Alert Rules.
d. Click Save to apply the values specified and to close the properties dialog.
|
Use the following procedure to disable an alert rule configuration in ILOM:
1. Open a web browser and type the IP address of the server SP or CMM.
The Login page for the ILOM web interface appears.
2. In the ILOM Login page, enter an Administrator user name and password then click OK.
The ILOM web interface appears.
3. In the web interface page, select Configuration --> Alert Management.
The Alert Settings page appears.
4. In the Alert Settings page, select the radio button for the alert rule you want to modify then click Edit in the Actions drop-down list box.
A dialog appears presenting properties you can define about the alert rule.
5. In the properties dialog box, select Disabled in the Alert Levels drop-down list box.
|
You can test each enabled alert rule configuration in ILOM by sending a test alert.
To generate test alerts to destinations specified in ILOM’s alert rule configurations, follow this procedure:
1. Open a web browser and type the IP address of the server SP or CMM.
The Login page for the ILOM web interface appears.
2. In the ILOM Login page, enter an Administrator user name and password then click OK.
The ILOM web interface appears.
3. In the web interface page, select Configuration --> Alert Management.
The Alert Settings page appears.
4. In the Alert Settings page, click the Send Test Alert button.
ILOM generates test alerts to each of the alert rule configurations enabled on the Alert Settings page.
You can enable, modify, or disable any alert rule configuration in ILOM from the command-line interface (CLI). All 15 alert rule configurations defined in ILOM are disabled by default. To enable alert rule configurations in ILOM, you must set values for the following properties: alert type, alert level, and alert destination.
You can also generate test alerts to any enabled alert rule configuration in ILOM from the CLI. This test alert feature enables you to verify that the alert recipient(s) specified in an enabled alert rule configuration receives the alert message.
For more information about managing and creating alert rule configurations in ILOM using the CLI, see the following sections:
TABLE 7-5 identifies CLI commands that you will typically need to use to manage alert rule configuration using the ILOM CLI.
|
1. Establish a local serial console connection or SSH connection to the server SP or CMM:
Attach a serial console to the serial port on the server or CMM.
For more information, consult the user documentation provided with the Sun server platform.
Establish a Secure Shell connection to the server SP or CMM.
From the remote client, establish a secure connection as root to the server SP or active CMM.
For example, you can establish a secure connection from a remote SSH client to the server SP by typing the following:
The default command prompt appears (->).
2. Type one of the following command paths to set the working directory:
3. Type the show command to view properties associated with an alert rule.
For example, to view the properties associated with the first alert rule, you would type one of the following:
4. Type the set command to assign values to properties associated with an alert rule.
For example, to set IPMI PET as the alert type for rule 1, you would type the following command paths:
For more information about each of the property values you can define for an alert rule, see TABLE 7-4 Properties for Defining Alert Rules.
|
Use the following procedure to disable alert rule configurations in ILOM from the CLI:
1. Establish a local serial console connection or SSH connection to the server SP or CMM:
Attach a serial console to the serial port on the server or CMM.
For more information, consult the user documentation provided with the Sun server platform.
Establish a Secure Shell connection to the server SP or CMM.
From the remote client, establish a secure connection as root to the server SP or active CMM.
For example, you can establish a secure connection from a remote SSH client to the server SP by typing the following:
The default command prompt appears (->).
2. Use the cd command to set the working directory to the alert management rule you want to disable.
where n equals a specific alert rule number, which can be 1 to 15.
3. To disable the alert rule, type the following command:
|
You can test each enabled alert rule configuration in ILOM by sending a test alert.
To generate test alerts to destinations specified in ILOM’s alert rule configurations follow this procedure:
1. Establish a local serial console connection or SSH connection to the server SP or CMM:
Attach a serial console to the serial port on the server or CMM.
For more information, consult the user documentation provided with the Sun server platform.
Establish a Secure Shell connection to the server SP or CMM.
From the remote client, establish a secure connection as root to the server SP or active CMM.
For example, you can establish a secure connection from a remote SSH client to the server SP by typing the following:
The default command prompt appears (->).
2. Use the cd command to set the working directory to the alert management rules.
3. Type the following command to generate a test alert:
To generate configured Email Notification alerts, you must enable the ILOM client to act as an SMTP client to send the email alert messages. To enable the ILOM client as an SMTP client, you must specify the IP address and port number of an outgoing SMTP email server that will process the email notifications.
For more information about how to configure an SMTP client for email notification alerts in ILOM, see the following sections:
|
Follow these steps to configure an SMTP client in ILOM using the web interface:
1. Open a web browser and type the IP address of the server SP or CMM.
The Login page for the ILOM web interface appears.
2. In the ILOM Login page, enter an Administrator user name and password then click OK.
The ILOM web interface appears.
3. In the web interface page, select Configuration --> SMTP Client.
4. In the SMTP Client page, specify the following settings to enable the sending of Email Notification alerts.
|
Type the IP address of the outgoing SMTP email server that will process the email notifications. |
|
5. Click Save to apply the SMTP settings.
|
Follow these steps to configure an SMTP client in ILOM using the CLI:
1. Establish a local serial console connection or SSH connection to the server SP or CMM:
Attach a serial console to the serial port on the server or CMM.
For more information, consult the user documentation provided with the Sun server platform.
Establish a Secure Shell connection to the server SP or CMM.
From the remote client, establish a secure connection as root to the server SP or active CMM.
For example, you can establish a secure connection from a remote SSH client to the server SP by typing the following:
The default command prompt appears (->).
2. Use the cd command to set the working directory to clients/smtp.
3. Type the show command to display the SMTP properties.
For example, accessing the SMTP properties for the first time on an SP would appear as follows:
show /SP/clients/smtp Targets Properties address = 0. 0. 0. 0 port = 25 state = enabled Commands: cd set show |
4. Use the set command to specify an IP address for the SMTP client or to change the port or state property value.
5. Press Enter for the change to take effect.
For example, if you typed set address=222.333.44.5 the following result would appear:
Copyright © 2008 Sun Microsystems, Inc. All Rights Reserved.