Viewing Alarm Information
The Alarm Manager software displays alarm information for managed objects. You can view object alarm information in an administrative domain in the main console and the Details Alarm windows.
 To View Alarms From the Main Console Window
When an alarm condition occurs, a colored alarm indicator appears in the console window. For more information about the alarm indicators, see Alarm Severity Levels.
To view more information about an alarm:
-
To see a summary of current alarms, click one of the Domain Status Summary buttons in the main console window.
A list of objects appears in the Domain Status Details window. This list includes those objects that have at least one open, unacknowledged alarm for which the highest severity matches the icon on the button. For more information about these icons, see Alarm Severity Levels.
From the Domain Status Details window, you can do the following tasks:
-
Change the sort order of the displayed alarms, as described in To Sort the Domain Status Alarms.
-
Access detailed information about a specific alarm, as described in Step 2.
-
Update the Domain Status Details window by clicking the Refresh Now button.
-
-
To view details about a specific alarm, use one of the following methods:
-
Double-click the desired row in the Domain Status alarm table.
-
Click the desired row to select the row, and then click the Details button.
The Details window for the applicable managed object appears with the Alarms tab selected and alarm information displayed. From this window, you can do the following tasks:
-
Acknowledge the alarm, as described in To Acknowledge New Alarms.
-
View and modify the suggested fix for the alarm, as explained in To View and Add Suggested Fixes.
-
View and add user notes about the alarm, as described in To Add an Alarm Note.
-
Modify a defined alarm action, as explained in To Modify Pending Alarm Actions.
-
Delete the alarm, as described in To Delete Alarms.
-
 To Access an Alarm for a Specific Managed
Object
When an alarm icon appears next to a managed object icon in the main console window, you can view the alarms for that specific object.
-
Double-click the managed object icon.
The Details window for that managed object appears with the Module Browser tab selected.
-
Click the Alarms tab.
The Details window changes to show all open alarms for the current managed object.
 To Access Alarms From the Details Window
-
Press mouse button 3 on a host icon in the main console window, and choose Details from the pop-up menu.
The Details window appears.
-
Click the Alarms tab.
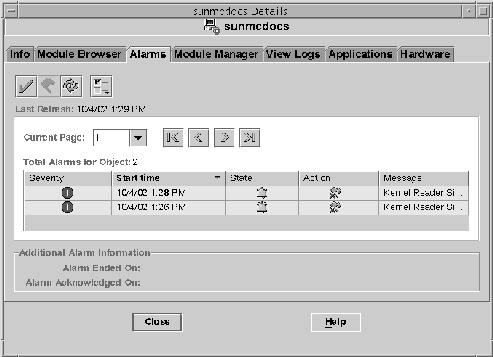
The Alarms Details window appears.
Note –A bold header identifies the column on which the alarms table is sorted. A down or up arrow indicates the order on which the column is sorted. For example, the alarms table shown in Figure 12–2 is sorted in descending order (newest to oldest alarm) based on the start date and time. This order is the default sort order for the table.
Figure 12–2 Alarms Details Window

For information about changing the sort order, see To Sort the Alarms Table.
 To Sort the Domain Status Alarms
By default, alarms in the Domain Status Details window are sorted from newest to oldest.
-
In the Domain Status Details window, click the Sort button.
The Sort Options window appears.
-
Determine whether to sort the alarms alphabetically or by time received:
-
To sort alphabetically by status message, click Status Message (alphabetically).
-
To sort the alarms by time received, newest to oldest, click Time (newest to oldest).
-
-
Click the OK button.
The Domain Status Details window updates with any order changes as appropriate.
 To Sort the Alarms Table
-
If the alarms table is currently sorted in ascending order, the table is redisplayed immediately in descending order, based on the column that you select.
-
If the alarms table is currently sorted in descending order, the table is redisplayed immediately in ascending order, based on the column that you select.
- Severity
-
Alarms are sorted from highest severity (down) to lowest severity (off or disabled).
- Start Time
-
Alarms are sorted from newest to oldest.
- Action
-
Alarms are sorted as follows:
-
Alarms that have completed and executed actions
-
Alarms that have pending actions
-
Alarms that have no actions
-
- State
-
Alarms are sorted from open to closed.
- Message
-
Alarms are sorted alphabetically.
Double-click any column header in the alarms table.
If the table contains many alarms, changing the sort order might take several seconds.
The column headers have an down or up arrow to the right of the header. These arrows indicate the order in which the table is sorted, descending (down arrow) or ascending (up arrow). The arrow indicator and the selected column header are boldface to identify current sort order. The following list identifies the default sort order for each column heading in the alarm table.
 To Update the Alarms Table
As new alarms are entered into the database, the currently displayed alarms table does not change. This behavior is true regardless of whether these alarms affect the currently displayed page. As existing alarms are deleted, the alarms table is updated automatically.
To update the alarms table, click the Refresh button.
The alarms table is updated to reflect the new alarms. The program recomputes the division of pages to add the new alarms. The date and time of refresh are displayed in the Last Refresh field.
 To Filter the Alarms Table
-
With the Alarms tab selected in the Details window, choose View Alarms from the Options menu.
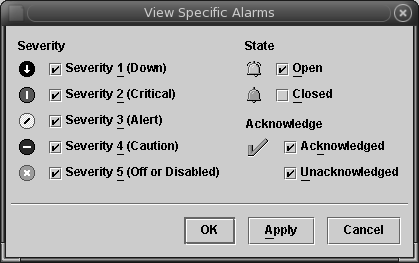
The View Specific Alarms dialog box appears.
Figure 12–3 View Specific Alarms Dialog

-
To select the items to include in the alarms table, click the boxes next to the items.
A check mark is displayed in each box that you select. You can select the severity, state, and acknowledgement status of the alarms displayed in the table.
-
Accept your selections.
-
To accept your selections and close the View Specific Alarms dialog box, click the OK button.
-
To accept your selections and continue to display the View Specific Alarms dialog box, click the Apply button.
The alarms table is filtered. The table is redisplayed to reflect your selections.
-
 To View a Log of Alarm Activity
The Sun Management Center software can show alarm activity in a log file. To view the log, follow these steps:
-
In the Details window for the Sun Management Center server, click the View Logs tab.
-
From the Choose Log File Type menu (the left-most icon at the top of the page), select Sun Management Center Log.
-
From the Sun Management Center Log list, select eventHistory.log.
The eventHistory.log file contents display in the window.
- © 2010, Oracle Corporation and/or its affiliates
