 To Create a Graph of Two or More Data Properties
-
Click in the data property table cell.
For example, if you followed the hierarchy from Operating System to Kernel Reader (Simple) to System Load Statistics, you could select the Load Averages Over the Last 1 Minute table cell.
-
Copy the cell to the graph in one of the following ways:
-
Click mouse button 3 in the table cell, and choose the Copy to Graph Clipboard command from the pop-up menu.
-
In the Details window, choose Copy to Graph Clipboard from the Options icon menu.
Note –The Copy to Graph Clipboard command works only when the units of the data item are the same. Also, Copy to Graph Clipboard places the data on a clipboard. The data is not actually placed on the graph until you complete the following steps.
-
-
Go to the graphing window in which you want the additional property to be plotted.
-
Choose Add From Graph Clipboard from the Graph menu.
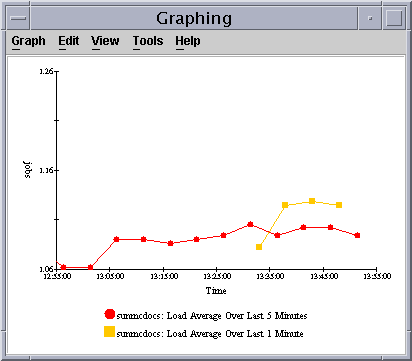
The second data property is added, as shown in Figure 9–2.
Note –You can graph up to five data properties at one time on a single graph.
Figure 9–2 Load Averages Over the Last One and Five Minutes

- © 2010, Oracle Corporation and/or its affiliates
