Navigating the Details Window
Some tabs can display many levels of detail. Double-click icons in the Details window to see additional levels of information. A category can have many subcategories.
If information in a table cell is too long to display completely, hold the mouse pointer in the cell for several seconds. The complete text that is contained in that cell appears in a pop-up window.
To expand or compress the hierarchy, use the expansion icon.The hierarchy is compressed when the icon “handle” is pointing right. The hierarchy is expanded when the icon “handle” is pointing down.
 To Start the Details Window
-
Start the Details window in either of the following ways:
-
Double-click an object icon in either the hierarchy view or the topology view.
-
Press mouse button 3 on an object icon, and choose Details from the pop-up menu.
Tip –Be sure to select an object, not an administrative domain. The Details window is not available for administrative domains.
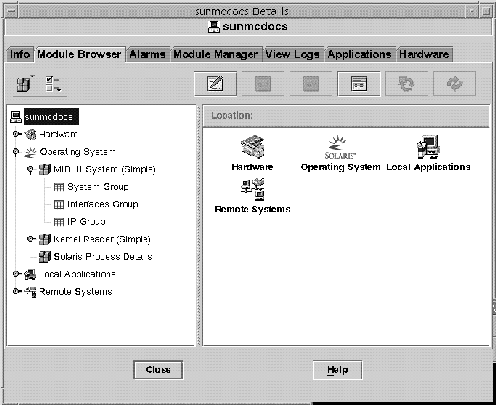
The Details window appears, as illustrated in the following figure.
Figure 6–7 Details Window for a Selected Object

-
-
Click a tab to view detailed information for that category.
Viewing Log Files
You can view log files or portions of log files. You can also monitor log messages as the messages are added to the log files.
 To View the System Log File Messages
-
In the Details window, click the View Logs tab.
-
Choose System Log from the Log File menu.
-
Click the Log File field, and select Syslog.
The System Log messages are displayed.
To refresh the display and view any new messages, click Reload.
 To Filter Your Log Request
You can apply a filter to display only those messages that match the date range and text pattern that you specify. In addition, you can limit the size of the search by specifying the maximum number of matches to report.
-
With the View Logs tab selected in the Details window, click the Filter button.
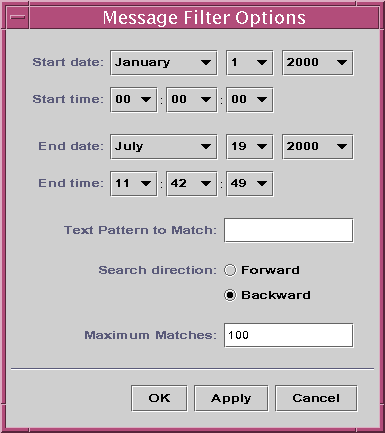
The Message Filter Options dialog box is displayed, as shown in the following figure.
Figure 6–8 Message Filter Options Dialog Box

-
Select the start date for the first log message that you want to view.
-
Select the start time for the first log message that you want to view.
-
Select the end date for the last log message that you want to view.
-
Select the end time for the last log message that you want to view.
-
Type the text pattern to be matched in the Text Pattern to Match field.
Use a text pattern that is unique to the type of message in which you are interested.
-
Select Forward or Backward to specify the direction of the message search through the log file.
To begin searching from the end of the log file, select Backward. To search from the beginning, select Forward.
-
(Optional) Type the maximum number of log messages that should be matched in the Maximum matches to report field.
If you enter zero (0), all matching messages are reported, up to a maximum of 100 messages.
-
To filter and reload your log messages and close this window, click the OK button.
 To Monitor Log Messages
Monitoring enables you to view new log messages as the messages occur. Each new message that arrives is highlighted.
-
Click the Monitor button on the View Logs screen.
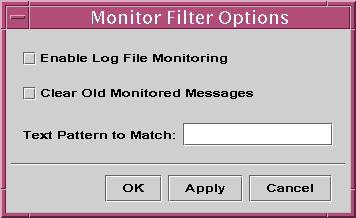
The Monitor Filter Options dialog box is displayed, as shown in the following figure.
Figure 6–9 Monitor Filter Messages Dialog Box

-
Select Enable Log File Monitoring to enable log file monitoring.
-
To display only currently monitored log messages, select Clear Old Monitored Messages.
-
Type the text pattern to be matched in the Text Pattern to Match field.
You can use a UNIX regular expression. For information about regular expressions, refer to the regex(1F) man page.
Use a text pattern that is unique to the type of message in which you are interested.
-
To monitor your log messages and close this window, click the OK button.
 To Find a Log Message
You can search for a specific character sequence within a set of messages after the set has been loaded and displayed in the Messages For area.
-
Click the View Logs tab in the Details window.
-
Type the specific character sequence that you want to find in the Find field.
Note –Wildcard searches using an asterisk (*) character, are not supported in the View Logs find feature. To search for a message that contains the asterisk character, precede the character with a backslash (\), for example, \*.
-
Press Return to search the log messages for that sequence.
The first matching message is highlighted.
-
Click the down arrow or up arrow to continue your search and find additional occurrences of the matching sequence.
 To View the Sun Management Center Log File Messages
-
With the View Logs tab selected in the Details window, choose Sun Management Center Log from the Log File menu.
A list of log files displays as a submenu.
-
Select the Sun Management Center log file that you want to view.
The messages for the selected log file are displayed.
-
To apply filters to the information, click the Filter button. Then, provide the filter parameters in the Message Filter Options dialog box.
The information is displayed using the filter that you selected.
 To Refresh Log Messages
To refresh and reload the currently filtered set of log messages, click the Reload button.
 To View Other Log File Messages
-
With the View Logs tab selected in the Details window, choose Other Log from the Log File menu.
Note –The Other Log option is available only if the Logview ACL module (Local Applications) is loaded.
-
To filter the log information, click the Filter button. Then, provide the filter parameters in the Message Filter Options dialog box.
The information is displayed using the filter that you selected.
Viewing Application and Process Information
You can view information about an application. You can also view information about a specific process, such as the amount of memory or CPU currently in use.
Note –
The Solaris Process Details module must be loaded to view process information. For instructions, see To Load a Module.
 To View Information About a Specific Application
-
From the Details window, click the Applications tab.
The Applications panel appears showing a list of available applications. By default, if the Solaris Process Details module is loaded:
-
The View Processes application is selected in the left side of the window.
-
Process information appears in the right side of the window.
-
-
To view information about another application, click on the application name in the list on the left side of the window.
For example, you could view information about the Hardware Diagnostic Suite. The right side of the window is updated with the selected application.
 To Display Additional Properties in the Process
Table
By default, the View Process table displays the following information:
-
Process identifier (PID)
-
User that is running the process
-
Amount of CPU used for the process
-
Amount of memory that is used for the process
-
Command line for the process
To add additional information to the table, follow these steps:
-
In the Details window, click the Applications tab.
If the Solaris Process Details module is loaded, the View Process table appears.
-
Click the View Columns button above the Process table to see a list of available process properties.
A check mark appears next to columns that currently are in the table.
-
To add information about a property to the table, select the property that you want to add.
The selected property appears in a new column to the right of the existing columns in the table.
-
To add more properties to the table, repeat the preceding steps.
Tip –To view all process properties, select the All button at the bottom of the View Columns list.
 To Sort Columns in the Process Table
You can sort the processes (rows) by the properties (column headers) in ascending or descending order. For example, you can sort the CPU% column starting with either the smallest or the largest value first.
-
To sort columns in ascending order, click the property in the table column header.
The processes (rows) are updated in ascending order for that property.
-
To sort columns in descending order, click the property in the table column header while holding down the Shift key.
The processes (rows) are updated in descending order for that property.
 To Reorder Columns in the Process Table
You can rearrange the order of columns.
-
To select a column, press mouse button 1 on a column header.
-
To move the column, drag the column header to the desired position and release the mouse button.
Viewing Hardware Information
Note –
If you load or unload the Config-Reader or Dynamic Reconfiguration modules while the Details window is open, you must close and reopen the Details window to see the results.
 To View a Hardware Configuration
-
In the Details window, click the Hardware tab.
The Hardware panel appears and displays a summary of hardware information.
-
Select the configuration in which you are interested.
The window is updated, and the selected feature is displayed.
 To Reconfigure the System
-
Open the Details window for the selected system.
-
Select the Module Manager tab in the Details window, and verify that the Dynamic Reconfiguration (dr) module is loaded.
Load the module if necessary. For information about loading modules, see To Load a Module.
-
Select the Hardware tab in the Details window.
-
From the Views Menu, choose “system” in either the Physical View or the Logical View category.
The view changes, and a Reconfiguration button appears at top of the display.
-
Click the Reconfiguration button.
-
If the Reconfiguration module is not loaded, a pop-up window displays an error message.
-
If the Reconfiguration module is loaded, the Dynamic Reconfiguration pop-up window appears.
-
-
Select a board slot or memory bank.
Dynamic Reconfiguration buttons are not available for operations that are not permitted for the selected board or memory and appear dimmed.
-
Click the desired function button for the selected memory or board.
Function
Action
Configure
Adds the selected board or memory to the system configuration. Turns on power to the board, if the board was not previously in the Connected state.
Unconfigure
Removes the selected board or memory from the system configuration. Electrical power to the board is maintained.
Connect
Turns on electrical power to the board. Basic tests of the board are run, but the board is not automatically added to the system configuration.
Note –The Configure function includes this function.
Disconnect
Turns off power to the board. The board is ready to remove when the yellow Service LED is lit, and the Power and Cycling LEDs are off.
Test Memory
Tests the selected memory.
Note –Memory tests can be time-consuming. These tests might last an hour or longer for large-capacity DIMMs.
- © 2010, Oracle Corporation and/or its affiliates
