Alarm Indicators
The Alarm Manager software uses several different methods to alert you to an unacknowledged open alarm condition:
-
Colored icons in the Domain Status Summary on the main console
-
Colored icons in the hierarchy (tree) view
-
Colored icons in the topology (contents) view
-
Colored relevant row or relevant column in the property table (contents view)
The type and color of alarm icon identify the severity of the alarm. For example, a red alarm icon indicates that a critical condition has developed and that corrective action is required immediately. By contrast, a blue alarm icon indicates a potential or an impending service-affecting fault.
You can acknowledge, delete, and manage the object alarms by using the Alarms Details window. For more information, see Managing and Controlling Alarms.
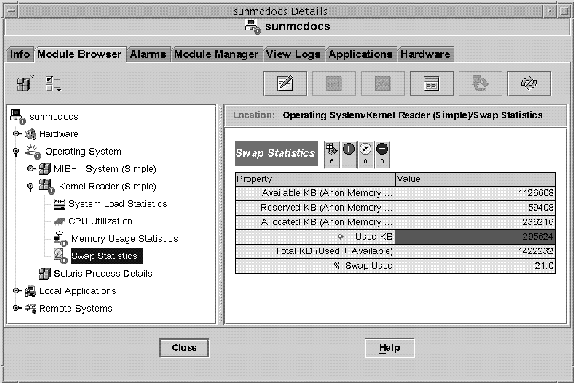
Figure 12–1 shows an unacknowledged, open critical alarm in the Swap Statistics properties table Used KB row. The row is red, which indicates a critical alarm. The alarm information propagates up the hierarchy tree view, from the individual module up to the host. You would also see a red alarm icon on the following objects:
-
Swap Statistics properties table
-
Kernel Reader module
-
Operating System
-
Host
You also see a red alarm icon on the corresponding host, group (if any), or administrative domain in the main console window. The only exception would occur if an unacknowledged open black alarm of higher severity exists.
Figure 12–1 Swap Statistics Alarm in the Details Window

You can select Critical Alarms, Alert Alarms, and Caution Alarms simultaneously for a module table. A tick mark appears when these alarms are selected.
Note –
Unacknowledged alarms take precedence over acknowledged alarms. If the hierarchy has two or more types of alarms, the color of the more severe unacknowledged alarm is propagated up the tree. For example, if there is a yellow unacknowledged alarm in CPU usage and a red unacknowledged alarm in Disk Statistics, only the red alarm icon propagates. However, if there is a yellow unacknowledged alarm in CPU usage and a red acknowledged alarm in Disk Statistics, only the yellow alarm icon propagates.
Alarm Severity Levels
The following alarm severities are supported:
- Down Alarms
-
A down alarm
 indicates
that a service-affecting condition has occurred that requires immediate corrective
action. An example of this condition is the following: A required resource that is
defined by a managed object has gone out of service. A specific example of this condition
is a module that has gone down.
 - Critical Alarms
-
A critical alarm
 indicates
that a service-affecting condition has developed that requires an urgent corrective
action. An example of this condition occurs when a severe degradation in the capability
of an object has occurred and you need to restore the object to full capability.
 - Alert Alarms
-
An alert alarm
 indicates that a non-service-affecting condition has developed.
Corrective action should be taken to prevent a more serious fault.
 - Caution Alarms
-
A caution alarm
 indicates the detection of a potential or impending service-affecting
fault before any significant effects have occurred. You should diagnose further if
necessary and correct the problem before it becomes a serious service-affecting fault.
 - Off/Disabled Alarms
-
A disabled alarm
 indicates
that a resource for a managed object is disabled. For example, a module is disabled.
Indeterminate State
Objects with black star icons are objects with indeterminate states, not to be confused with alarms. A black star or “splat” icon in the main console window means that a data acquisition failure occurred in that object. The failure is not the result of a rule infraction, so no alarm is associated with the failure.
Note –
When you view the data property table for an object, a pink row also indicates an indeterminate object state.
- © 2010, Oracle Corporation and/or its affiliates
