View Processes
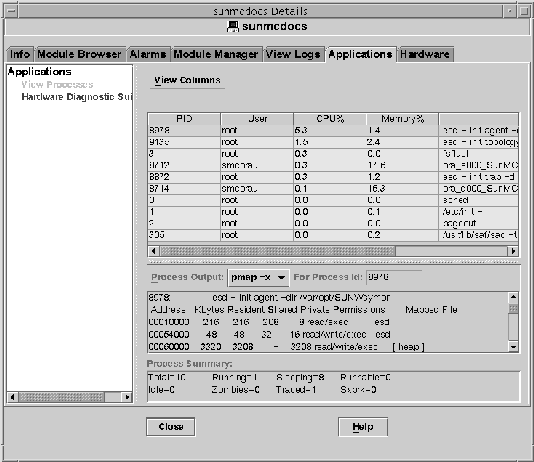
The View Processes application in Figure 6–1 enables you to view and select detailed information about processes running on the selected host or node.
The Solaris Process Details module must be loaded to use the Process Viewer. For instructions, see To Load a Module. If the Solaris Process Details module is not loaded when you click the Applications tab, you must do the following:
-
Close the Details window.
-
Load the Solaris Process Details module.
-
Reopen the Details window.
Figure 6–1 Process Viewer

The following table lists the properties that are available in the Process Viewer.
Table 6–3 Process Viewer Properties|
Property |
Description |
|---|---|
|
Process Identifier |
|
|
Process ID of the parent process |
|
|
Effective user ID number |
|
|
Effective user login name |
|
|
Effective user ID |
|
|
Group ID of the user |
|
|
Effective group ID of the user |
|
|
Process ID of the session leader |
|
|
Process ID of the process group leader |
|
|
Tty |
Terminal that controls the process. A question mark (?) is printed when there is no controlling terminal. |
|
Time that the process started, in hours, minutes, and seconds. The start time for a process that is more than 24 hours old is given in months and days. |
|
|
Cumulative execution time for the process |
|
|
State of the process |
|
|
Address of an event for which the process is sleeping. If blank, the process is running. |
|
|
Scheduling class of the process |
|
|
Memory address of the process |
|
|
Size in pages in main memory for the image of the swappable process |
|
|
Priority of the process |
|
|
Decimal value of the system scheduling priority of the process |
|
|
Ratio of CPU time used recently to CPU time that was available in the same period, expressed as a percentage |
|
|
Ratio of the process's resident set size to the physical memory on the machine, expressed as a percentage |
|
|
Command name |
|
|
Full command name and its arguments, up to a limit of 80 characters |
Process Statistics Window
The Output For Process ID window displays the statistics for either pmap, pstack, pfiles, or pldd for any highlighted process in the Process View window.
- pmap
- pstack
-
Prints a stack trace for each lightweight process (lwp) in each process
- pfiles
-
Reports fstat and fcntl information for all open files in each process
- pldd
-
Prints dynamic libraries for the process
Process Summary Field
The Process Summary field lists statistics for all processes, active or inactive.
- © 2010, Oracle Corporation and/or its affiliates
