Sun Netra X4450 Server
Service Manual X4450 Server
Service Manual |
| C H A P T E R 1 |
This chapter describes the diagnostics that are available for monitoring and troubleshooting the server.
If you have installed the server, and upon initial power up, you see errors indicating faults with the Fully Buffered DIMMs (FB-DIMMs), PCI cards, or other components, the suspect component might have become loose during shipment.
Conduct a visual inspection of the server internals and its components. Remove the top cover and physically reseat the cable connections, the PCI cards, and the FB-DIMMs.
There are a variety of diagnostic tools, commands, and indicators you can use to monitor and troubleshoot a server:
Status indicators – These indicators provide a quick visual notification of the status of the server and of some of the FRUs.
Fault management architecture – FMA provides simplified fault diagnostics through use of the /var/adm/messages file, the fmdump command, and a Sun Microsystems web site.
ILOM
firmware – This system firmware runs on the service processor.
In addition to providing the interface between the hardware and
OS, ILOM also tracks and reports the health of key server components.
ILOM works closely with POST and Solaris Predictive
Self Healing technology to keep the system up and running even when
there is a faulty component.
Power-on self-test (POST) – POST performs diagnostics on system components upon system reset to ensure the integrity of those components. POST is configurable and works with ILOM to take faulty components offline if needed.
Solaris Predictive Self-Healing
(PSH) – This technology continuously monitors the
health of the CPU and memory, and works with ILOM to take a faulty component
offline if needed. The Predictive Self Healing technology enables Sun systems to accurately predict component
failures and mitigate many serious problems before they occur.
Log files and console messages – These provide the standard Solaris Operating System (OS) log files and investigative commands that can be accessed and displayed on the device of your choice.
The LEDs, ILOM, Solaris PSH, and many of the log files and console messages are integrated. For example, a fault detected by the Solaris software will display the fault, log it, pass information to ILOM where it is logged, and, depending on the fault, might light one or more LEDs.
| Action No. | Diagnostic Action | Resulting Action | Additional Information |
|---|---|---|---|
| 1 | Check Power OK and Input OK LEDs on the server. | The Power OK LED is located
on the front and rear of the chassis.
The Input OK LED is located on the rear of the server on each power supply. If these LEDs are not on, check the power source and power connections to the server. |
Using the Status Indicators to Identify the State of Devices |
| 2 | Check the Solaris log files for fault information. | The Solaris message buffer and log files record system events and provide information about faults. If system messages indicate a faulty device, replace the FRU. | Collecting Information From Solaris OS Files and Commands |
| 3 | Determine if the fault is an environmental fault. | Environmental faults can be caused by faulty FRUs (power supply, fan, or blower), or by environmental conditions such as when computer room ambient temperature is too high, or the server airflow is blocked. When the environmental condition is corrected, the fault will automatically clear. | Using the Service Processor Firmware for Diagnosis and Repair Verification |
| If the fault indicates that a fan, blower, or power supply is bad, you can perform a hot-swap of the FRU. You can also use the fault indicators on the server to identify the faulty FRU (fans, blower, and power supplies). | Using the Status Indicators to Identify the State of Devices | ||
| 4 | Determine if the fault was detected by PSH. | If the fault message displays the following text, the fault was detected by the Solaris Predictive Self Healing software: Host detected fault | Using the Solaris Predictive Self Healing Feature |
| If the fault is a PSH detected fault, identify the faulty FRU from the fault message and replace the faulty FRU. | Clear PSH Detected Faults | ||
| After replacing the FRU, perform the procedure to clear PSH detected faults. | |||
| 5 | Contact Sun for Support. | The majority of hardware faults are detected by the server’s diagnostics. In rare cases, a problem might require additional troubleshooting. If you are unable to determine the cause of the problem, contact Sun for support. | Sun Support information: http://www.sun.com/support |
The server uses an advanced ECC technology, called chipkill, that corrects up to 4 bits in error on nibble boundaries, as long as all of the bits are in the same DRAM. If a DRAM fails, the FB-DIMM continues to function.
The Predictive Self Healing (PSH) technology in the Solaris OS uses the fault manager daemon (fmd) to watch for various kinds of faults. When a fault occurs, the fault is assigned a unique fault ID (UUID), and logged. PSH reports the fault and provides a recommended proactive replacement for the FB-DIMMs associated with the fault.
If you suspect that the server has a memory problem, see Replacing FB-DIMMs for FB-DIMM replacement instructions. You must perform the instructions in that chapter to clear the faults and enable the replaced FB-DIMMs.
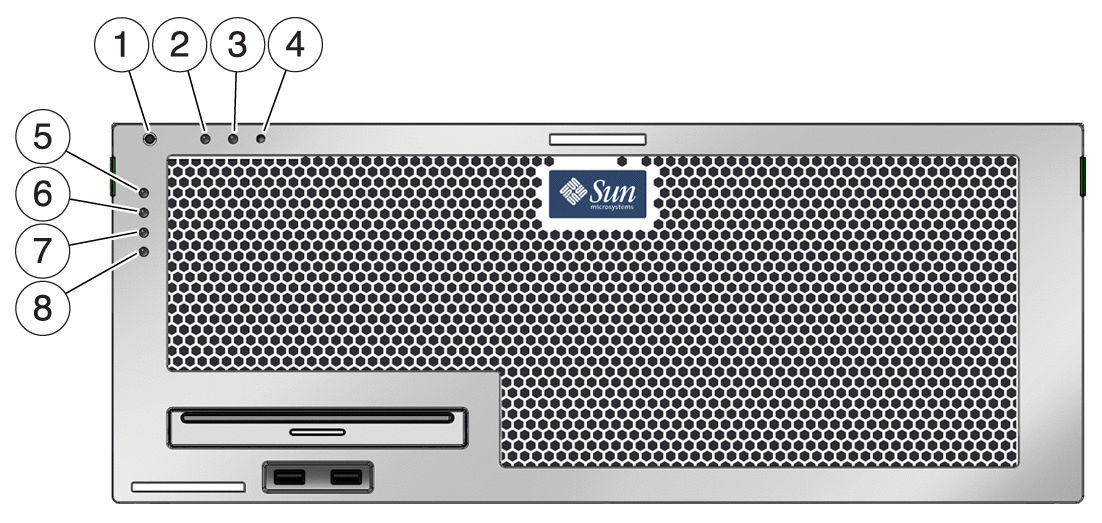
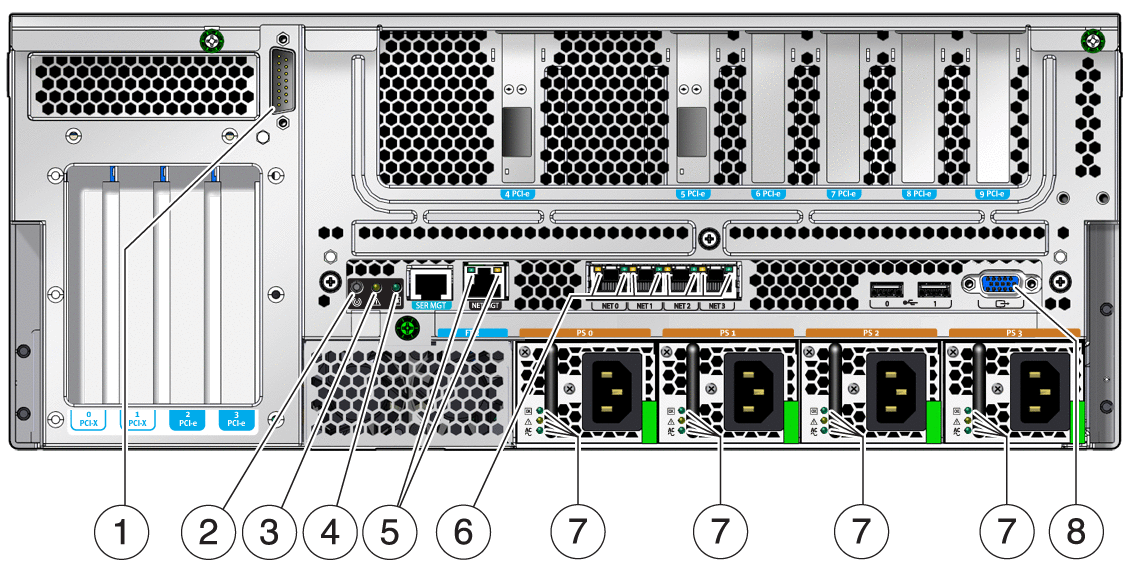
The server provides status indicators in the upper left corner of the front panel (FIGURE 1-1) and on the rear panel (FIGURE 1-2). These indicators provide a visual means of determining the state of the system or individual components.

Figure Legend
1 White Locator Indicator and Button
2 Yellow Service Required Indicator
3 Green Running Indicator
4 On/Standby Button
5 Red Critical Alarm Indicator
6 Red Major Alarm Indicator
7 Amber Minor Alarm Indicator
8 Amber User Alarm Indicator

Figure Legend
1 Alarm port
2 White Locator Indicator and button
3 Yellow Service Required Indicator
4 Green Running Indicator
5 Management network port indicators
6 Ethernet port indicators
7 Power supply indicators
8 Video port
TABLE 1-2 lists and describes the front and rear panel indicators.
The hard drive indicators (FIGURE 1-3 and TABLE 1-3) are located on the front of each hard drive that is installed in the server chassis.

Figure Legend
1 OK to Remove
2 Fault
3 Activity
| Indicator | Color | Description |
|---|---|---|
| OK to Remove | Blue | |
| Fault | Amber | |
| Activity | Green |
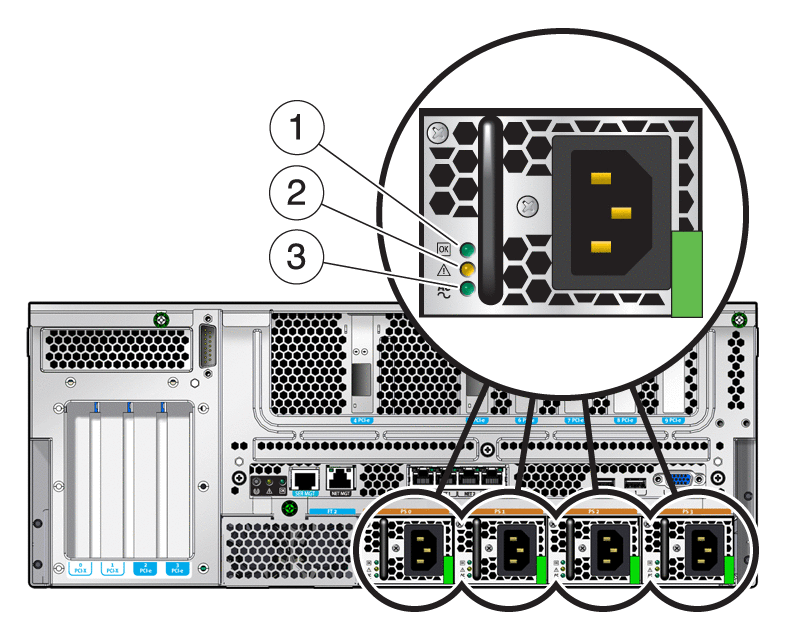
The power supply indicators (FIGURE 1-4 and TABLE 1-4) are located on the rear of each power supply.

Figure Legend
1 Power OK incdicator
2 Fault indicator
3 Input OK indicator
| Indicator | Color | Description |
|---|---|---|
| Power OK | Green | |
| Fault | Amber | |
| Input OK | Green |
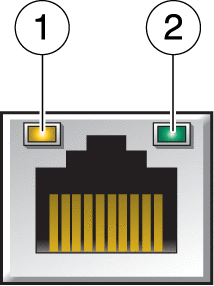
The ILOM management Ethernet port and the four 10/100/1000 Mbps Ethernet ports each have two indicators, as shown in FIGURE 1-5 and described in TABLE 1-5.

Figure Legend
1 Speed indicator (same location for all Ethernet ports)
2 Link/Activity indicator (Same location for all Ethernet ports)
| Indicator | Color | Description |
|---|---|---|
| Right indicator | Green | Link/Activity indicator: |
| Left Indicator | Amber or Green | Speed indicator: |
Note - The NET MGT port operates only in 100-Mbps or 10-Mbps so the speed indicator can be green or off (never amber). |
The Sun Integrated Lights Out Manager (ILOM) firmware is a service processor in the server that enables you to remotely manage and administer your server.
ILOM enables you to remotely run diagnostics that would otherwise require physical proximity to the server’s serial port. You can also configure ILOM to send email alerts of hardware failures, hardware warnings, and other events related to the server or to ILOM.
Faults detected by ILOM, POST, and the Solaris Predictive Self Healing (PSH) technology are forwarded to ILOM for fault handling. In the event of a system fault, ILOM ensures that the Fault Indicator is lit, the FRU ID PROMs are updated, the fault is logged, and alerts are displayed (faulty FRUs are identified in fault messages using the FRU name).
The service processor detects when a fault is no longer present and clears the fault in several ways:
Fault recovery – The system automatically detects that the fault condition is no longer present. ILOM extinguishes the Service Required Indicator and updates the FRU’s PROM, indicating that the fault is no longer present.
Fault repair – The fault has been repaired by human intervention. In most cases, the service processor detects the repair and extinguishes the Service Required Indicator. If the service processor does not perform these actions, you must perform these tasks manually.
The service processor also detects the removal of a FRU, in many cases even if the FRU is removed while the service processor is powered off (that is, if the system power cables are unplugged during service procedures). This situation enables ILOM to know that a fault, diagnosed to a specific FRU, has been repaired.
Note - ILOM does not automatically detect hard drive replacement. |
Many environmental faults can automatically recover. A temperature that is exceeding a threshold might return to normal limits. An unplugged power supply can be plugged in, and so on. Recovery of environmental faults is automatically detected. Recovery events are reported using one of two forms:
Environmental faults can be repaired through hot-removal of the faulty FRU. FRU removal is automatically detected by the environmental monitoring, and all faults associated with the removed FRU are cleared. The message for that case, and the alert sent for all FRU removals is:
fru at location has been removed.
There is no ILOM command to manually repair an environmental fault.
The Solaris Predictive Self Healing technology does not monitor the hard drive for faults. As a result, the service processor does not recognize hard drive faults, and will not light the fault indicators on either the chassis or the hard drive itself. Use the Solaris message files to view hard drive faults. See Collecting Information From Solaris OS Files and Commands.
The Solaris Predictive Self Healing (PSH) technology enables the server to diagnose problems while the Solaris OS is running, and mitigate many problems before they negatively affect operations.
The Solaris OS uses the fault manager daemon, fmd(1M), which starts at boot time and runs in the background to monitor the system. If a component generates an error, the daemon handles the error by correlating the error with data from previous errors and other related information to diagnose the problem. After diagnosed, the fault manager daemon assigns the problem a Universal Unique Identifier (UUID) that distinguishes the problem across any set of systems. When possible, the fault manager daemon initiates steps to self-heal the failed component and take the component offline. The daemon also logs the fault to the syslogd daemon and provides a fault notification with a message ID (MSGID). You can use the message ID to get additional information about the problem from Sun’s knowledge article database.
The Predictive Self Healing technology covers the following server components:
The PSH console message provides the following information:
If the Solaris PSH facility detects a faulty component, use the fmdump command to identify the fault. Faulty FRUs are identified in fault messages using the FRU name.
Note - Additional Predictive Self Healing information is available at: http://www.sun.com/msg |
When a PSH fault is detected, a Solaris OS console message similar to EXAMPLE 1-1 is displayed.
Faults detected by the Solaris PSH facility are also reported through service processor alerts.
Note - The Service Required Indicator is also turned on for PSH diagnosed faults. |
The fmdump command displays the list of faults detected by the Solaris PSH facility and identifies the faulty FRU for a particular EVENT_ID (UUID).
Do not use fmdump to verify a FRU replacement has cleared a fault because the output of fmdump is the same after the FRU has been replaced. Use the fmadm faulty command to verify the fault has cleared.
Check the event log using the fmdump command with -v for verbose output.
The output includes the following details:
Universal Unique Identifier (UUID). This is unique for every fault (fd940ac2-d21e-c94a-f258-f8a9bb69d05b)
Sun message identifier, which can be used to obtain additional fault information (SUN4V-8000-JA)
Faulted FRU. The information provided in the example includes the part number of the FRU (part=541215101) and the serial number of the FRU (serial=101083). The Location field provides the name of the FRU. The FRU name is MB, meaning the motherboard.
Note - fmdump displays the PSH event log. Entries remain in the log after the fault has been repaired. |
Use the Sun message ID to obtain more information about this type of fault.
In a browser, go to the Predictive Self Healing Knowledge Article web site: http://www.sun.com/msg
Enter the message ID in the SUNW-MSG-ID field, and click Lookup.
When the Solaris PSH facility detects faults the faults are logged and displayed on the console. In most cases, after the fault is repaired, the corrected state is detected by the system and the fault condition is repaired automatically. However, this must be verified and, in cases where the fault condition is not automatically cleared, the fault must be cleared manually.
Clear the fault from all persistent fault records.
In some cases, even though the fault is cleared, some persistent fault information remains and results in erroneous fault messages at boot time. To ensure that these messages are not displayed, perform the following Solaris OS command:
# fmadm repair 7ee0e46b-ea64-6565-e684-e996963f7b86 |
With the Solaris OS running on the server, you have the full complement of Solaris OS files and commands available for collecting information and for troubleshooting.
If the service processor or the Solaris PSH features do not indicate the source of a fault, check the message buffer and log files for notifications for faults. Hard drive faults are usually captured by the Solaris message files.
Use the dmesg command to view the most recent system message. To view the system messages log file, view the contents of the /var/adm/messages file.
The error logging daemon, syslogd, automatically records various system warnings, errors, and faults in message files. These messages alert you to system problems such as a device that is about to fail.
The /var/adm directory contains several message files. The most recent messages are in the /var/adm/messages file. After a period of time (usually every ten days), a new messages file is automatically created. The original contents of the messages file are rotated to a file named messages.1. Over a period of time, the messages are further rotated to messages.2 and messages.3, and then deleted.
In addition to this service manual, the following resources are available to help you keep your server running optimally:
Server Product Notes – Contain late-breaking information about the system including required software patches, updated hardware and compatibility information, and solutions to know issues. The product notes are available online at: http://www.oracle.com/technetwork/indexes/documentation/index.html
Solaris Release Notes – Contain important information about the Solaris OS. The release notes are available online at: http://www.oracle.com/technetwork/indexes/documentation/index.html
SunSolve Online – Provides a collection
of support resources. Depending on the level of your service contract,
you have access to Sun patches, the Sun System Handbook, the SunSolve
knowledge base, the Sun Support Forum, and additional documents,
bulletins, and related links. Access this site at: http://sunsolve.sun.com
Predictive Self Healing Knowledge Database – Provides access to the knowledge article corresponding to a self-healing message by taking the Sun Message Identifier (SUNW-MSG-ID) and entering it into the field on this page: http://www.sun.com/msg
Copyright © 2008, Sun Microsystems, Inc. All rights reserved.