Data Properties
The ability to log data is included with the Sun Management Center 3.5 base product. Performance Reporting Manager uses this logged data in the reports. Only data that is logged to the history log files on the agent machine is collected for reporting purposes. Data cannot be included in any report until logging of the data property is first enabled. Certain data properties are automatically logged for you. If a property is not being logged, you do not receive any data for that property until logging is first enabled. For more information, see Data Properties Logging.
You can use the Data Availability option to determine whether a property is being logged on the machine. Use the history logging capability of Sun Management Center 3.5 to either enable or disable the logging of a data property. You can also use the group logging task. For more information about history logging, see Sun Management Center 3.5 User's Guide. For more information about the group logging task, see Group Logging
If you receive a No Data Found error message when running a report, first check to see if the data property is being logged on the agent machine specified in your report. For more information, see Data Collection Options. If logging is enabled, check to see if the data property is being logged from the Data Availability window. For more information, see To View the Data Properties Logged for a Host.
Data Availability
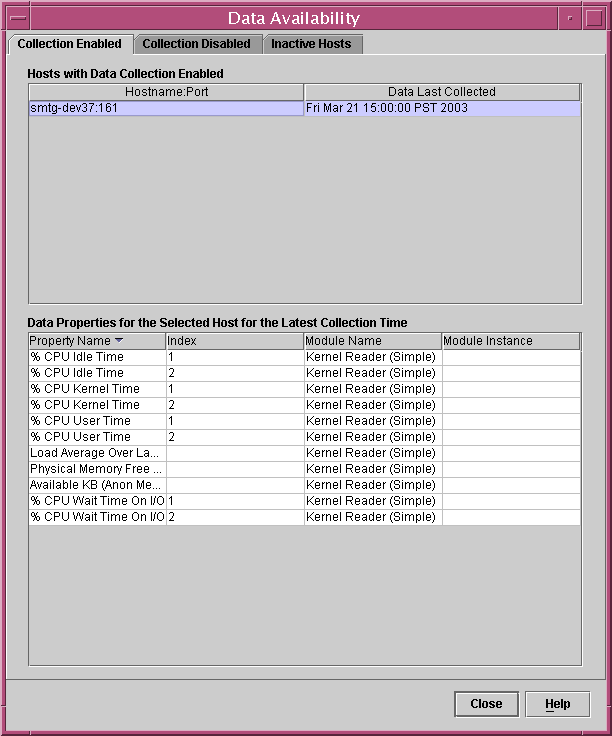
Only those data properties that are being logged on the agent machine can return data for reports. Data logging must be enabled for these properties. The Data Availability dialog box enables you to check data properties per host for which logging is enabled. Information for inactive hosts is also provided. Inactive hosts are those that may no longer be in the topology, or may not be in the server context, but that still have historical data in the database.
Information is available from the following three tabs: Collection Enabled, Collection Disabled, and Inactive Hosts. Each tab contains two tables. The first table lists the host name with corresponding port, and the latest time data was collected. The second table lists information about the data properties, including the property name, index number, module name, and module instance. Properties for which data was collected in the last collection cycle for the host is displayed. The table expands to list all the data properties collected for that host. You can resize the columns by dragging the cell borders in the column title. You can sort the table by double-clicking the column headings.
The information in the tables is updated every hour, except for Inactive Hosts or hosts for which collection has been disabled. If you have just installed Performance Reporting Manager, the data might take an hour to first appear in the Data Availability dialog box.
Note –
The data properties being logged are used for performance reports only.
To View the Data Properties Logged for a Host
-
From the Report Manager file menu, choose Data, and then select Data Availability.
The Data Availability dialog box opens.
-
Select the desired tab.
-
Collection Enabled – Select for information about hosts that have data collection enabled.
-
Collection Disabled – Select for information about hosts that have data collection disabled.
-
Inactive Hosts – Select for information about hosts that are no longer active and for which historical data is still available.
-
-
From the first table, select the row for the desired host.
The data properties for that host are displayed in the second table.
-
Click Close to dismiss the dialog box.
The following figure shows a sample of the Data Availability dialog box.
Figure 4–2 Sample of the Data Availability Dialog Box with Data Properties Showing

Data Properties Selection
When creating your custom report request, the report template requires that you select the data properties to include in the report.
The addition of certain properties requires that you provide an entry for either the module instance or property instance, or both. The module instance is needed only for multi-instance modules. Examples of a multi-instance module include File Monitoring or Directory Monitoring. Each instance can be used for monitoring a different file or different directory.
The property instance typically refers to an instance name given to the property being logged. For example, in a machine with four CPUs, the CPUs can be numbered 0, 1, 2, and 3. If you want the performance of CPU number 3, you specify 3 as the property instance for the CPU property. You specify All as the property instance when you want a report that includes all instances that exist for the host. For more information, see Sun Management Center 3.5 User's Guide
To Add Data Properties
-
From the Data Properties field in the New Report Request template, click Edit.
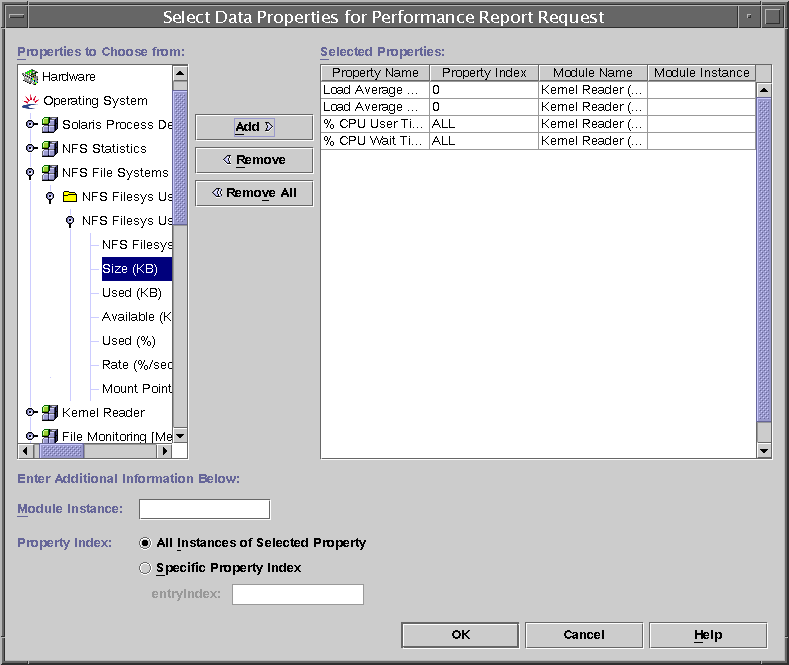
The Select Data Properties dialog box appears. It contains two panes. The left pane is titled Properties to Choose From. The right pane is titled Selected Properties.
-
Expand the hierarchy view in the left pane by clicking the key symbols.
The data properties are located at the third level of the hierarchy.
-
Select the desired property, and click Add.
The property moves to the right pane. If required, the Module Instance or Specific Property Index fields become active in the lower left corner of the dialog box.
-
(Optional) Provide the Module Instance and Specific Property Index in their respective text fields.
If module is a multiple instance module, provide the module instance wanted.
-
When you finish adding all desired properties, click OK.
The Select Data Properties dialog box closes. Continue completing the report template.
The figure below shows a sample of the Select Data Properties dialog box for performance reports.
Figure 4–3 Sample of the Select Data Properties Dialog Box for a Performance Report Request

Data Properties Logging
You can either enable the logging of a single data property, or you can enable the logging of many data properties on many hosts at the same time. The second method is called group logging, and is done by using the Manage Jobs features of Sun Management Center 3.5. For more information about group logging, see Group Logging.
You must enable the logging of a single data property from the Sun Management Center 3.5 console.
To Enable Logging of a Single Data Property
-
From the Sun Management Center 3.5 console window, select the host name from the hierarchy.
The Details window appears.
-
From the left pane, select the desired module from the hierarchy view.
The hierarchy view expands to reveal table names underneath.
-
Double-click the desired table name.
A table appears in the right pane. Each row contains a data property. More than one table can appear, depending upon the module.
-
Highlight the row containing the desired data property, and press mouse button 3.
A pop-up menu appears.
-
Select Attribute Editor.
The Attribute Editor dialog box appears.
-
Select the History tab.
-
Place a check in the Save History as Disk File box.
-
From the File Type drop-down menu, select Circular File.
-
Click OK to close.
Data logging is now enabled on the data property.
Group Logging
Use the Manage Jobs features of Sun Management Center 3.5 to enable logging of the same data properties on a group of agent machines. This is called group logging. Instead of adding the same set of data properties to be logged on each machine individually, you can save time with group logging by using the Manage Jobs dialog box to do the following:
-
Create a data logging task.
-
Create a job that contains the data logging task.
-
Running the job.
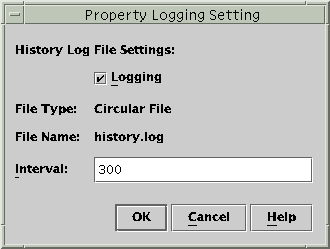
After you install the Performance Reporting Manager software, the Manage Jobs features of Sun Management Center 3.5 are enhanced, and a new option appears in the New Task dialog box. This new option is Data Logging. Data Logging appears in the Show Task Type and Task Type drop-down menus. When Data Logging is selected as the Task Type, the Logging Setting button appears next to the Data Properties table. The logging of data properties is enabled with the Property Logging Setting dialog box. You access the Property Logging Setting dialog box from the Logging Setting button. You can also change the interval time properties are logged at the same time. The default logging interval is 300 seconds. For more information about the Manage Jobs features, see “Managing Group-related Jobs” in Sun Management Center 3.5 User's Guide.
To Create a Data Logging Task
-
From the Sun Management Center 3.5 main console File menu, choose Tools, then select Manage Jobs.
The Manage Jobs dialog box appears.
-
From the Task field, click New Task.
The New Task dialog box appears.
-
Type the name of the new task in the Task Name text field.
-
From the Task Type drop-down list, select Data Logging.
-
Click Add Properties.
The Select Data Properties dialog box appears.
-
From the Properties to Choose From panel, select the data properties one property at a time. Click Add after each property.
The data properties are contained in the third-level in the hierarchy. As each data property is added, the name moves to the right pane. Provide the Module Instance and Property Index information when required.
-
Click OK when done.
The data properties are added to the task.
-
From the New Task dialog box, select the row that contains the data property.
If you added more than one data property to the task, you must do this one row at a time. The Logging Setting button is enabled.
-
The Property Logging Setting dialog box launches.

-
Select the checkbox next to Logging if it is not already selected.
The data property is now being logged.
-
Type the desired time interval, in seconds, in the Interval text field.
The default is 300 seconds. The data property is logged at the interval specified.
-
Click OK to save your changes.
The Property Setting Dialog box is dismissed.
-
In the New Task dialog box, click Add Task to save.
-
To dismiss the New Task dialog box when finished, click Close.
To Define a Job
-
For the detailed steps, see “To Define a Job” in Sun Management Center 3.5 User's Guide.
Note –When specifying the task in step 6 of the To Define a Job procedure, click Data Logging. Be sure to select the Data Logging task that you defined to enable logging. Data logging is enabled when the job is actually executed. Follow the remainder of the procedure.
To Disable Logging of a Single Data Property
-
Launch the Attribute Editor dialog box by completing Steps 1 through 7 of To Enable Logging of a Single Data Property.
-
Remove the check from the Save History as Disk File box.
-
Click OK to save the change.
Logging of the data property is now disabled.
To Disable Data Logging in a Data Logging Task
-
From the Sun Management Center 3.5 main console File menu, choose Tools, then select Manage Jobs.
The Manage Jobs dialog box appears.
-
From the Task field, click New Task.
The New Task dialog box appears.
-
Type the name of the new task in the Task Name text field.
-
From the Task Type drop-down list, select Data Logging.
-
Click Add Properties.
The Select Data Properties dialog box appears.
-
From the Properties to Choose From panel, select the data properties one property at a time. Click Add after each property.
The data properties are contained in the third-level in the hierarchy. As each data property is added, the name moves to the right pane. Provide the Module Instance and Property Index information when required.
-
Click OK when done.
The data properties are added to the task.
-
From the New Task dialog box, select the row that contains the data property.
If you added more than one data property to the task, you must do this one row at a time. The Logging Setting button is enabled.
-
Click Logging Setting.
The Property Logging Setting dialog box launches.
-
Remove the check in the box next to Logging by deselecting it.
-
In the New Task dialog box, click Add Task to save.
-
Click Close to dismiss the New Task dialog box when finished.
Note –
You must define a job with this task to complete the disabling of data logging. For the detailed steps, see “To Define a Job” in Sun Management Center 3.5 User's Guide When specifying the task in step 6 of the To Define a Job procedure, select the Data Logging task that you defined to disable data logging. Data logging is disabled when the job is actually executed.
- © 2010, Oracle Corporation and/or its affiliates
