Line Graph Report
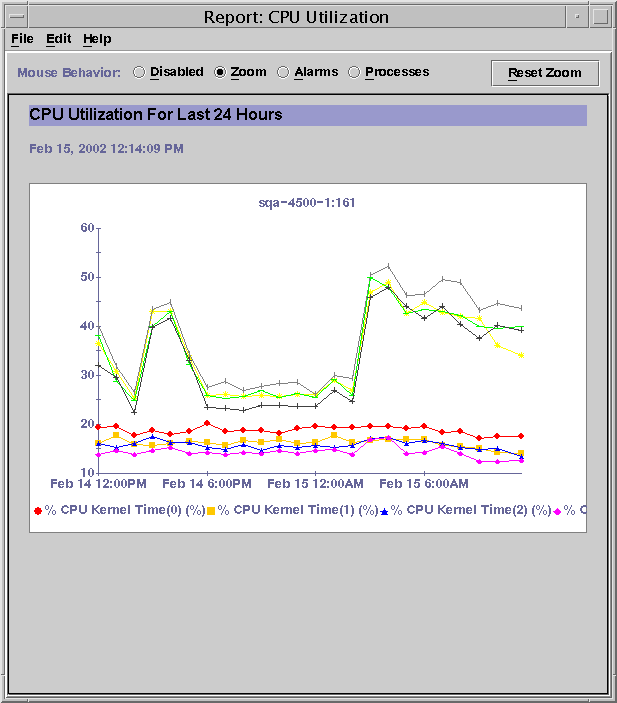
The line graph report option returns data as graphs with line plots. The line graph icon is a graph with a climbing, jagged line. The number of graphs contained in each report depends on the Graph Orientation option selected in the report request.
When the Real Time range is selected for a report, the graph refreshes according to the refresh interval of the properties being logged. For Real Time reports, only the last hour of data is visible on the graph at any point in time.
Each line graph report has several viewing options. For example, you can use the Zoom button to view finer, more granular data for any point on a line. The Alarms button enables you to obtain the alarm detail for any host included in the report. The Processes button similarly enables you to obtain the top ten CPU processes and the top ten memory processes for any host in the report. For more information, see Line Graph Report Viewing Options.
The following figure shows a sample of a line graph report.
Figure 1–1 Sample Line Graph from a Standard Performance Report

- © 2010, Oracle Corporation and/or its affiliates
