System Monitoring and Alert Management
|
|
Topics
|
|
Description
|
Links
|
|
Learn about system monitoring and management features in ILOM
|
|
|
Learn about managing system alerts in ILOM
|
|
|
Related Topics
|
|
For ILOM
|
Section
|
Guide
|
|
|
- Monitoring System Components
- Managing System Components
- Managing System Alerts
|
Oracle Integrated Lights Out Manager (ILOM) 3.0 CLI Procedures Guide (820-6412)
|
|
|
- Monitoring System Components
- Managing System Components
- Managing System Alerts
|
Oracle Integrated Lights Out Manager (ILOM) 3.0 Web Interface Procedures Guide (820-6411)
|
|
|
- Monitoring System Components
- Managing System Alerts
|
Oracle Integrated Lights Out Manager (ILOM) 3.0 Management Protocols Reference Guide (820-6413)
|
|
The ILOM 3.0 Documentation Collection is available at: http://docs.sun.com/app/docs/prod/int.lights.mgr30#hic
|
System Monitoring
The system monitoring features in ILOM enable you to easily determine the health of the system and to detect errors, at a glance, when they occur. For instance, in ILOM you can:
- View instantaneous sensor readings about system component temperatures, current, voltage, speed, and presence. For more information, see Sensor Readings.
- Determine the state of indicators throughout the system. For more information, see System Indicators.
- Monitor the state of system components. For more information, see Component Management.
- Monitor the health of system components, as well as diagnose hardware failures, see Fault Management.
- Clear faults after replacement of faulty components, see Clear Faults After Replacement of Faulted Components on Server or CMM.
- Identify system errors and view event information in the ILOM event log. For more information, see ILOM Event Log.
- Combine and view events from multiple instances in ILOM by sending Syslog information. For more information, see Syslog Information.
- Collect data for use by Oracle Services personnel to diagnose system problems. For more information, see Collect SP Data to Diagnose System Problems.
Sensor Readings
All Oracle Sun server platforms are equipped with a number of sensors that measure voltages, temperatures, fan speeds, and other attributes about the system. Each sensor in ILOM contains nine properties describing various settings related to a sensor such as sensor type, sensor class, sensor value, as well as the sensor values for upper and lower thresholds.
ILOM regularly polls the sensors in the system and reports any events it encounters about sensor state changes or sensor threshold crossings to the ILOM event log. Additionally, if an alert rule was enabled in the system that matched the crossing threshold level, ILOM would automatically generate an alert message to the alert destination that you have defined.
You can view sensor readings from the ILOM web interface or CLI. For details, see “View Sensor Readings” in one of the following guides:
- Oracle Integrated Lights Out Manager (ILOM) 3.0 CLI Procedures Guide
- Oracle Integrated Lights Out Manager (ILOM) 3.0 Web Interface Procedures Guide
System Indicators
System indicator LEDs are generally illuminated on the system by ILOM based on the server platform policy. Typically the system indicator LEDs are illuminated by ILOM when any of the following conditions occur:
- Fault or error is detected on a component.
- Field-replacement unit (FRU) requires service.
- Hot-plug module is ready for removal.
- Activity is occurring on FRU or system.
You can view the states of system indictors from the ILOM web interface or the CLI. Additionally, in some instances, you might be able to modify the state of a system indicator. For details, see the section about View and Manage System Indicators in one of the following guides:
- Oracle Integrated Lights Out Manager (ILOM) 3.0 CLI Procedures Guide
- Oracle Integrated Lights Out Manager (ILOM) 3.0 Web Interface Procedures Guide
Supported System Indicator States
ILOM supports the following system indicator states:
- Off - Normal operating status. Service is not required.
- Steady On - Component is ready for removal.
- Slow Blink - Component is changing state.
- Fast Blink - Helps locate a system in a data center.
- Standby Blink - Component is ready for activation, but is not operational at this time.
Types of System Indicator States
ILOM supports two types of system indicator states: customer changeable and system assigned.
- Customer Changeable States - Some system indicator LEDs in ILOM offer customer changeable states. Typically, these types of system indicators provide operational states of various system components. The type of states presented is determined by the system indicator. For example, depending on the system indicator, the following customer changeable states might be present:
- Off - Normal operating status. Service is not required.
- Fast Blink - Helps locate system in a data center.
- System Assigned States - System assigned indicators are not customer configurable. These types of system indicators provide read-only values about the operational state of a component. On most Oracle Sun server platforms, system assigned indicators are Service Action Required LEDs. These types of LEDs are typically illuminated when any of the following conditions are detected:
- Fault or error is detected on a system component.
- Hot-plug module is ready for removal.
- Field-replacement unit (FRU) requires service.
Component Management
The Component Management features in ILOM enable you to monitor the state of various components that are installed on the server or managed by the Chassis Monitoring Module (CMM). For example, by using the Component Management features, you can:
- Identify the component name and type.
- Identify and change the component state (enabled or disabled).
- Identify the component’s fault status and, if necessary, clear the fault.
- Prepare to install or remove a component.
- Filter the component management display by Fault Status, Component State, Hardware Type, and Ready to Remove Status. Or, create a Custom Filter to filter the component management display by Component or FRU Name, Component or FRU part number, Ready to Remove Status (Ready or Not Ready), and Fault Status (OK or Faulted).
Depending on the component type, you can view the component information or you can view and modify the state of component.
The Component Management features are supported in both the ILOM Web Interface and command-line interface (CLI) for x86 systems server SPs, SPARC systems server SPs, and CMMs. For detailed instructions for managing system components from the ILOM web interface or the CLI, see the following guides:
- Oracle Integrated Lights Out Manager (ILOM) 3.0 CLI Procedures Guide
- Oracle Integrated Lights Out Manager (ILOM) 3.0 Web Interface Procedures Guide
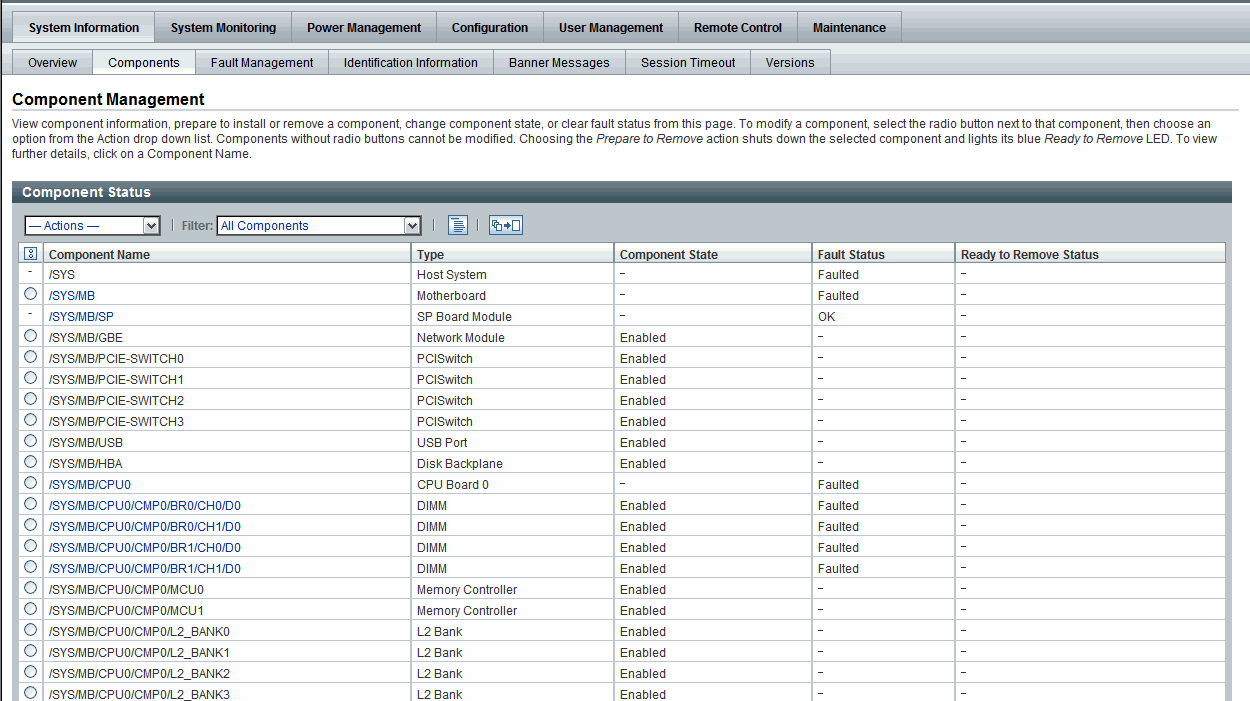
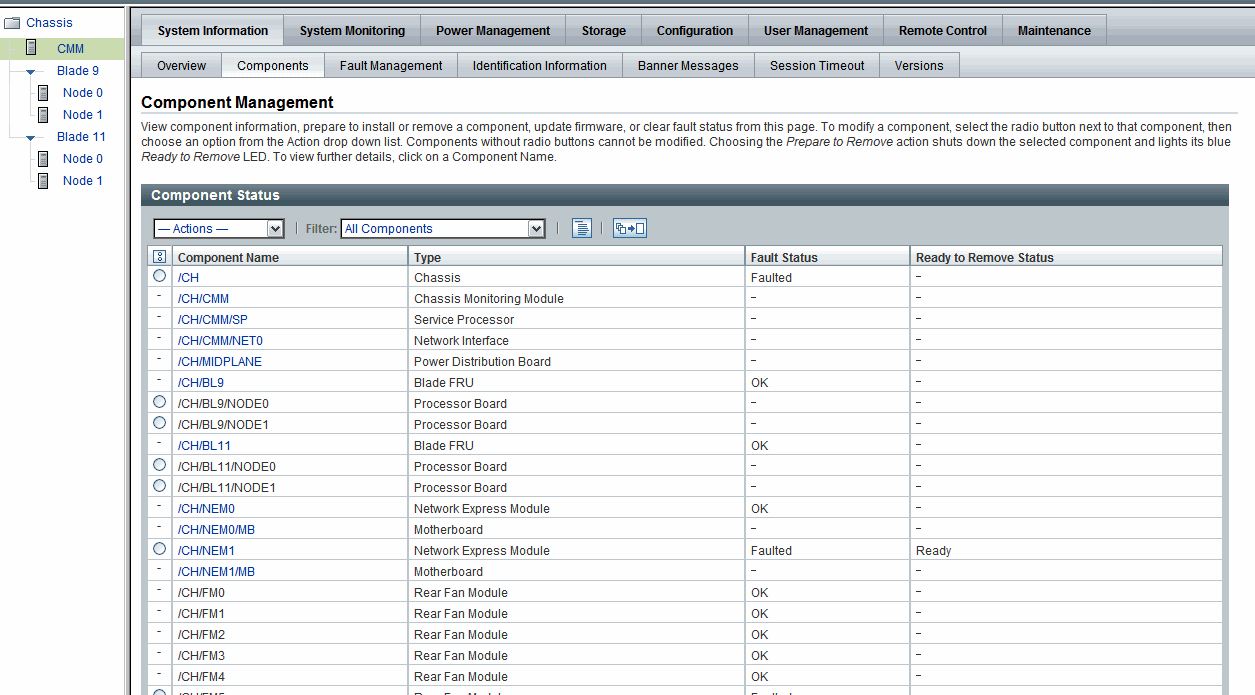
ILOM web interface examples of the Component Management features for a server SP and CMM are shown in the following figures.
FIGURE 4-1 Server SP Component Management Features in Web Interface

FIGURE 4-2 CMM Component Management Features in Web Interface

Fault Management
Most Oracle Sun server platforms support the fault management software feature in ILOM. This feature enables you to proactively monitor the health of your system hardware, as well as diagnose hardware failures as they occur. In addition to monitoring the system hardware, the fault management software monitors environmental conditions and reports when the system's environment is outside acceptable parameters. Various sensors on the system components are continuously monitored. When a problem is detected, the fault management software automatically:
- Illuminates the Server Action Required LED on the faulted component.
- Updates the ILOM management interfaces to reflect the fault condition.
- Records information about the fault in the ILOM event log.
The type of system components and environmental conditions monitored by the fault management software are determined by the server platform. For more details about which components are monitored by the fault management software, consult your Sun server platform documentation.
| Note - The ILOM fault management feature is currently available on all Sun server platforms, with the exception of the Sun Fire X4100 or X4200 series servers.
|
You can view the status of faulted components from the ILOM web interface or CLI. For details, see “View Fault Status” in one of the following guides:
- Oracle Integrated Lights Out Manager (ILOM) 3.0 CLI Procedures Guide
- Oracle Integrated Lights Out Manager (ILOM) 3.0 Web Interface Procedures Guide
Clear Faults After Replacement of Faulted Components on Server or CMM
The ILOM-based service processor (SP) receives error telemetry about error events that occur within the major system components on the host (CPU, memory, and I/O hub) and the environmental subsystem within the chassis (such as fans, power supplies, and temperature). The components and conditions are then diagnosed as fault events and captured in the ILOM event log.
As of ILOM 3.0.3, the steps that are necessary to clear a fault are largely dependent on the type of server platform you are using (server module versus rackmount server). For example:
- ILOM-based faults that occur on a server module are NOT persistent once the server module has been properly prepared for removal and is physically removed from the chassis. Therefore, no service actions are required to clear the fault after the component is physically replaced. The fault message is captured in the ILOM event log for historical purposes.
- ILOM-based faults that occur on a rackmount server ARE persistent and might require service actions to clear the fault after the component is physically replaced, unless the component is a hot-swappable component (such as a fan or power supply). Hot-swappable components are platform-specific; therefore, refer to the platform documentation for a list of the hot-swappable components. The fault message is captured in the ILOM event log for historical purposes. On a rackmount server, you must manually clear the following faults after physically replacing the components, which are not hot-swappable:
- CPU fault
- DIMM (memory module) fault
- PCI card fault
- Motherboard fault (if the motherboard is not being replaced)
- ILOM-based faults that occur on components installed in a chassis containing CMM(s) are automatically cleared by the ILOM CMM when the faulted component is replaced. However, if the chassis-level component is not hot-serviceable, then the fault needs to be manually cleared from the ILOM CMM.
In particular, the CMM automatically clears faults on the following chassis-level components after the faulted components are replaced:
- CMM fault
- Fan fault
- Power supply fault
- Network express module (NEM) fault
- PCI express module fault
| Note - For more information about the ILOM fault management features offered on your system, refer to the procedures guides in the ILOM 3.0 Documentation Collection and the documentation provided with your Oracle server platform.
|
For instructions about clearing a fault using the ILOM CLI or web interface, see the following guides:
- Oracle Integrated Lights Out Manager (ILOM) 3.0 CLI Procedures Guide
- Oracle Integrated Lights Out Manager (ILOM) 3.0 Web Interface Procedures Guide
ILOM Event Log
The ILOM event log enables you to view information about any event that occurred on the system. Some of these events include ILOM configuration changes, software events, warnings, alerts, component failure, as well as IPMI, PET, and SNMP events. The type of events recorded in the ILOM event log is determined by the server platform. For information about which events are recorded in the ILOM event log, consult your Sun server platform documentation.
Event Log Time Stamps and ILOM Clock Settings
ILOM captures time stamps in the event log based on the host server UTC/GMT timezone. However, if you view the event log from a client system that is located in a different timezone, the time stamps are automatically adjusted to the timezone of the client system. Therefore, a single event in the ILOM event log might appear with two timestamps.
In ILOM, you can choose to manually configure the ILOM clock based on the UTC/GMT timezone of the host server, or you can choose to synchronize the ILOM clock with other systems on your network by configuring the ILOM clock with an NTP server IP address.
Manage Event Log and Time Stamps From CLI, Web, or SNMP Host
You can view and manage the event log and time stamps in ILOM from the CLI, web interface, or an SNMP host. For details, see “Configure Clock Settings” and “Filter Event Log Output” in the following guides:
- Oracle Integrated Lights Out Manager (ILOM) 3.0 CLI Procedures Guide
- Oracle Integrated Lights Out Manager (ILOM) 3.0 Web Interface Procedures Guide
Syslog Information
Syslog is a standard logging utility used in many environments. Syslog defines a common set of features for logging events and also a protocol for transmitting events to a remote log host. You can use syslog to combine events from multiple instances of ILOM within a single place. The log entry contains all the same information that you would see in the local ILOM event log, including class, type, severity, and description.
For information about configuring ILOM to send syslog to one or two IP addresses, see “Configure Remote Syslog Receiver IP Addresses” in one of the following guides:
- Oracle Integrated Lights Out Manager (ILOM) 3.0 CLI Procedures Guide
- Oracle Integrated Lights Out Manager (ILOM) 3.0 Web Interface Procedures Guide
- Oracle Integrated Lights Out Manager (ILOM) 3.0 Management Protocols Reference Guide
Collect SP Data to Diagnose System Problems
The ILOM Service Snapshot utility enables you to produce a snapshot of the SP at any instant in time. You can run the utility from the ILOM CLI or the web interface. For more information about collecting SP data to diagnose system problems, see Collect SP Data to Diagnose System Problems.
Alert Management
ILOM supports alerts in the form of IPMI PET alerts, SNMP Trap alerts, and Email Notification alerts. Alerts provide advance warning of possible system failures. Alert configuration is available from the ILOM SP on your server.
Each Sun server platform is equipped with a number of sensors that measure voltages, temperatures, and other service-related attributes about the system. ILOM automatically polls these sensors and posts any events crossing a threshold to an ILOM event log, as well as generates alert message(s) to one or more customer-specified alert destinations. The alert destination specified must support the receipt of the alert message (IPMI PET or SNMP). If the alert destination does not support the receipt of the alert message, the alert recipient will be unable to decode the alert message.

|
Caution - ILOM tags all events or actions with LocalTime=GMT (or UTC). Browser clients show these events in LocalTime. This can cause apparent discrepancies in the event log. When an event occurs in ILOM, the event log shows it in UTC, but a client would show it in LocalTime. For more information about ILOM timestamps and clock settings, see Event Log Time Stamps and ILOM Clock Settings.
|
Alert Rule Configuration
In ILOM you can configure up to 15 alert rules using the ILOM web interface or CLI. For each alert rule you configure in ILOM, you must define three or more properties about the alert depending on the alert type.
The alert type defines the messaging format and the method for sending and receiving an alert message. ILOM supports these three alert types:
- IPMI PET alerts
- SNMP Trap alerts
- Email Notification alerts
All Sun server platforms support all three alert types.
Alert Rule Property Definitions
ILOM offers the following property values for defining an alert rule:
- Alert Type
- Alert Level
- Alert Destination
- Alert Destination Port
- Email Custom Sender
- Email Message Prefix
- Email Class Filter
- Email Type Filter
- SNMP Version (SNMP Trap alerts only)
- SNMP Community Name or User Name (SNMP Trap alerts only)
For information about each of these property values, see TABLE 4-1.
TABLE 4-1 Properties for Defining Alert Rules
|
Property Name
|
Requirement
|
Description
|
|
Alert Type
|
Mandatory
|
The alert type property specifies the message format and the delivery method that ILOM will use when creating and sending the alert message. You can choose to configure one of the following alert types:
- IPMI PET Alerts. IPMI Platform Event Trap (PET) alerts are supported on all Sun server platforms and CMMs.
For each IPMI PET alert you configure in ILOM, you must specify an IP address for an alert destination and one of four supported alert levels. Note that the alert destination specified must support the receipt of IPMI PET messages. If the alert destination does not support the receipt of IPMI PET messages, the alert recipient will not be able to decode the alert message.
- SNMP Trap Alerts. ILOM supports the generation of SNMP Trap alerts to a customer-specified IP destination. All destinations specified must support the receipt of SNMP Trap messages.
Note that SNMP Trap alerts are supported on rackmounted servers and blade server modules.
- Email Notification Alerts. ILOM supports the generation of Email Notification alerts to a customer-specified email address. To enable the ILOM client to generate Email Notification alerts, ILOM initially requires you to configure the name of the outgoing SMTP email server that would be sending the Email alert messages.
|
|
Alert Destination
|
Mandatory
|
The alert destination property specifies where to send the alert message. The alert type determines which destination you can choose to send an alert message. For example, IPMI PET and SNMP Trap alerts must specify an IP address destination. Email Notification alerts must specify an email address.
If the proper format is not entered for an alert destination, ILOM will report an error.
|
|
Alert Destination Port
|
Optional
|
The alert destination port only applies when the alert type is an SNMP Trap. The destination port property specifies the UDP port to which SNMP Trap alerts are sent.
|
|
Alert Level
|
Mandatory
|
Alert levels act as a filter mechanism to ensure alert recipients only receive the alert messages that they are most interested in receiving. Each time you define an alert rule in ILOM, you must specify an alert level.
The alert level determines which events generate an alert. The lowest level alert generates alerts for that level and for all alert levels above it.
ILOM offers the following alert levels with Minor being the lowest alert offered:
- Minor. This alert level generates alerts for informational events, lower and upper non-critical events, upper and lower critical events, and, upper and lower non-recoverable events.
- Major. This alert level generates alerts for upper and lower non-critical events, upper and lower critical events, and, upper and lower non-recoverable events.
- Critical. This alert level generates alerts for upper and lower critical events and upper and lower non-recoverable events.
- Down. This alert level generates alerts for only upper non-recoverable and lower non-recoverable events.
- Disabled. Disables the alert. ILOM will not generate an alert message.
All the alert levels will enable the sending of a alert with the exception of Disabled.
Important - ILOM supports alert level filtering for all IPMI traps and Email Notification traps. ILOM does not support alert level filtering for SNMP traps. To enable the sending of an SNMP trap (but not filter the SNMP trap by alert level) you can choose anyone of the following options: Minor, Major, Critical, or Down. To disable the sending of an SNMP trap, you must choose the Disabled option.
|
|
Email Custom Sender
|
Optional
|
The email custom sender property applies only when the alert type is an email alert. You can use the email_custom_sender property to override the format of the “from” address. You can use either one of these substitution strings: <IPADDRESS> or <HOSTNAME>; for example, alert@[<IPADDRESS>]. Once this property is set, this value will override any SMPT custom sender information.
|
|
Email Message Prefix
|
Optional
|
The email message prefix property applies only when the alert type is an email alert. You can use the email_message_prefix property to prepend information to the message content.
|
|
Event Class Filter
|
Optional
|
The event class filter property applies only when the alert type is an email alert. The default setting is to send every ILOM event as an email alert. You can use the event_class_filter property to filter out all information except the selected event class. You can use ““ (empty double quotes) to clear the filter and send information about all classes.
|
|
Event Type Filter
|
Optional
|
The event type filter property applies only when the alert type is an email alert. You can use the event_type_filter property to filter out all information except the event type. You can use ““ (empty double quotes) to clear the filter and send information about all event types.
|
|
SNMP Version
|
Optional
|
The SNMP version property enables you to specify which version of an SNMP trap that you are sending. You can choose to specify: 1, 2c, or 3.
This property value only applies to SNMP Trap alerts.
|
|
SNMP Community Name
or
User Name
|
Optional
|
The SNMP community name or user name property enables you to specify the community string or SNMP v3 user name used in the SNMP Trap alert.
- For SNMP v1 or v2c, you can choose to specify a community name value for an SNMP alert.
- For SNMP v3, you can choose to specify a user name value for an SNMP alert.
Note - If you choose to specify an SNMP v3 user name value, you must define this user in ILOM as an SNMP user. If you do not define this user as an SNMP user, the trap receiver will not be able to decode the SNMP Trap alert. For more information about defining an SNMP user in ILOM, see the Oracle Integrated Lights Out Manager (ILOM) 3.0 CLI Procedures Guide, or the Oracle Integrated Lights Out Manager (ILOM) 3.0 Web Interface Procedures Guide.
|
Alert Management From the CLI
You can enable, modify, or disable any alert rule configuration in ILOM from the command-line interface (CLI). All 15 alert rule configurations defined in ILOM are disabled by default. To enable alert rule configurations in ILOM, you must set values for the following properties: alert type, alert level, and alert destination.
You can also generate test alerts to any enabled alert rule configuration in ILOM from the CLI. This test alert feature enables you to verify that the alert recipient(s) specified in an enabled alert rule configuration receives the alert message.
For additional information about how to manage alerts using the ILOM CLI, see “Managing System Alerts” in the Oracle Integrated Lights Out Manager (ILOM) 3.0 CLI Procedures Guide.
Alert Management From the Web Interface
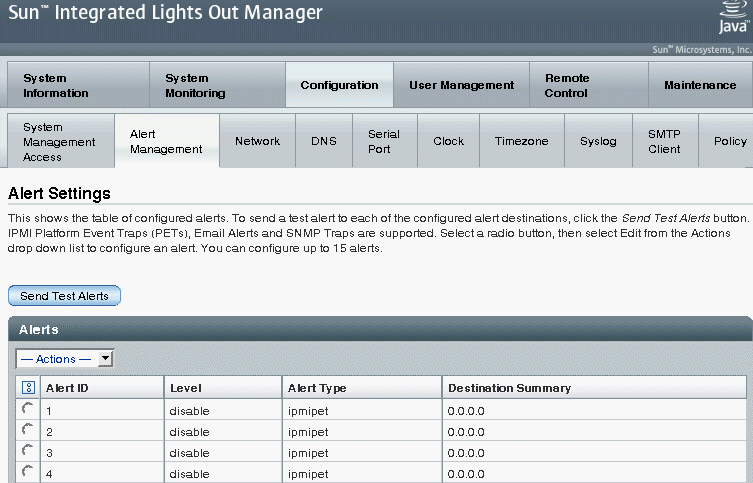
You can enable, modify, or disable any alert rule configuration in ILOM from the Alert Settings web interface page. All 15 alert rule configurations presented on this page are disabled by default. The Actions drop-down list box on the page enables you to edit the properties associated with an alert rule. To enable an alert rule on this page, you must define an alert type, alert level, and a valid alert destination.
The Alert Settings page also presents a Send Test Alert button. This test alert feature enables you to verify that each alert recipient specified in an enabled alert rule receives an alert message.
FIGURE 4-3 Alert Settings Page

For additional information about how to manage alerts using the ILOM web interface, see “Managing System Alerts” in the Oracle Integrated Lights Out Manager (ILOM) 3.0 Web Interface Procedures Guide.
Alert Management From an SNMP Host
You can use the get and set commands to view and configure alert rule configurations using an SNMP host.
Before you can use SNMP to view and configure ILOM settings, you must configure SNMP. For more information about how to use SNMP to manage system alerts, see “Managing System Alerts” in the Oracle Integrated Lights Out Manager (ILOM) 3.0 Management Protocols Reference Guide.
| Oracle Integrated Lights Out Manager (ILOM) 3.0 Concepts Guide
|
820-6410-12
|
   
|
Copyright © 2010, Oracle and/or its affiliates. All rights reserved.
