| C H A P T E R 3 |
|
Using the ILOM Service Processor GUI to View System Information |
This appendix contains information about using the Integrated Lights Out Manager (ILOM) service processor (SP) GUI to view monitoring and maintenance information for your server. It includes the following sections:
For more information on using the ILOM SP GUI to maintain the server (for example, configuring alerts), refer to the Integrated Lights Out Manager Administration Guide, 819-1160.
To make a serial connection to the SP:
1. Connect a serial cable from the RJ-45 Serial Management port on your ILOM SP to a terminal device.
2. Press ENTER on the terminal device to establish a connection between that terminal device and the ILOM SP.
| Note - If you are connecting to the serial port on the SP before it has been powered up or during its power-up sequence, you will see bootup messages displayed. |
The service processor eventually displays a login prompt. For example:
The first string in the prompt is the default host name for the ILOM SP. It consists of the prefix SUNSP and the MAC address of the ILOM SP. The MAC address for each ILOM SP is unique.
3. Log in to the SP and type the default user name, root, with the default password, changeme.
Once you have successfully logged in to the SP, it displays its default command prompt.
4. To start the serial console, type the following commands:
5. Determine whether you successfully connected to the SP:
Events are notifications that occur in response to some actions. The IPMI system event log (SEL) provides status information about the Sun Fire X4500 server’s hardware and software to the ILOM software, which displays the events in the ILOM web GUI. To view event logs:
1. Log in to the SP as Administrator or Operator to reach the ILOM web GUI:
a. Type the IP address of the server’s SP into your web browser.
The Sun Integrated Lights Out Manager Login screen is displayed.
b. Type your user name and password.
When you first try to access the ILOM SP, you are prompted to type the default user name and password. The default user name and password are:
Default user name: root
Default password: changeme
2. From the System Monitoring tab, select Event Logs.
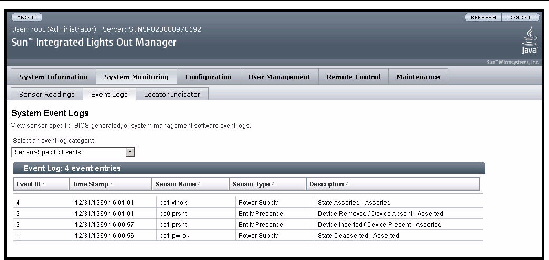
The System Event Logs page is displayed. See FIGURE 3-1 for a page that shows sample information.
FIGURE 3-1 System Event Logs Page

3. Select a category of event that you want to view in the log from the drop-down menu.
You can select from the following types of events:
After you have selected a category of event, the Event Log table is updated with the specified events. The fields in the Event Log are described in TABLE 3-1.
|
The day and time the event occurred. If the Network Time Protocol (NTP) server is enabled to set the SP time, the SP clock will use Universal Coordinated Time (UTC). For more information about time stamps, see Interpreting Event Log Time Stamps. |
|
|
The name of a component for which an event was recorded. The sensor name abbreviations correspond to the following components: |
|
4. To clear the event log, click the Clear Event Log button.
A confirmation dialog box is displayed.
5. Click OK to clear all entries in the log.
6. If the problem with the server is not evident after viewing ILOM SP logs and information, continue with Running SunVTS Diagnostic Tests.
The system event log time stamps are related to the service processor clock settings. If the clock settings change, the change is reflected in the time stamps.
When the service processor reboots, the SP clock is set to Thu Jan 1 00:00:00 UTC 1970. The SP reboots as a result of the following:
After an SP reboot, the SP clock is changed by the following:
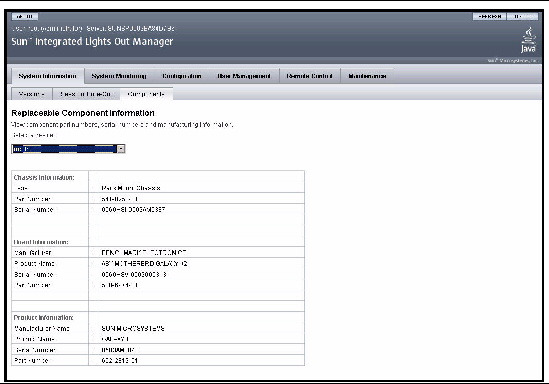
Depending on the component you select, information about the manufacturer, component name, serial number, and part number can be displayed.
To view replaceable component information:
1. Log in to the SP as Administrator or Operator to reach the ILOM web GUI:
a. Type the IP address of the server’s SP into your web browser.
The Sun Integrated Lights Out Manager Login screen is displayed.
b. Type your user name and password.
When you first try to access the ILOM Service Processor, you are prompted to type the default user name and password. The default user name and password are:
Default user name: root
Default password: changeme
2. From the System Information tab, select Components.
The Replaceable Component Information page is displayed. See FIGURE 3-2.
FIGURE 3-2 Replaceable Component Information Page

3. Select a component from the drop-down list.
Information about the selected component is displayed.
4. If the problem with the server is not evident after viewing replaceable component information, continue with Running SunVTS Diagnostic Tests.
This section describes how to view the Sun Fire X4500 server temperature, voltage, and fan sensor readings.
There are a total of six temperature sensors that are monitored. They all generate IPMI events that will be logged in to the system event log (SEL) when an upper threshold is exceeded. Three of these sensor readings are used to adjust the fan speeds and perform other actions, such as illuminating LEDs and powering off the chassis. These sensors and their respective thresholds are as follows:
There are three other temperature sensors:
|
1. Log in to the SP as Administrator or Operator to reach the ILOM web GUI:
a. Type the IP address of the server’s SP into your web browser.
The Sun Integrated Lights Out Manager Login screen is displayed.
b. Type your user name and password.
When you first try to access the ILOM Service Processor, you are prompted to type the default user name and password. The default user name and password are:
Default user name: root
Default password: changeme
2. From the System Monitoring tab, select Sensor Readings.
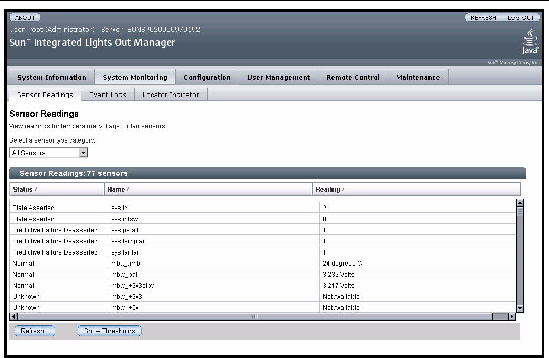
The Sensor Readings page is displayed. See FIGURE 3-3.
FIGURE 3-3 Sensor Readings Page

3. Select the type of sensor readings that you want to view from the drop-down menu.
You can select All Sensors, Temperature Sensors, Voltage Sensors, or Fan Sensors.
The sensor readings are displayed. The Sensor Readings fields are described in TABLE 3-2.
4. Click the Refresh button to update the sensor readings to their current status.
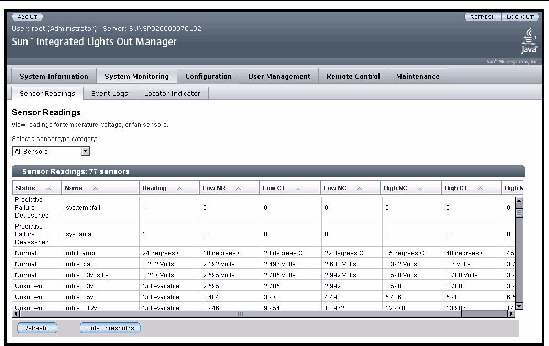
5. Click the Show Thresholds button to display the settings that trigger alerts.
The Sensor Readings table is updated. See the example in FIGURE 3-4.
For example, if system temperature reaches 30 C, the service processor will send an alert. Sensor thresholds include the following:
FIGURE 3-4 Sensor Readings Page With Thresholds Displayed

6. Click the Hide Thresholds button to revert to the sensor readings.
The sensor readings are redisplayed, without the thresholds.
7. If the problem with the server is not evident after viewing sensor readings information, continue with Running SunVTS Diagnostic Tests.
Copyright © 2009 Sun Microsystems, Inc. All rights reserved.