 To prepare the debugging environment
-
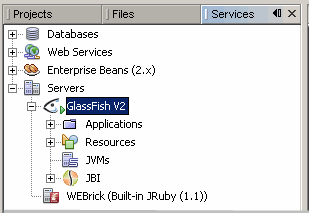
In the Services window, make sure that the GlassFish V2 Application Server is running. The Application Server is running if it has subnodes and is marked with a green triangle.
If the server is not started, right-click it and choose Start from the pop-up menu.

-
In the IDE, open the BPEL process in either the Source or Design view.
-
Set breakpoints in the BPEL process.
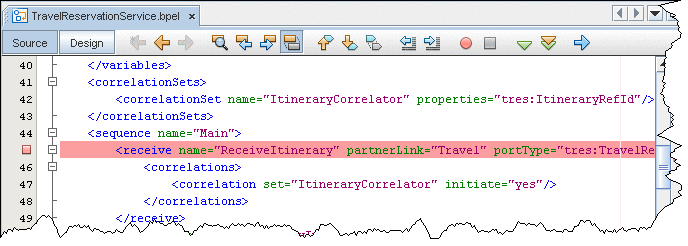
To set breakpoints in the Source view, click next to the line where you want to set the breakpoint.

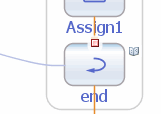
To set breakpoints on the diagram, switch to the Design view, right-click the element and choose Toggle Breakpoint from the pop-up menu. A red square appears at the top of the element with a breakpoint.

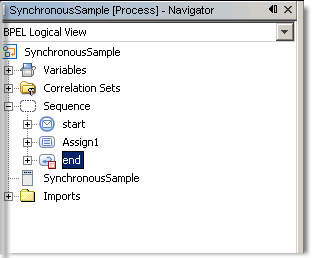
The Toggle Breakpoint pop-up menu command is also available for the elements in the Navigator BPEL Logical View. For the elements with breakpoints, the Navigator shows a small red box (ReceiveItinerary).

-
Optionally, you can add watches to monitor XPath expressions. To add a watch, copy the XPath expression you want to monitor, choose Run -> Add Watch from the main menu, and paste the expression into the Watch Expression field. Click OK.

Note –You can also add XPath expressions that are not present in the code, but that would be valuable from the debugging point of view.
- © 2010, Oracle Corporation and/or its affiliates
