BPEL Debugger Windows
When a debugging session starts, debugger windows are displayed below the editing area. The Sessions, BPEL Process Instances, BPEL Variables, and BPEL Process Execution windows contain information related to BPEL processes running within the current debugging section.
If a debugger window is not displayed, choose Window > Debugging > window-name (for example, Window > Debugging > BPEL Process Instances).
The Breakpoints and Watches are standard IDE debugger windows. They display all breakpoints and watches set in the IDE.
Sessions Window
The Sessions window lists all open debugging sessions, including Java and BPEL debugging sessions. For the BPEL Service Engine, only one session can be started. However, the Sessions window also displays other open debugging sessions, such as Java sessions. Only one of the open debugging sessions can be current, and it is shown in bold. Other debugger windows, such as BPEL Process Instances, BPEL Process Execution, and BPEL Variables, display data related only to the current debugging session.
The information provided for each session includes:
-
Name. The name of the session.
-
State. The current state of the session. Sessions can be starting or running.
-
Language. The language of the application debugged in this session.
You can perform the following actions on sessions available in the pop-up menu:
-
Make current. Makes the selected session current.
-
Finish. Finishes the selected session.
-
Finish all. Finishes all debugging sessions.

BPEL Process Instances Window
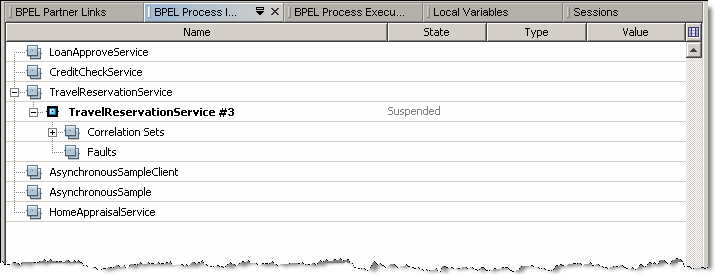
The BPEL Process Instances window lists all BPEL process instances deployed to the BPEL Service Engine and their currently running instances. For each process instance correlation sets and Faults are listed as subnodes.
If the current session is not a BPEL Debugger session, this window is empty. The BPEL Process Instances window is populated when a debugging session starts on the BPEL Service Engine, or when the current session is a BPEL Debugger session.
The information displayed for each process instance includes the instance name, unique instance ID, and its state.
Process instances can exist in one of the following states:
-
Running. The instance is currently being executed on the BPEL Service Engine.
-
Suspended. The instance has been suspended for some reason. For example, the process instance has reached a breakpoint.
-
Unknown. The status of the instance is unknown.
A process instance that is current is shown in bold. A process instance becomes current when it reaches a breakpoint or when you manually make it current.

To make a process instance current, do one of the following:
-
Double-click the process instance.
-
Right-click the process instance and choose Make Current from the pop-up menu.
To terminate a process instance:
-
Right-click the process instance and select Terminate from the pop-up menu. The process instance is terminated and removed from the list.
Correlation Sets and Faults information
For the Correlation Sets node the information comes out during the process execution.
For each process instance correlation set, a list of properties it includes is shown. For the properties, type and value information is displayed. Find more information on Correlation sets, properties, and property aliases here: Using Correlation.
Local Variables Window
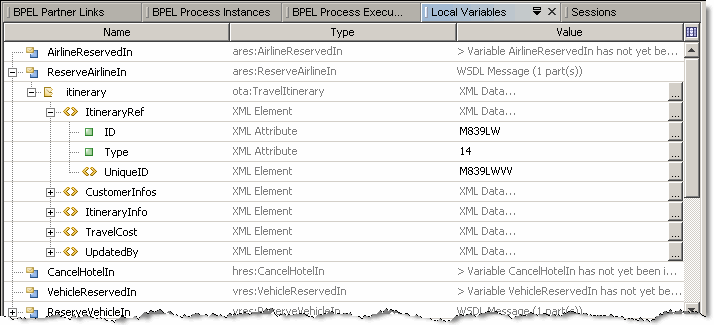
The Local Variables window shows the structure of local variables and their values for the current process instance and current position. The current position is the place where the current process instance became suspended. When you change the current process instance, the records in the Local Variables window are updated to reflect the variables for the new current process instance and the new current position.
The structure of local variables is shown as a tree. The information provided for each variable includes the variable name and value.
In the Local Variables window you can do the following:
-
View the variable structure. To do this, expand the variable node in the tree.
-
View and edit the values of variables. To edit the value of a variable, click the ellipsis (...) button and enter the new value in the editor window.
-
The structure of local variables is shown as a tree. The information provided for each variable includes the variable name and value.

Watches Window
The Watches window shows the list of XPath expressions that you want to monitor. You add watches explicitly before or during the debugging session. The Watches window shows the expression and its value. The value of the expression may change as the process advances depending on the logic of your process.

 To set watches in the BPEL process:
-
(Optional) Be sure that the Watches window is visible or choose Window -> Debugging -> Watches (Alt-Shift-2) to view it.
-
If you want to enter an XPath expression from your BPEL process, copy it using one of the following methods:
-
In the Source view, copy the XPath expression you want to watch. The XPath expressions can be found inside the <condition> tag.
-
In the Design view, select an element that has an expression and copy the expression from the Condition row in the Properties window.
-
-
Right-click inside the Watches window and choose New Watch.
-
In the Watch Expression field of the New Watch dialog box, do one of the following:
-
Paste the XPath expression you have copied.
-
Enter any valid expression that is compliant with XPath 1.1.
-
-
(Optional) If needed, add more watches.
-
Ensure that a debugging session is running and perform a test run.
-
As the process instance reaches a breakpoint and becomes suspended, examine the values of the expressions being watched in the Value column of the Watches window.
BPEL Process Execution Window
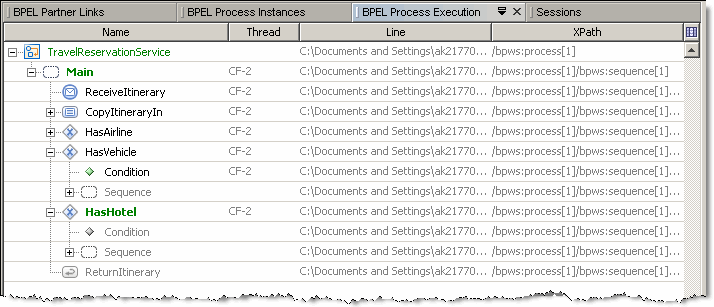
The BPEL Process Execution window graphically represents the progress of executing the current BPEL process instance in the BPEL Debugger. When you change the current process instance, the process tree in the BPEL Process Execution window is updated to reflect the state of the new current process instance and the new current position.
In the BPEL Process Execution window, the following colors are used to display the state of BPEL activities:
-
Green — The activity is being executed at the moment.
-
Gray — The activity has not been executed yet.
-
Black — The activity has been executed.
BPEL Process Execution Window displays the following information:
-
Name — The name of the activity.
-
Thread — The thread in which the activity is/was executed. For the nodes that have not yet been executed no thread information is provided.
-
Line — Contains the path to the file and the line number for the activity in the file.
-
XPath — Shows XPath expression pointing to the activity.

Note –
In the BPEL Process Execution window, you can only view the progress of executing BPEL processes. You cannot perform any actions in this window.
BPEL Partner Links Window
The Partner Links window lists the all the partner links defined in the BPEL Process.
The information provided for the partner links includes:
-
My Role
-
Partner Role: Used for two-way operations only
-
Endpoint: Endpoint information available for dynamically defined partner links only. For more information see Dynamic Partner Links and Dynamic Addressing

BPEL Debugger Console Messages
You can see the following messages in the BPEL Debugger Console:
- Connecting to <host>:<port>
-
The Debugger is attempting to connect to the BPEL service engine.
- Debug session started
-
The Debugger has successfully connected to the BPEL service engine and the debug session has started.
- Unable to start a debug session : Unable to connect to <host>:<port> : Connection timed out: connect
-
If you see this message, verify the following:
-
The GlassFish V2 Application Server is running.
-
The BPEL service engine is started.
-
The DebugEnabled property of the BPEL service engine is set to true.
-
The host name is the host name of the machine that runs the GlassFish V2 Application Server you are connecting to ( localhost by default).
-
The port value is the same as the DebugPort property of the BPEL service engine you are connecting to (3343 by default).
-
- Unable to start a debug session : Already connected to <host>:<port>
-
You already have a running debug session attached to this particular service engine.
- Debug session terminated : Target disconnected
-
The Debugger lost connection to the server. Check that the server is running and the network is up.
- Stop connecting
-
You explicitly terminated the debug session when it was connecting.
- Debug session finished
-
You explicitly terminated the debug session when it was running.
- © 2010, Oracle Corporation and/or its affiliates
