Defining Logging
When defining logging for an activity you can trace the value of the following components :
-
Variable
-
Part
-
Expression
In the mappings you can use one or more XPath functions from the menu bar.
 To log the variable value:
-
On the diagram, select an activity. The logging will be performed in connection with the activity execution.
-
Go to the Logging tab of the BPEL Editor. The Logging mapper opens. You can also open the Logging mapper by right clicking the activity and choosing Go To -> Logging (Alt-L).
-
In the source tree pane, expand the variables tree until the variable to be traced is visible.
-
In the destination tree pane expand the activity node. The nodes designating the moment of logging become visible.
-
Choose when the logging entry should be made and expand the appropriate node:
-
LOG_onStart. The variable value is written to the log when the activity starts.
-
LOG_onComplete. The variable value is written to the log when the activity execution is complete.
-
-
Define the level of logging. Drag the connection from the variable to be traced to the appropriate node in the destination tree pane. The following levels of logging are available:
-
Severe
-
Warning
-
Info
-
Config
-
Fine
-
Finer
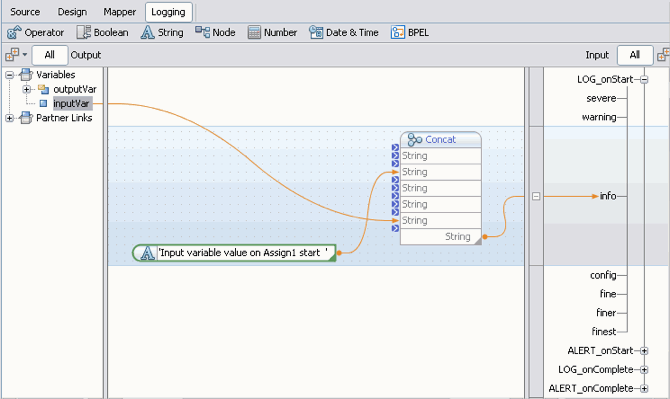
To make a search of the value recorded to the log file, you can concatenate the value with the string literal as shown on the figure below.

In the Design view a small icon appears to the lower-right of the activity when it has logging defined. By clicking the icon you can switch to the Logging mapper.

The entry to the log is only made if the log level defined for the variable corresponds to the log level specified for the BPEL Service Engine on the application server.
-
 To set the log level for the BPEL Service Engine
The log level for the BPEL Service Engine is specified in the GlassFish Admin Console. To set the log level for the BPEL Service Engine:
-
In the NetBeans Services window, expand the Servers node and ensure that the GlassFish application server is running. A green arrow badge next to the server node indicates that the server is running. If the server is not running, right click the server name and choose Start from the context menu.
-
Open the Admin Console in your browser. To do this, follow the steps:
-
Right click GlassFish V2 application server node, and choose Properties from the context menu. The Servers window opens. On the Servers pane, GlassFish V2 should be selected.
-
On the Connection tab, copy the contents of the Location field (by default it is localhost:4848).
-
Paste the string to the browser and press Enter. The GlassFish Admin Console opens in the browser window.
-
-
Log in to the Admin Console using your username and password. By default, the username is admin and the password is adminadmin.
-
On the left pane under the JBI node choose Components -> sun-bpel-engine. The BPEL service engine properties page opens.
-
On the BPEL service engine properties page, select the Loggers tab. On the Loggers tab you can specify log levels for the individual loggers.
-
Choose the appropriate log level for the sun-bpel-engine from the drop down list.
If logging is defined for a process activity, and the log level specified for it corresponds to the log level set for the BPEL SE, after you perform a test run of the process, the selected variable value will be written to the server log file.
Note –The project should be deployed to the application server.
 To view the log file:
-
In the Services window, under the Servers node, right click GlassFish V2 application server node and choose View Server log from the context menu. TheGlassFish server log opens in the Output window. The activity message value will be included in the log, you can use Search to find it. Note, that some overhead information is hidden.
-
You can also open the log in a text editor and see the full information. Navigate to <application server installation directory>/domains/domain1/log/ and open the server.log file with the text editor. The information provided in the log includes the following points, divided with the vertical bar:
-
Date and time of the entry
-
Log level
-
Manager type (for logging this is Trace Manager)
-
Thread
-
The message value
Here is the sample of the log entry :
[#|2008-03-25T09:26:18.796+0300|INFO|sun-appserver9.1|com.sun.jbi.engine.bpel.core.bpel.trace.BPELTraceManager|_ThreadID=26;_ThreadName=BPELSEInOutThread8;|<?xml version="1.0" encoding="UTF-8"?><jbi:message xmlns:msgns="http://localhost/SynchronousSample/SynchronousSample" name="input1" type="msgns:requestMessage" version="1.0" xmlns:jbi="http://java.sun.com/xml/ns/jbi/wsdl-11-wrapper"><jbi:part><syn:typeA xmlns:syn="http://xml.netbeans.org/schema/SynchronousSample"> <syn:paramA>Hello World</syn:paramA> </syn:typeA></jbi:part></jbi:message>|#]
-
- © 2010, Oracle Corporation and/or its affiliates
